Paywall and Market Analysis
Follow the steps in the article to run the AI Growth Advisor analysis and generate a growth plan.
If you already generated a growth plan for the target placement, this analysis will generate new hypotheses to choose from.
Make sure you meet the requirements for the analysis before starting.
Paywall Analysis
Select a paywall for analysis
-
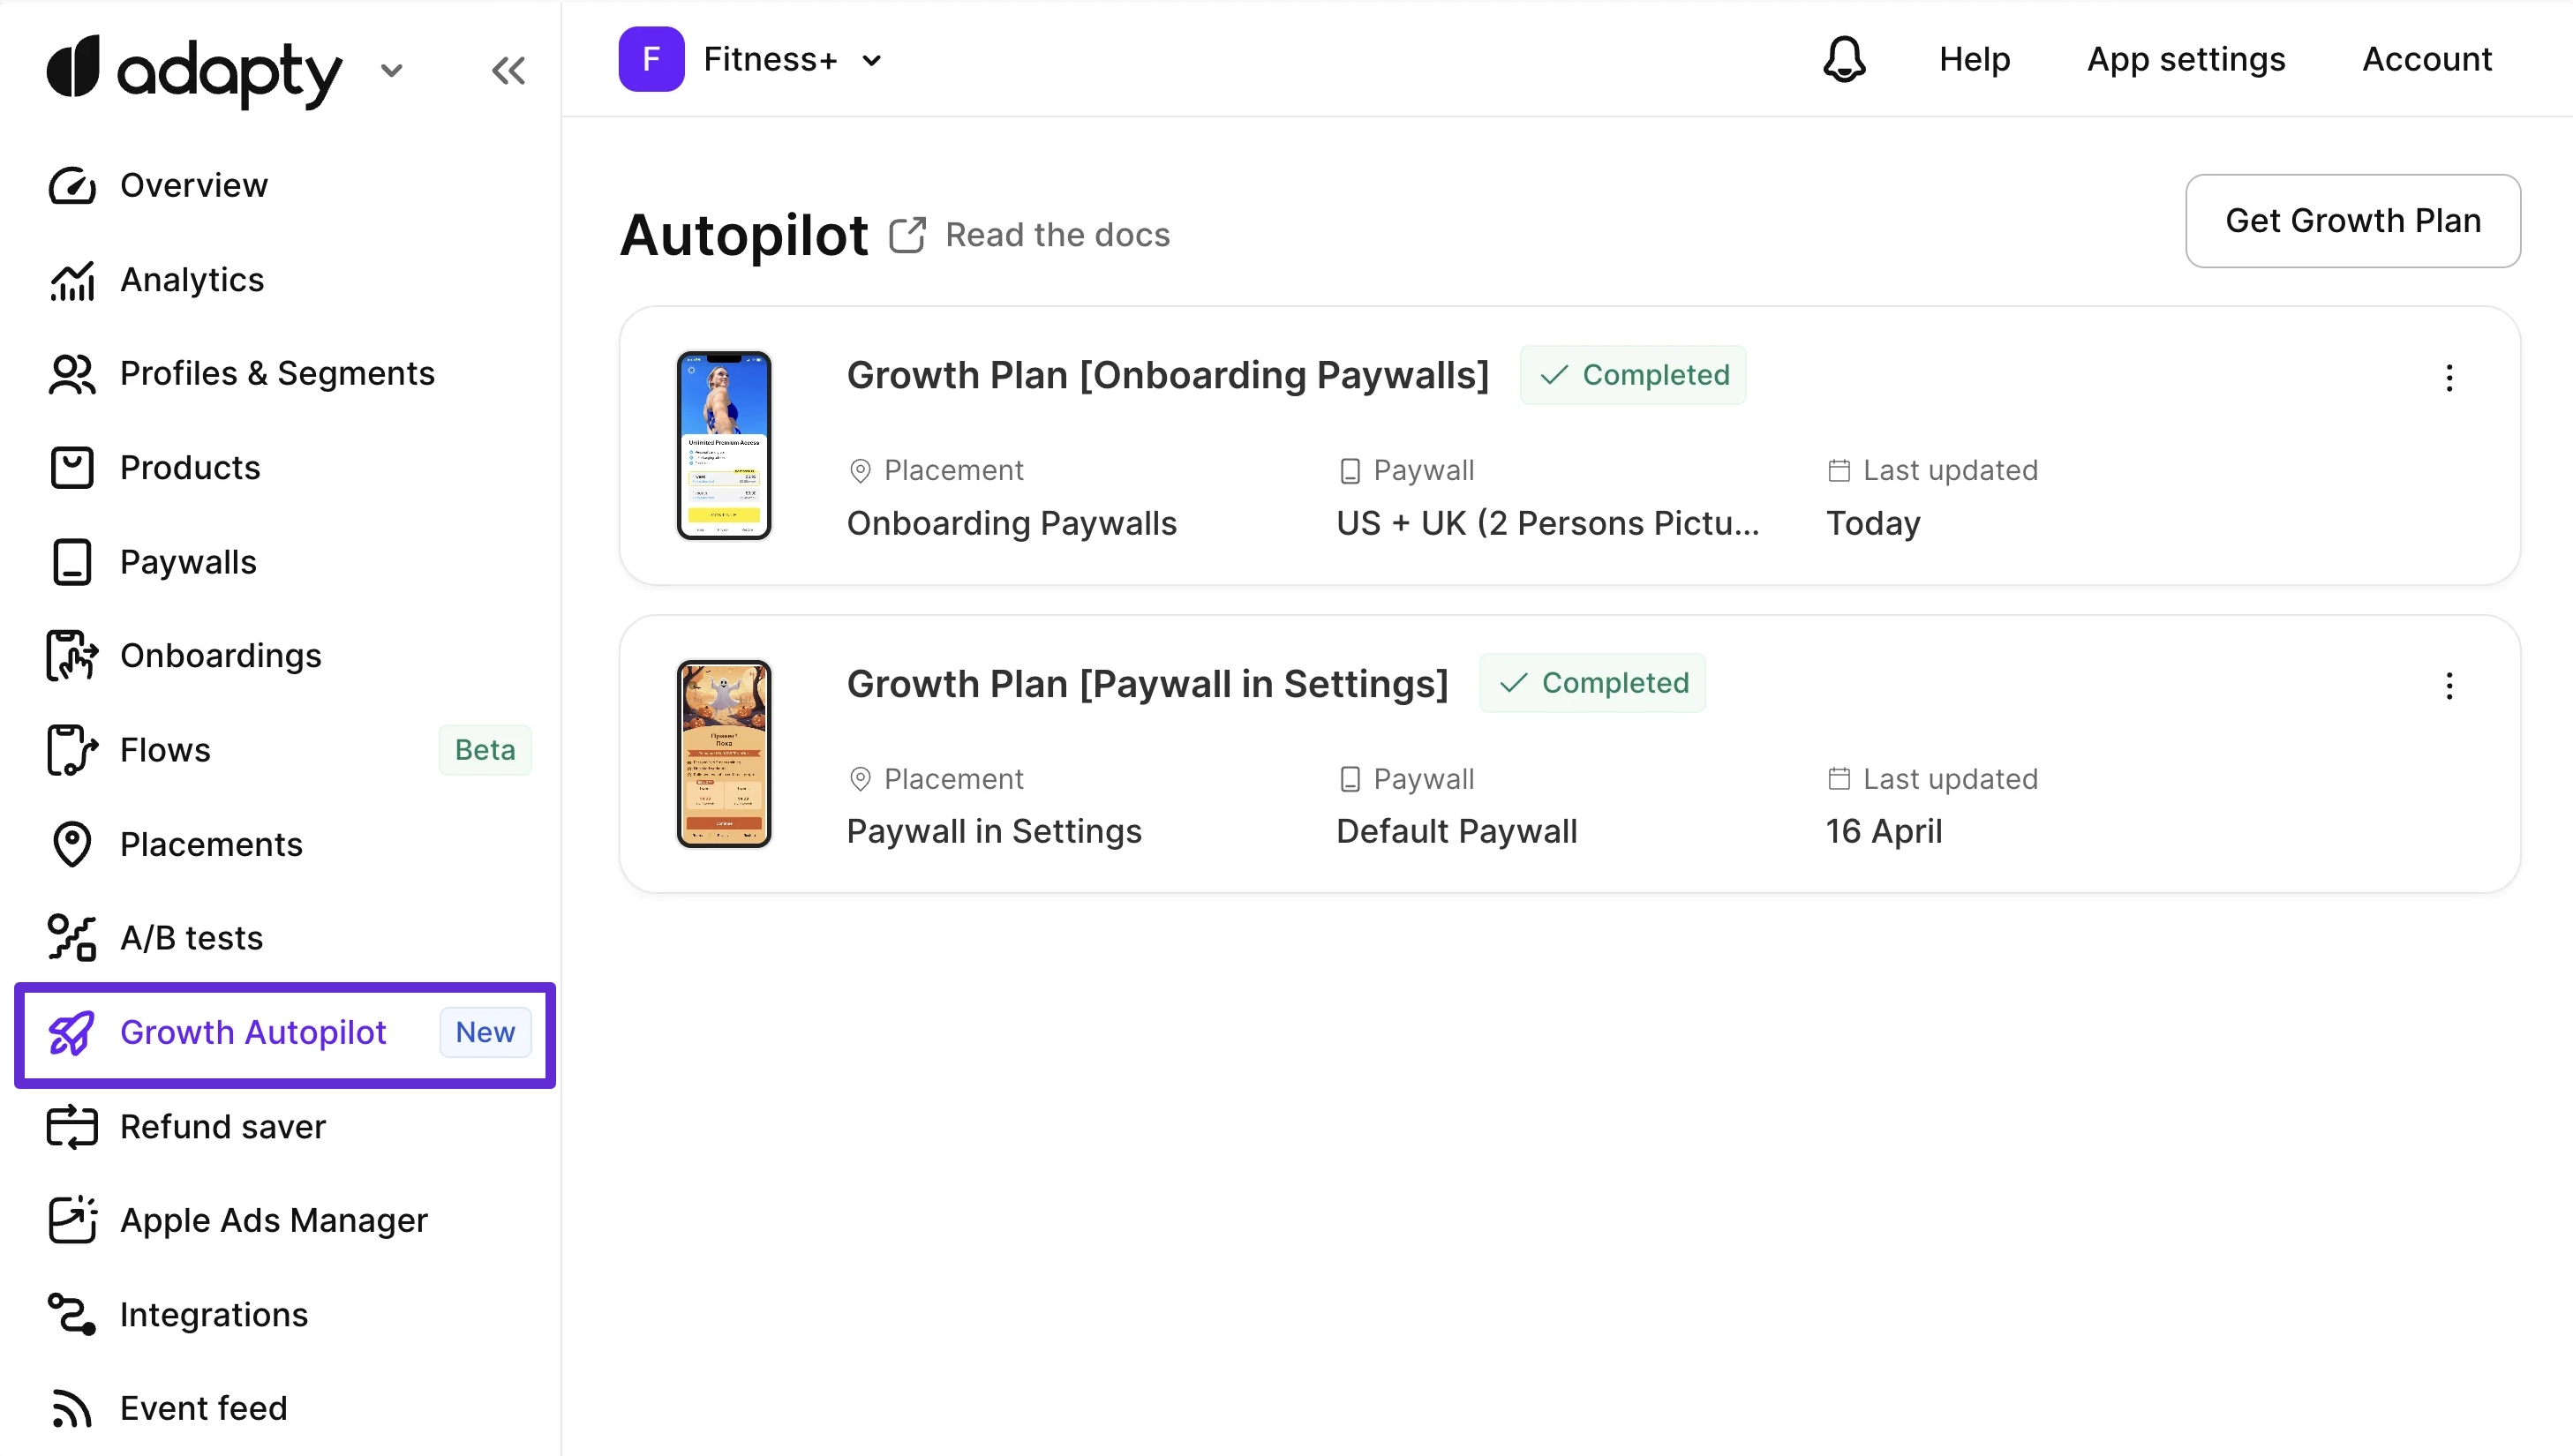
Open the AI Growth Advisor page and click the Get Growth plan button.
-
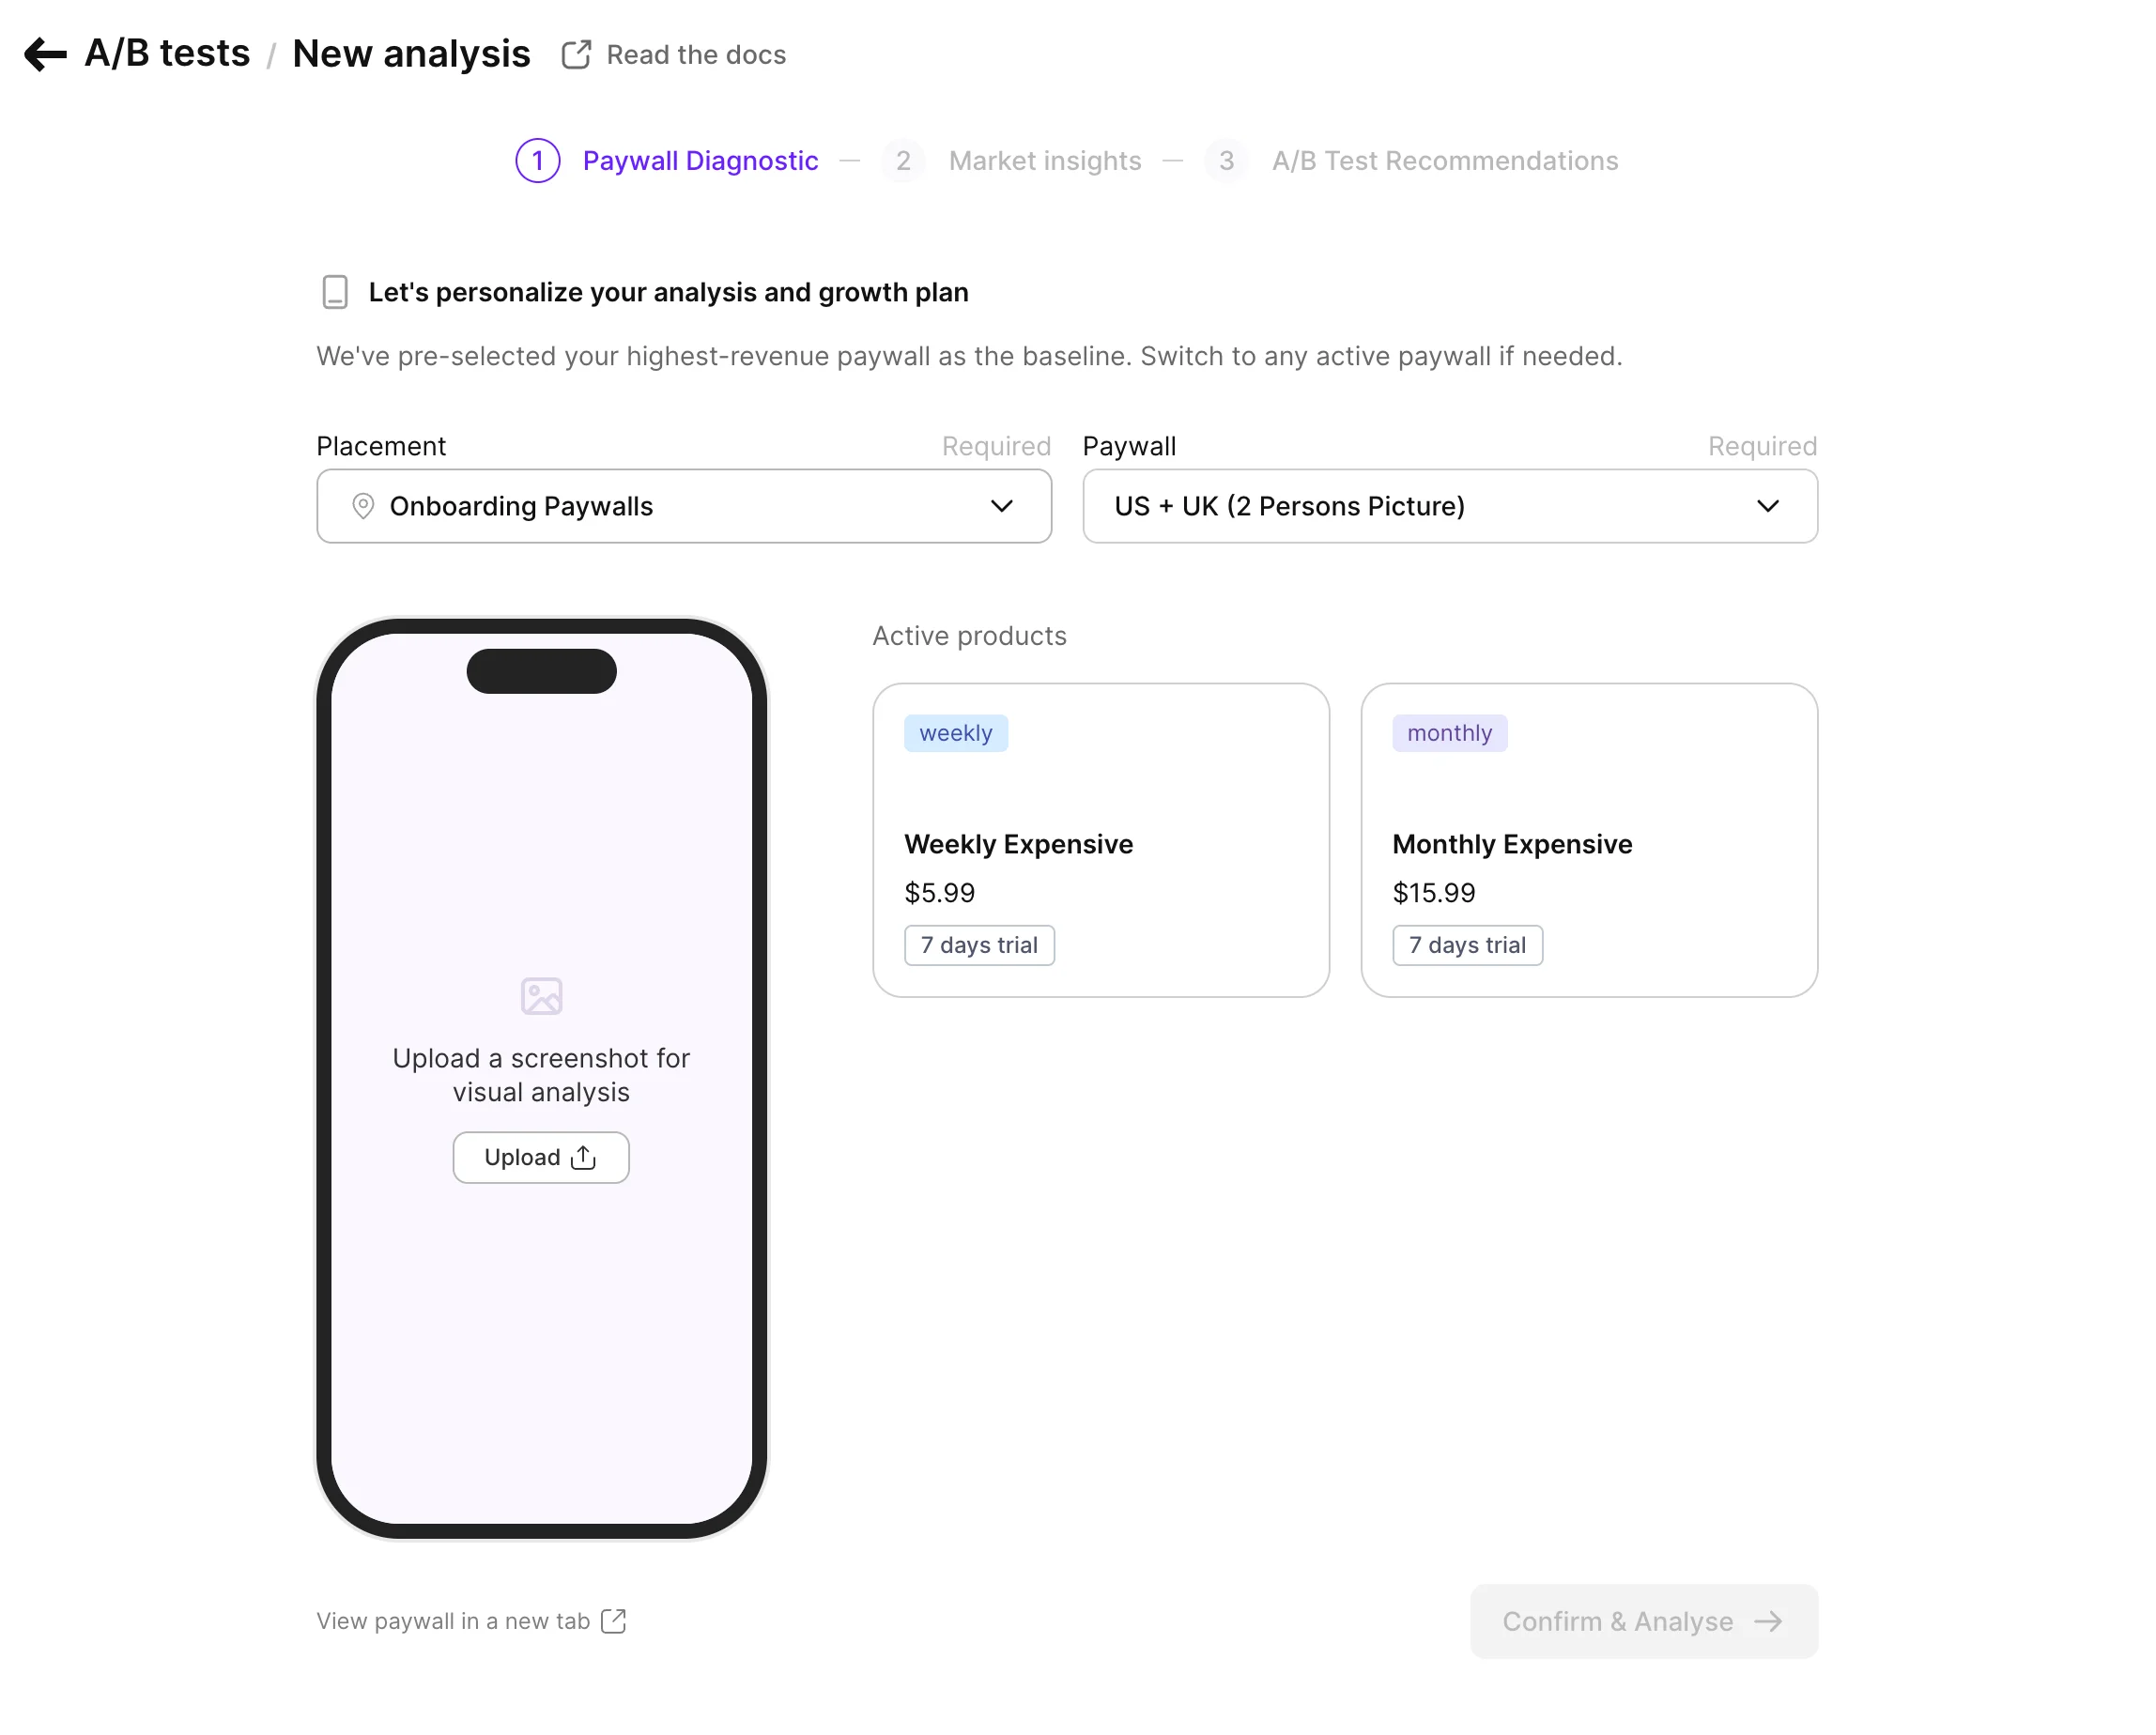
On the Paywall Diagnostic page, select a Placement and Paywall from the dropdowns. Adapty pre-selects the highest-revenue placement and its top paywall. To analyze a different paywall, change the placement first.
-
Upload a screenshot. AI Growth Advisor needs a screenshot to analyze your paywall design and content.
-
Review the paywall’s active products. Product cards on the right display each product’s subscription duration, price, and trial period.
-
Click Confirm & Analyze to proceed. Adapty analyzes your paywall and displays the diagnostic report.
Paywall analysis report
After you select a paywall and upload a screenshot, Adapty analyzes your paywall for established design patterns, highlighting both good choices and improvement opportunities.
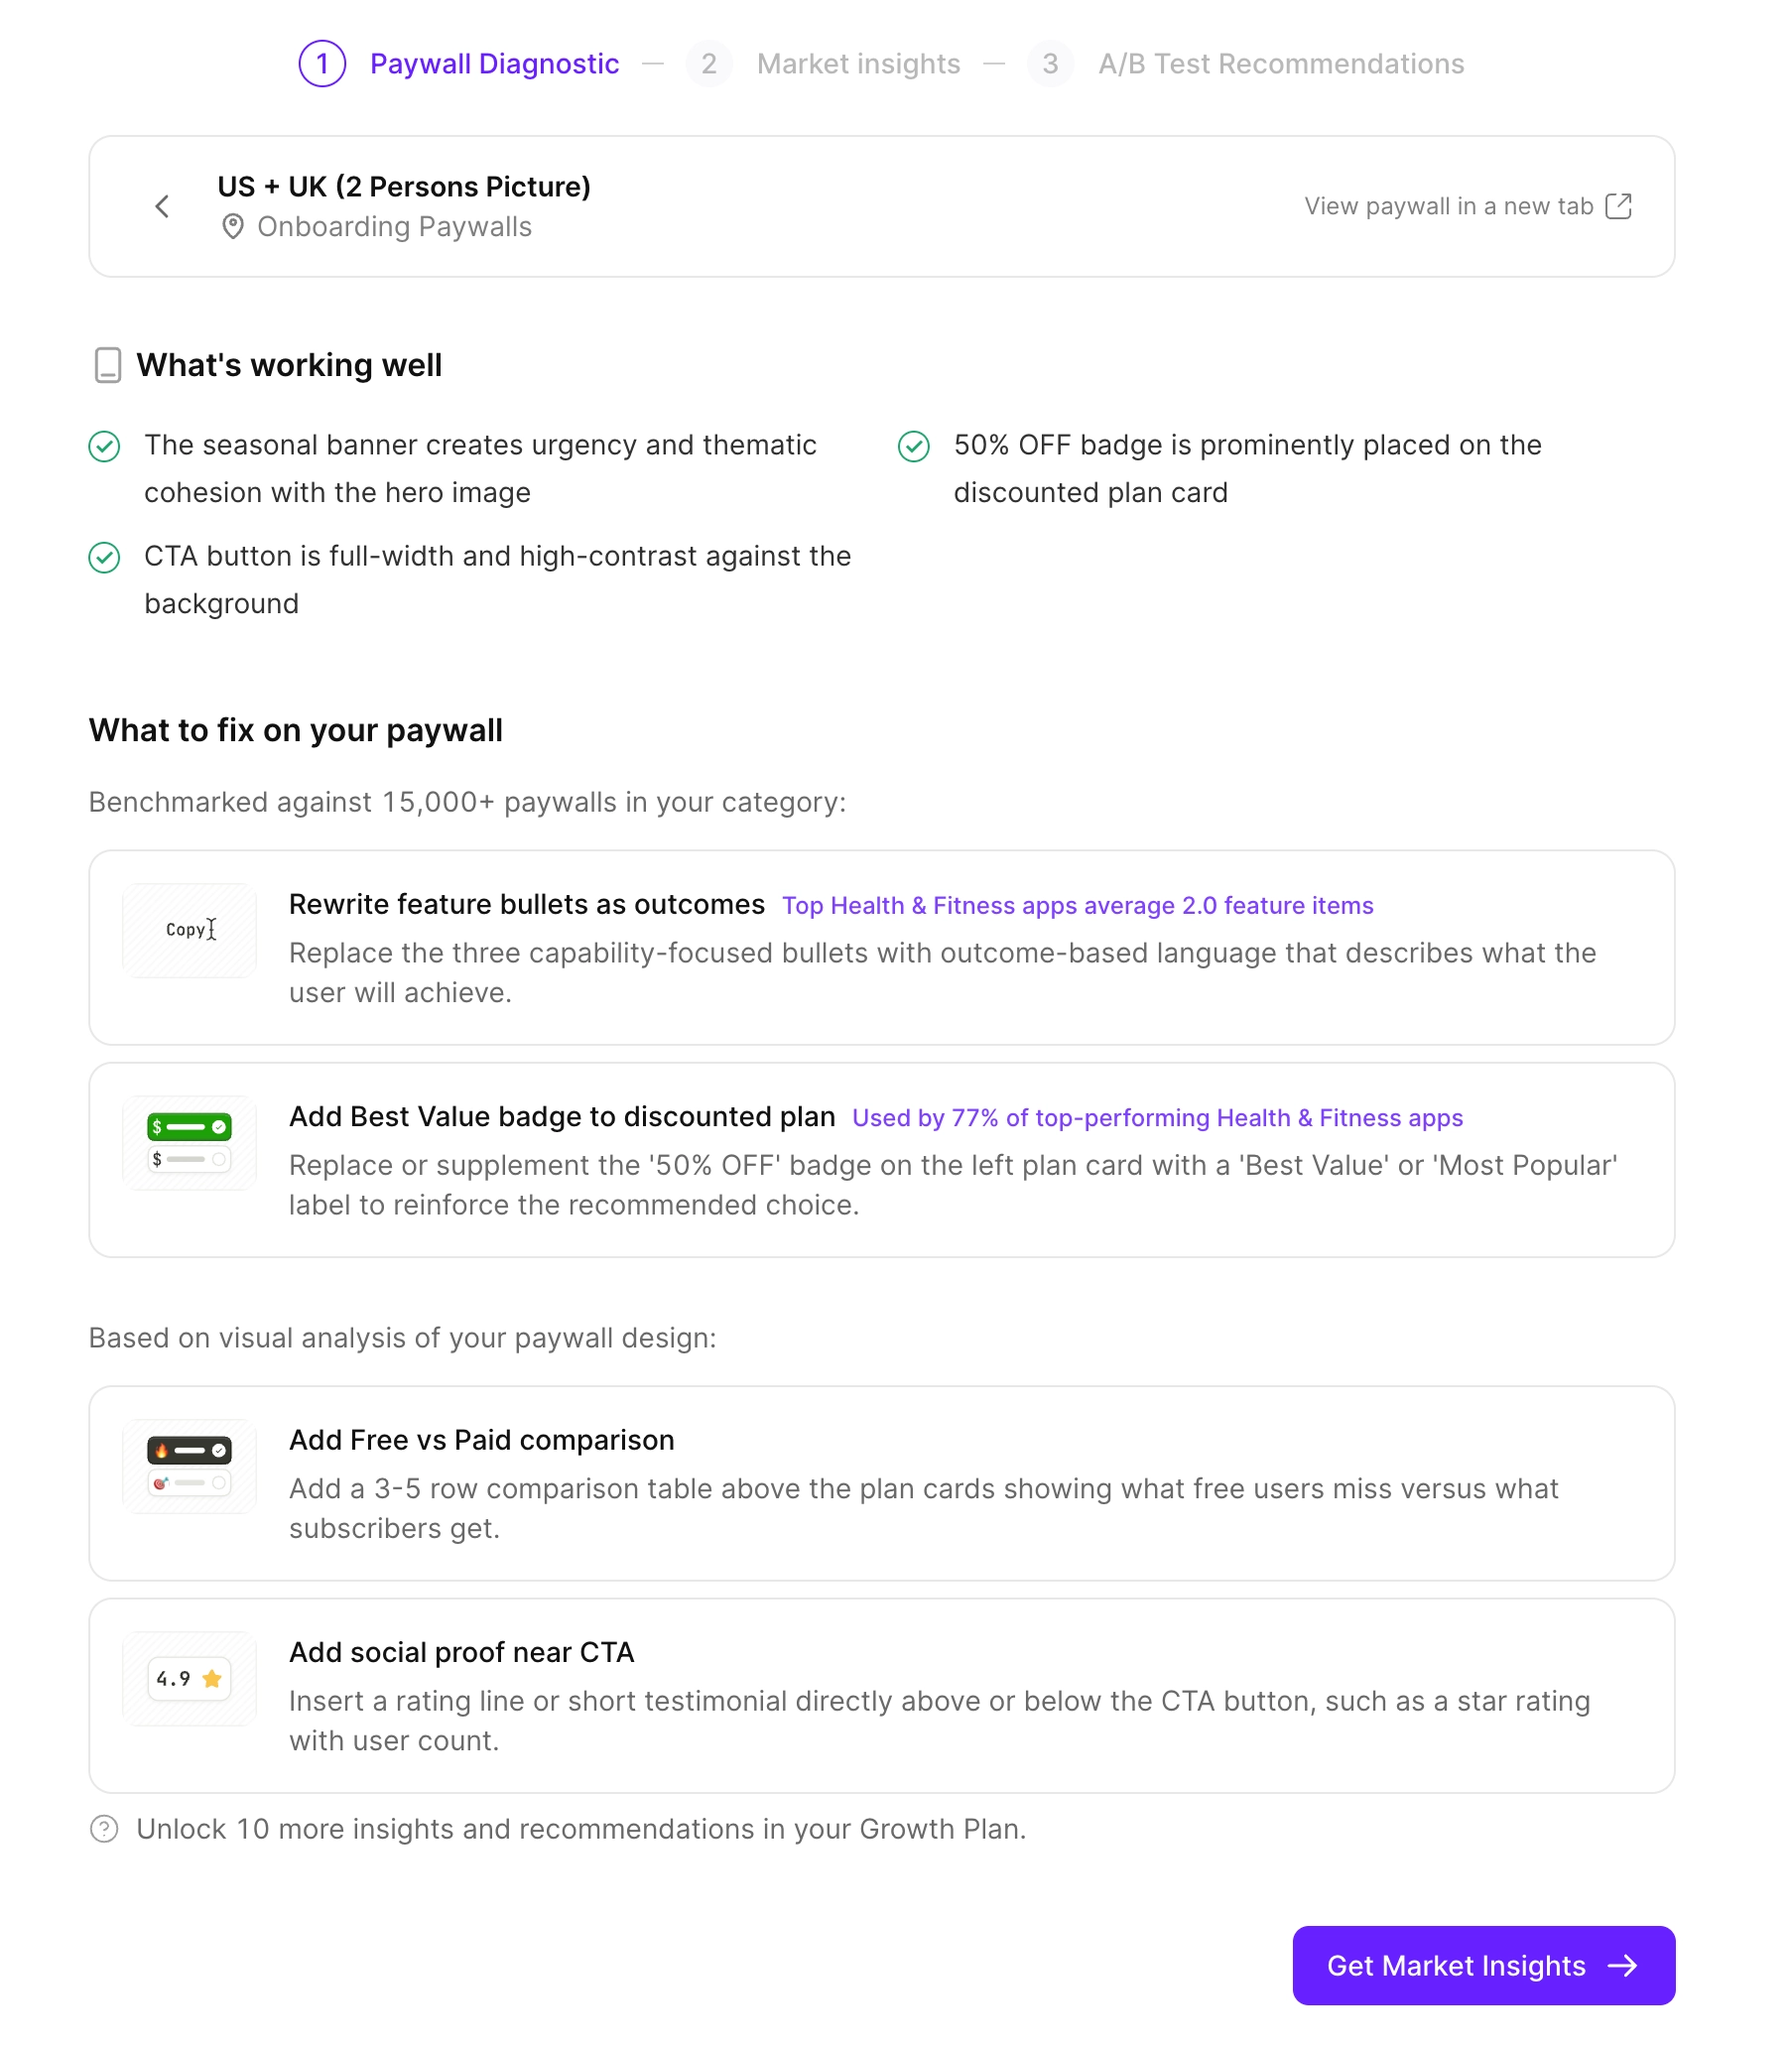
What’s working well
This section highlights your use of established patterns that maximize conversion. For example: a visible savings badge, a prominent user review section, or clear subscription breakdowns.
What to fix on your paywall
Adapty groups its recommendations into two categories:
- Benchmarked recommendations: Data-driven suggestions based on top-performing apps in your category. Each recommendation includes a benchmark stat (for example, “Used by 72% of top-performing Education apps”) and a description of what to change.
- Visual analysis recommendations: AI-generated suggestions based on your paywall screenshot. These include: copy improvements, layout changes, and more.
Your growth plan will include hypotheses based on the benchmarked recommendations. You can add visual analysis suggestions to the plan manually.
Click Get Market Insights to proceed.
Market and Competitor analysis
The market and competitor analysis requires completing the paywall analysis first.
The Market Insights analysis compares your app’s pricing and conversion metrics to its competitors and the industry average. The comparisons are country-specific. To provide a benchmark, Adapty aggregates and analyzes data from App Store apps in your subcategory and country. it’s not publicly available elsewhere.
Select competitors
Select up to 5 competitors for the comparison.
Adapty will pick 5 automatically, and suggest 5 more. You can manually add apps with an App Store link. For better results, select apps with higher MRR than yours.
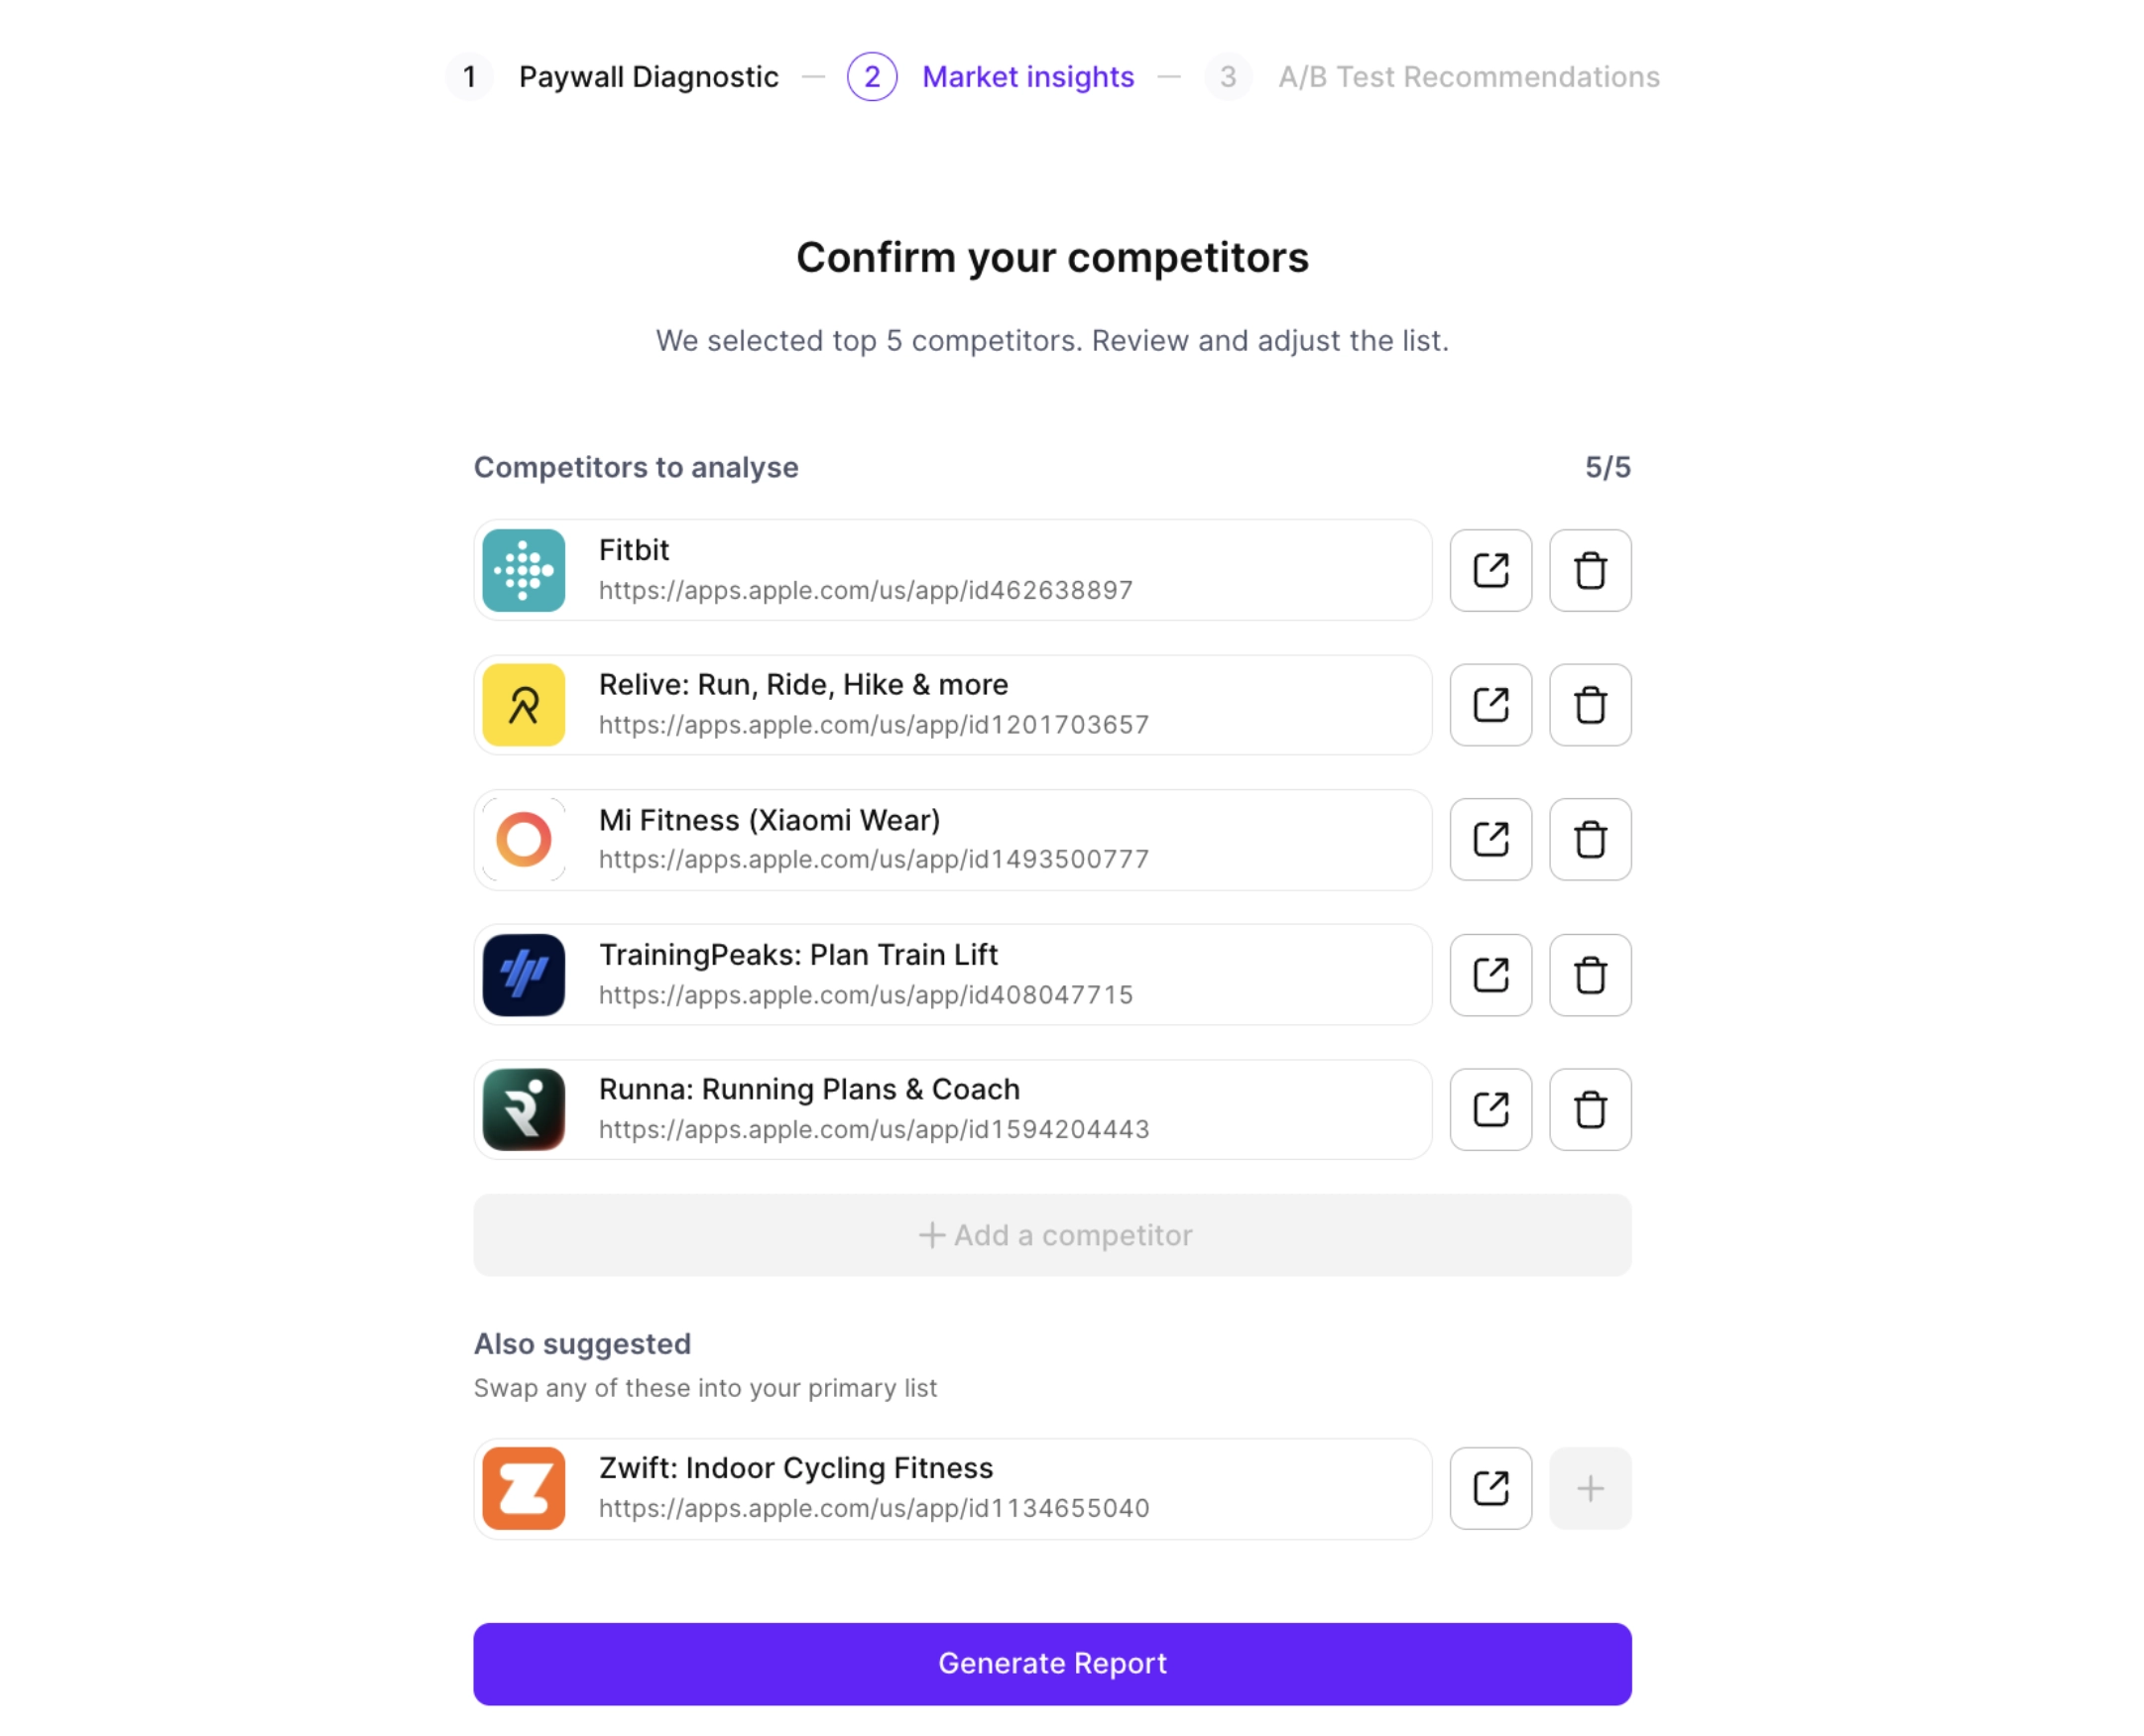
Click Generate report to confirm the list, and wait for the analysis to finish.
Select a country
Use the Country dropdown to select one of your top countries for a detailed analysis.

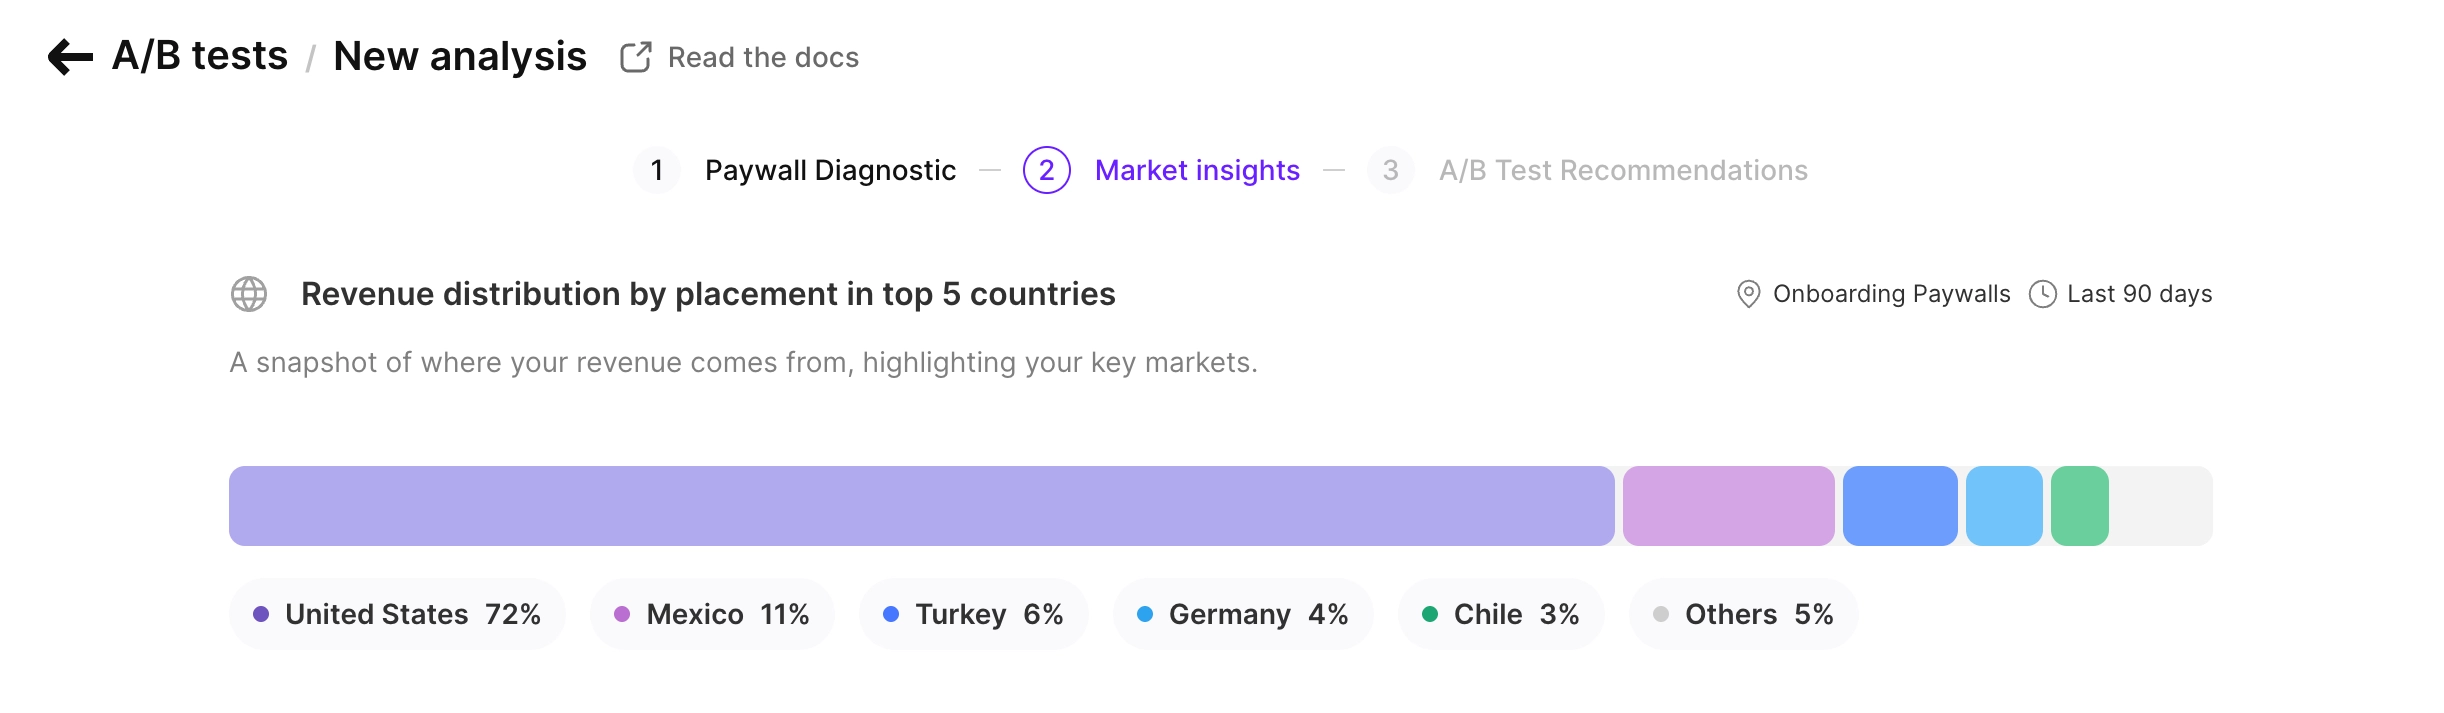
Revenue distribution
This revenue distribution chart shows which countries your revenue comes from, with percentage breakdowns. It highlights your top 5 countries, which are the focus of the rest of the analysis.
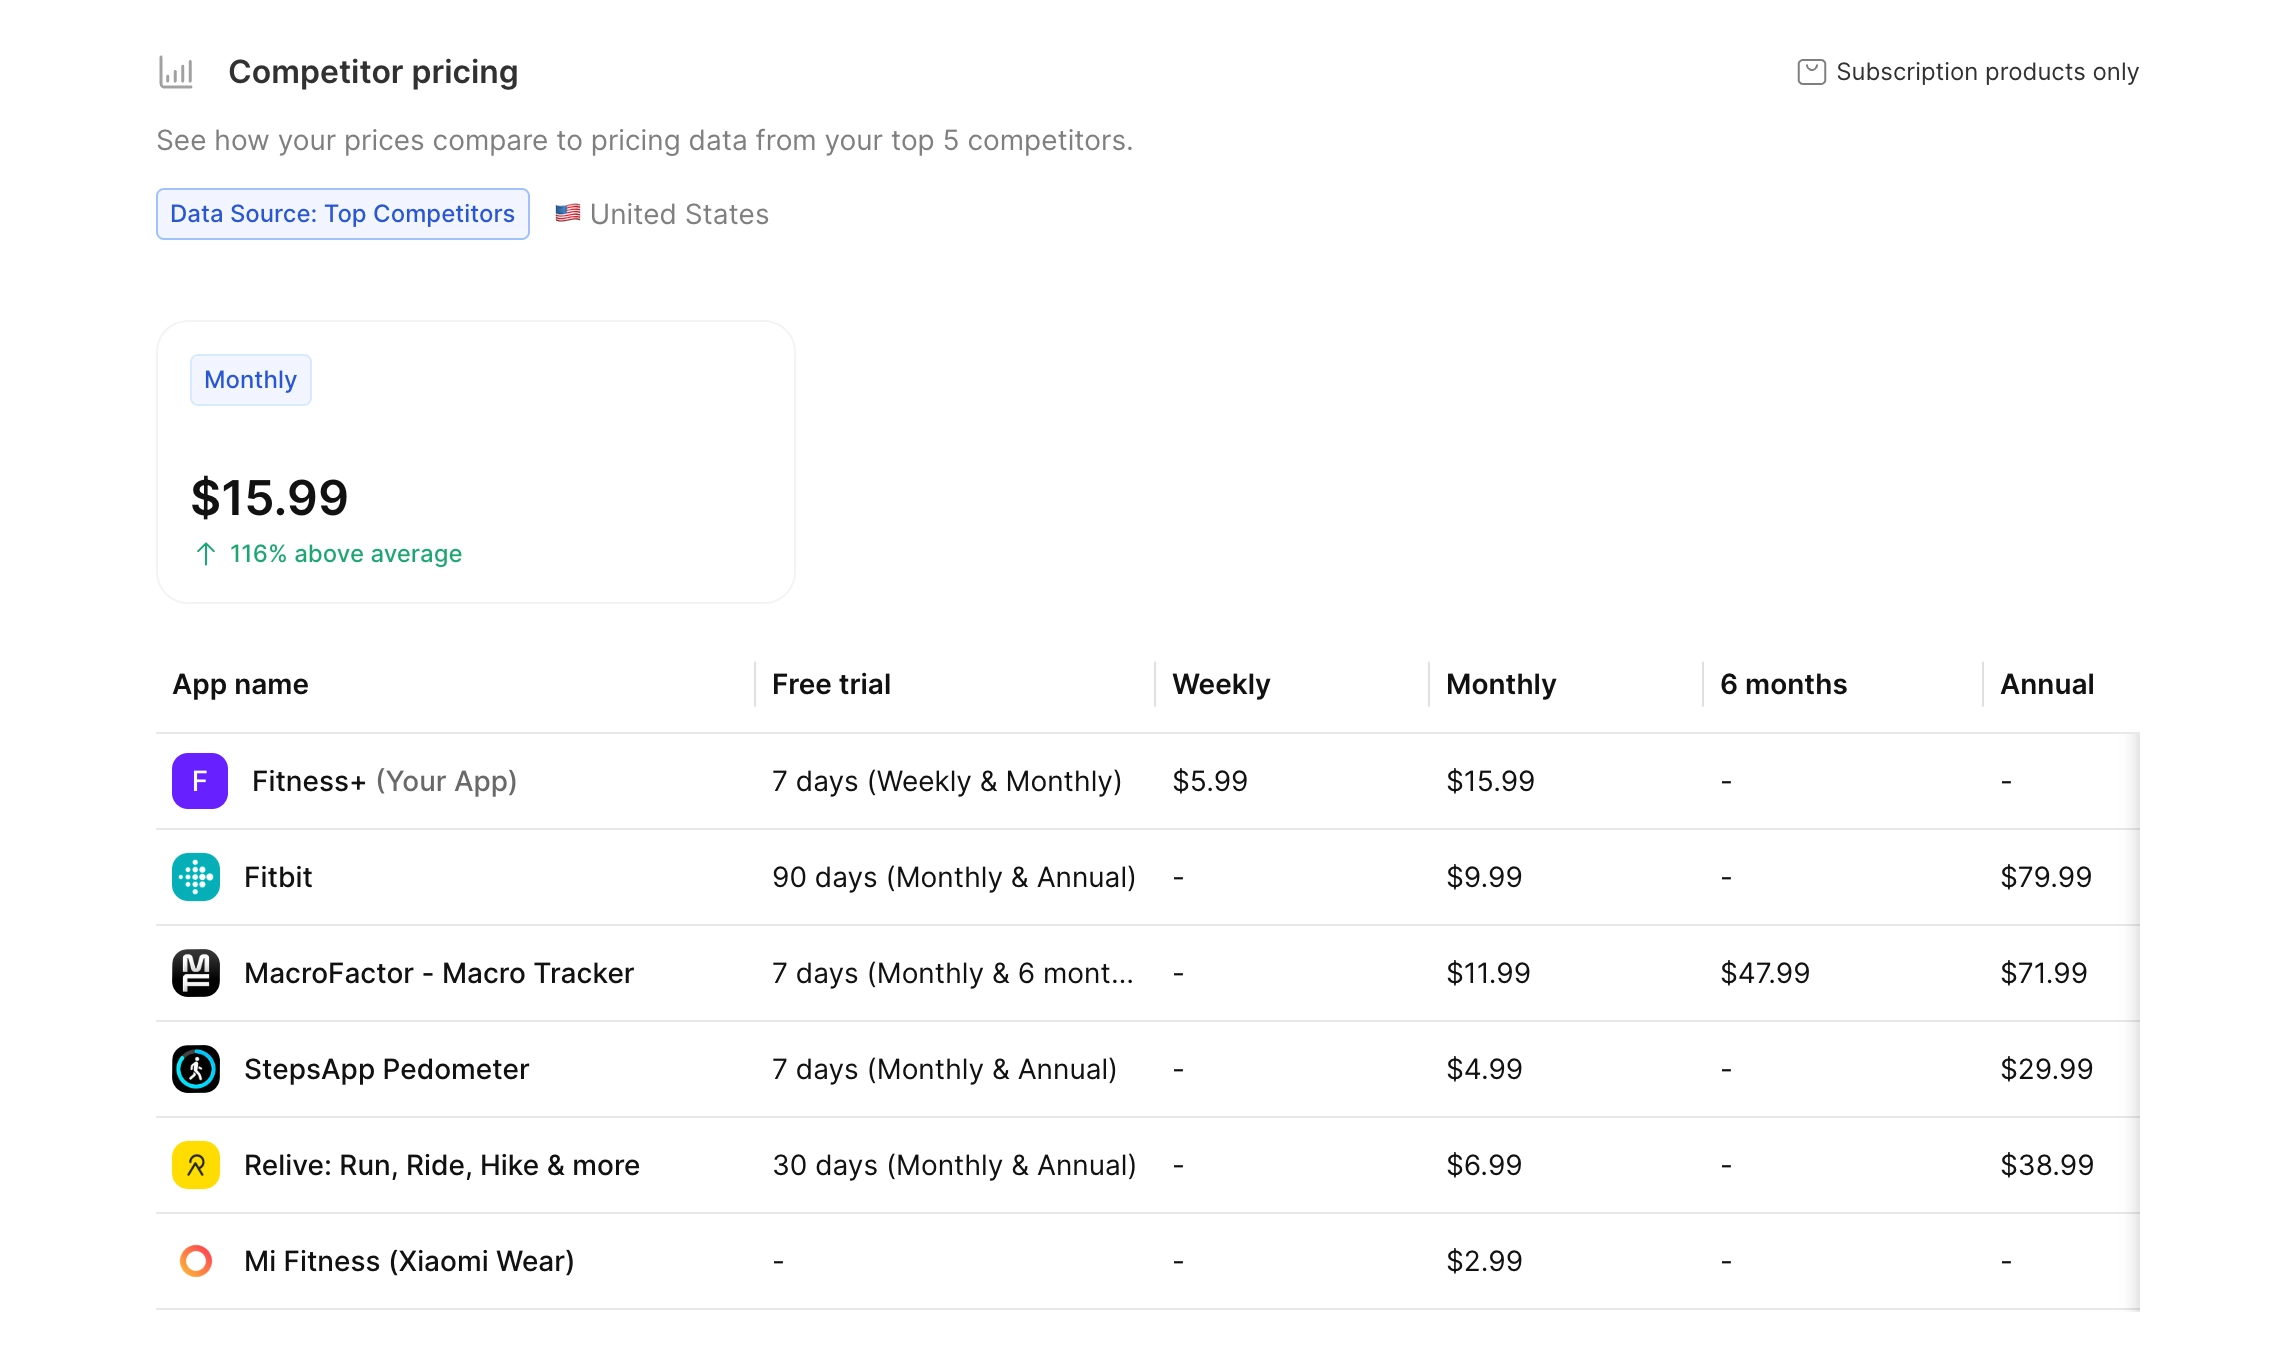
Competitor pricing
The competitor pricing table compares the paywall’s subscription prices to those of your competitors in the selected country. It includes separate columns for each subscription duration.
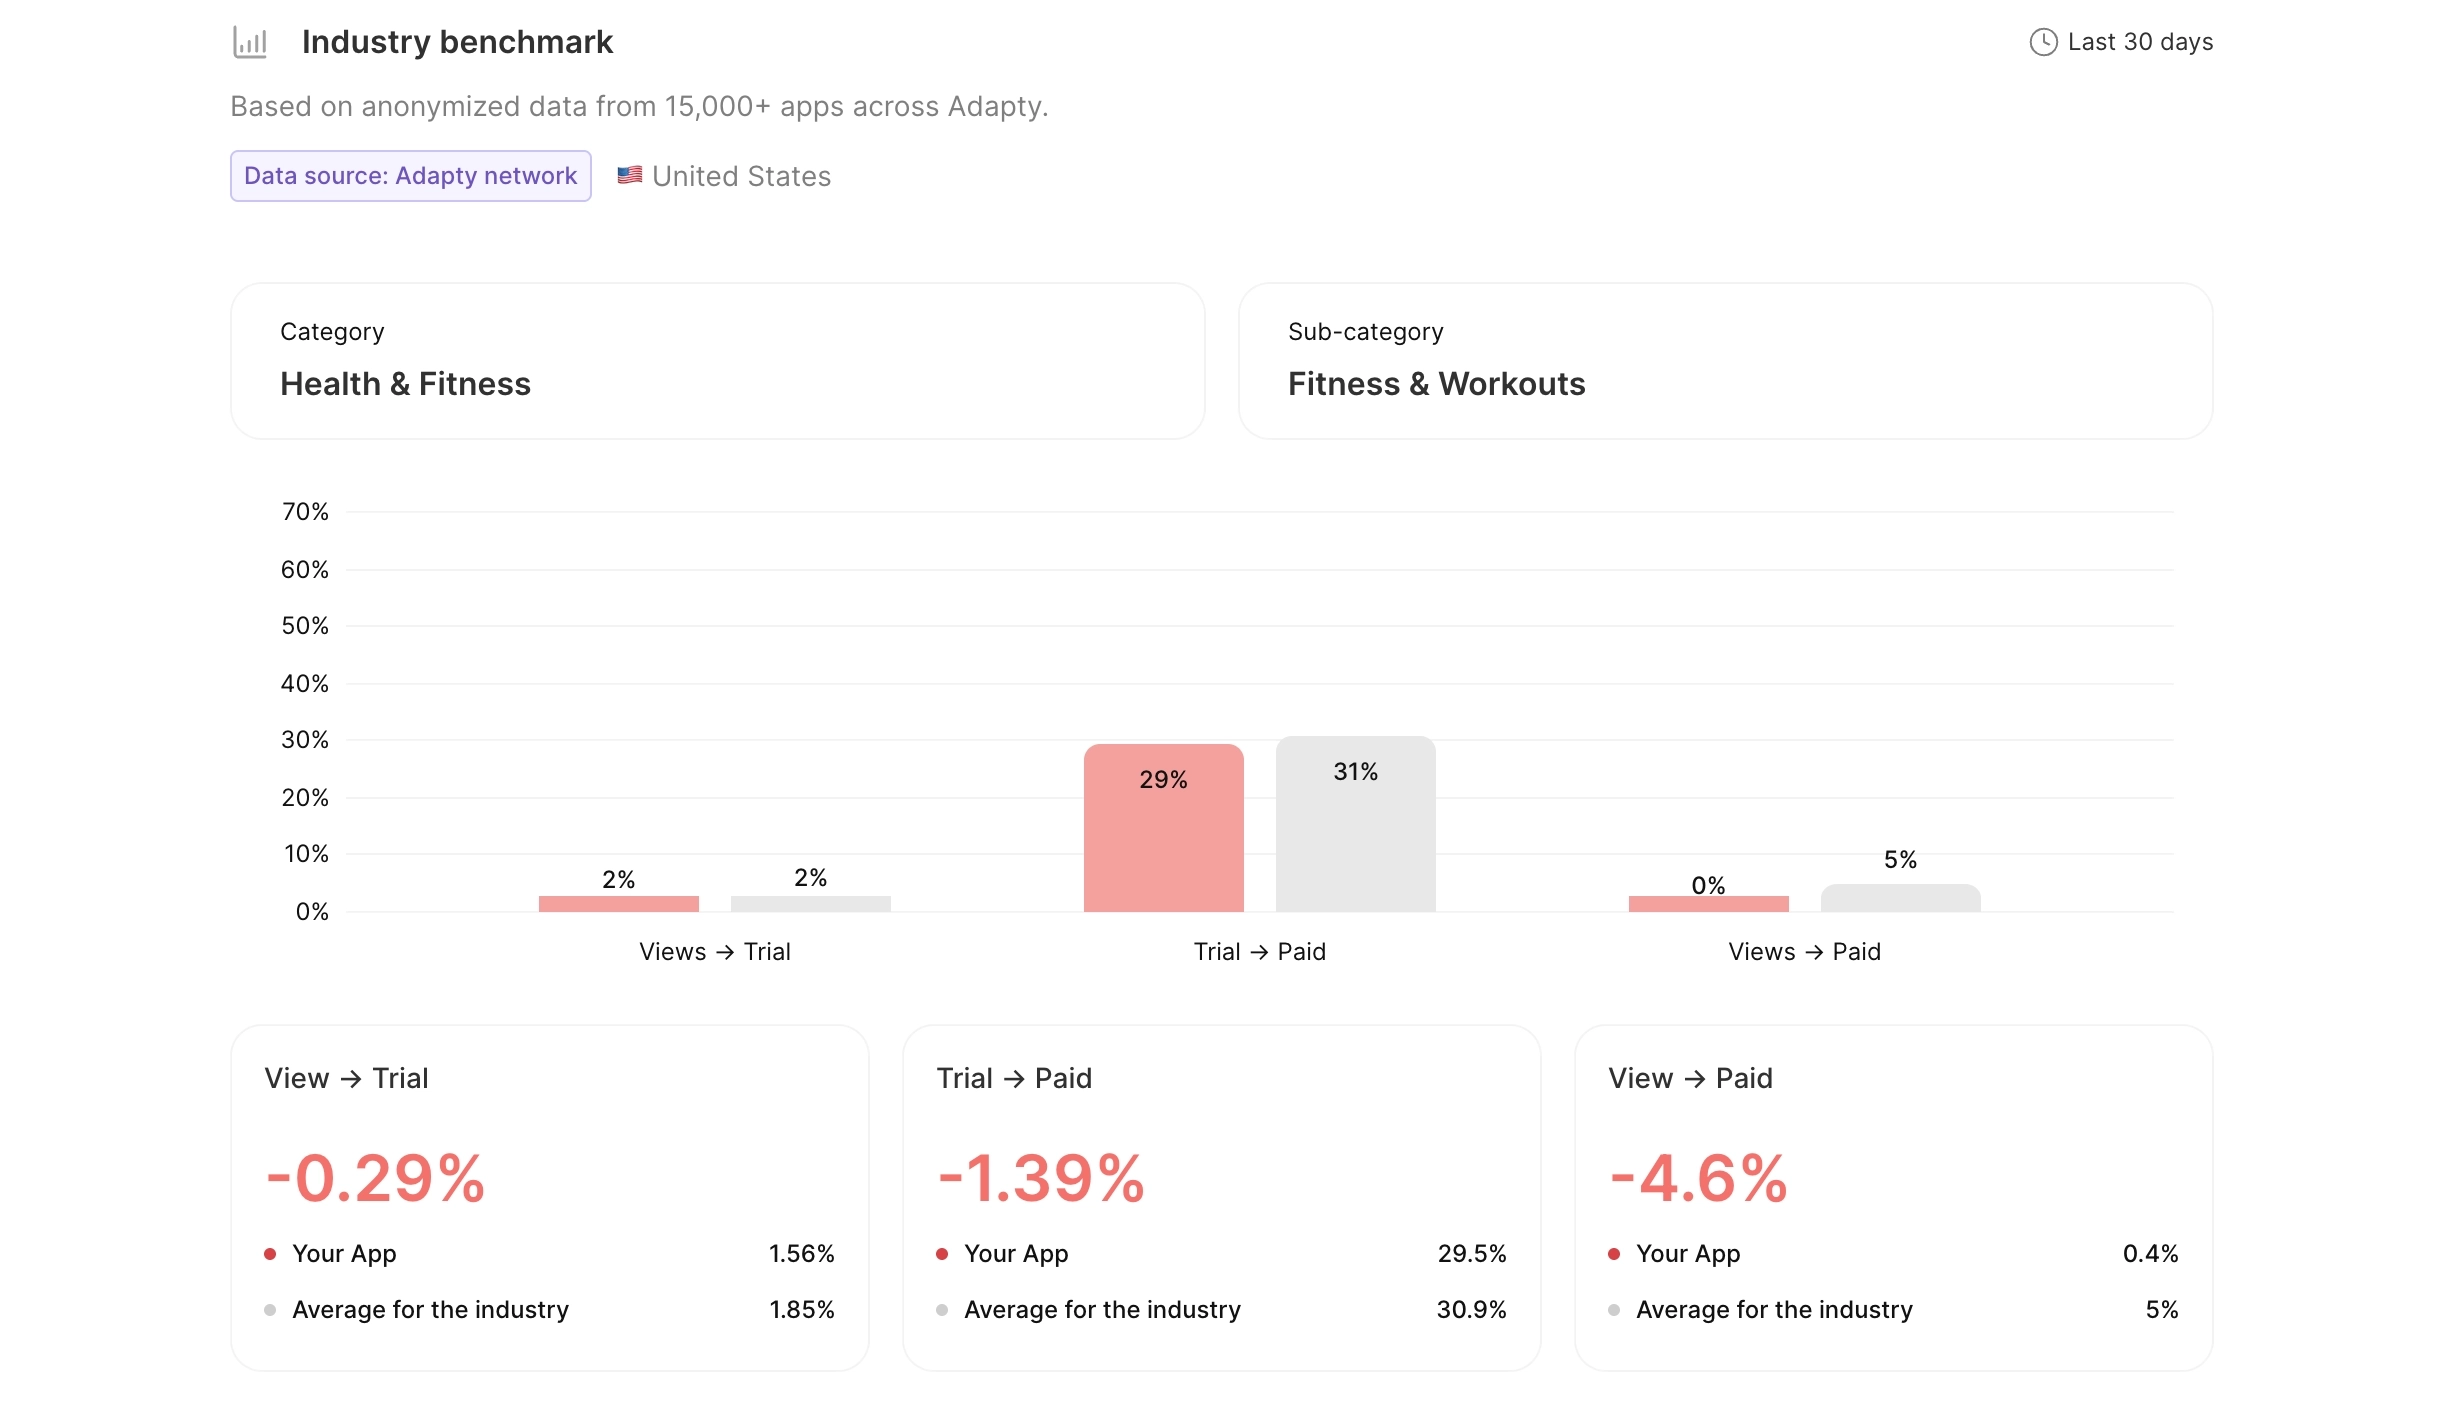
Conversion funnel
The chart shows your conversion rates — Views-to-Trial, Trial-to-Paid, and Views-to-Paid — next to the averages for similar apps.
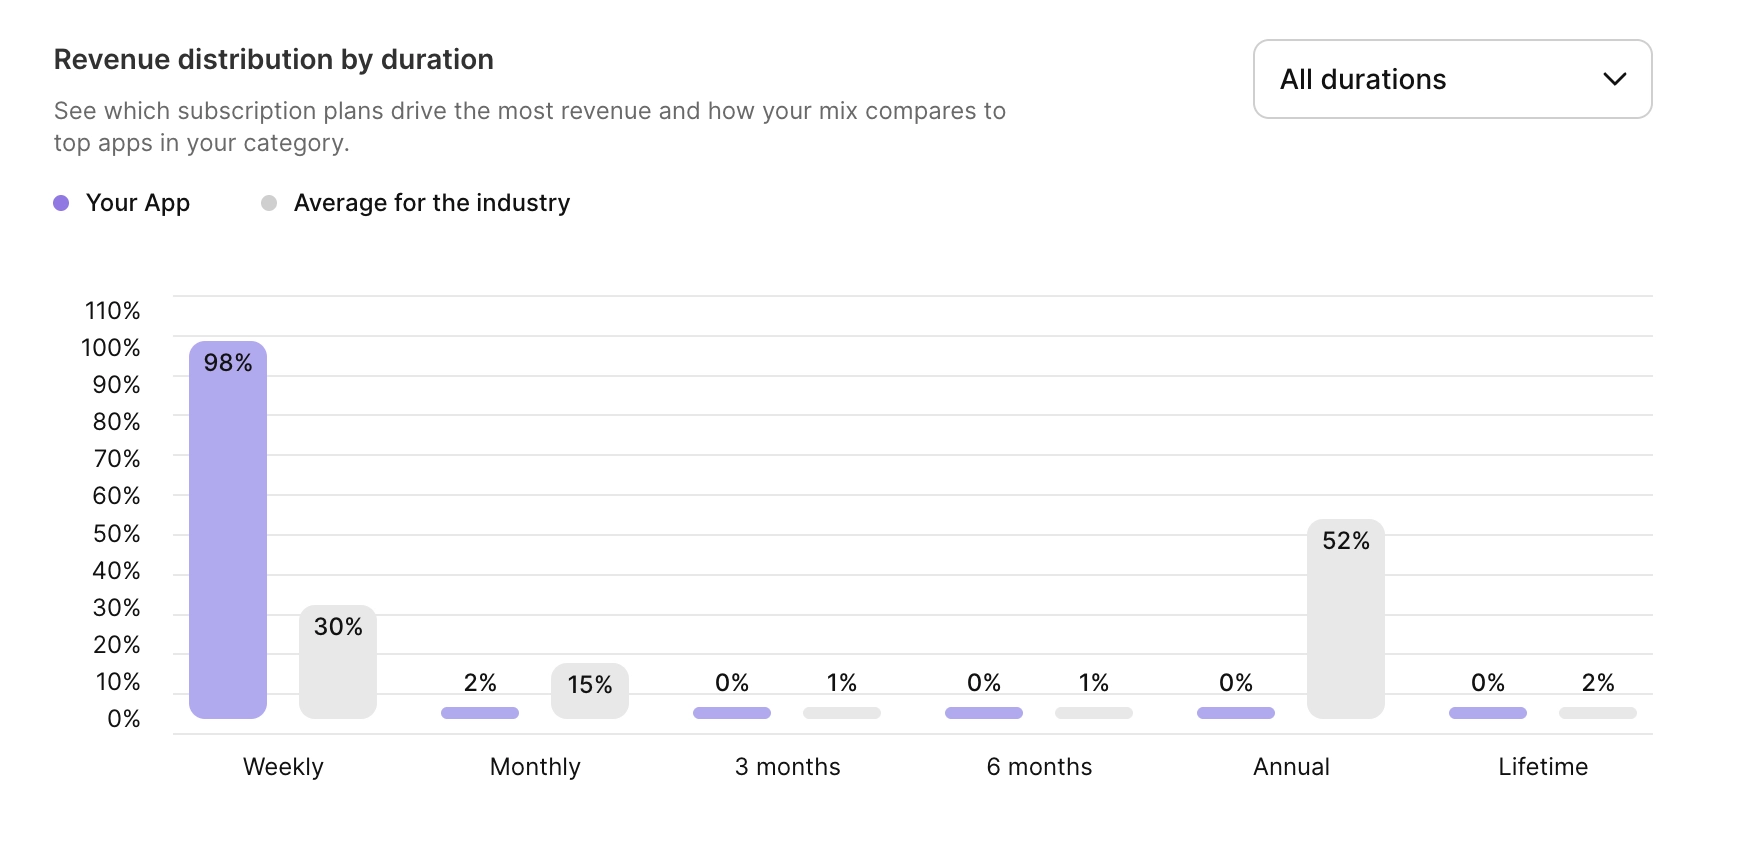
Revenue distribution by duration
This chart shows which subscription durations contribute the most to your revenue, compared to the industry average. If your revenue is heavily skewed towards one duration, it may indicate an opportunity to optimize your pricing strategy.
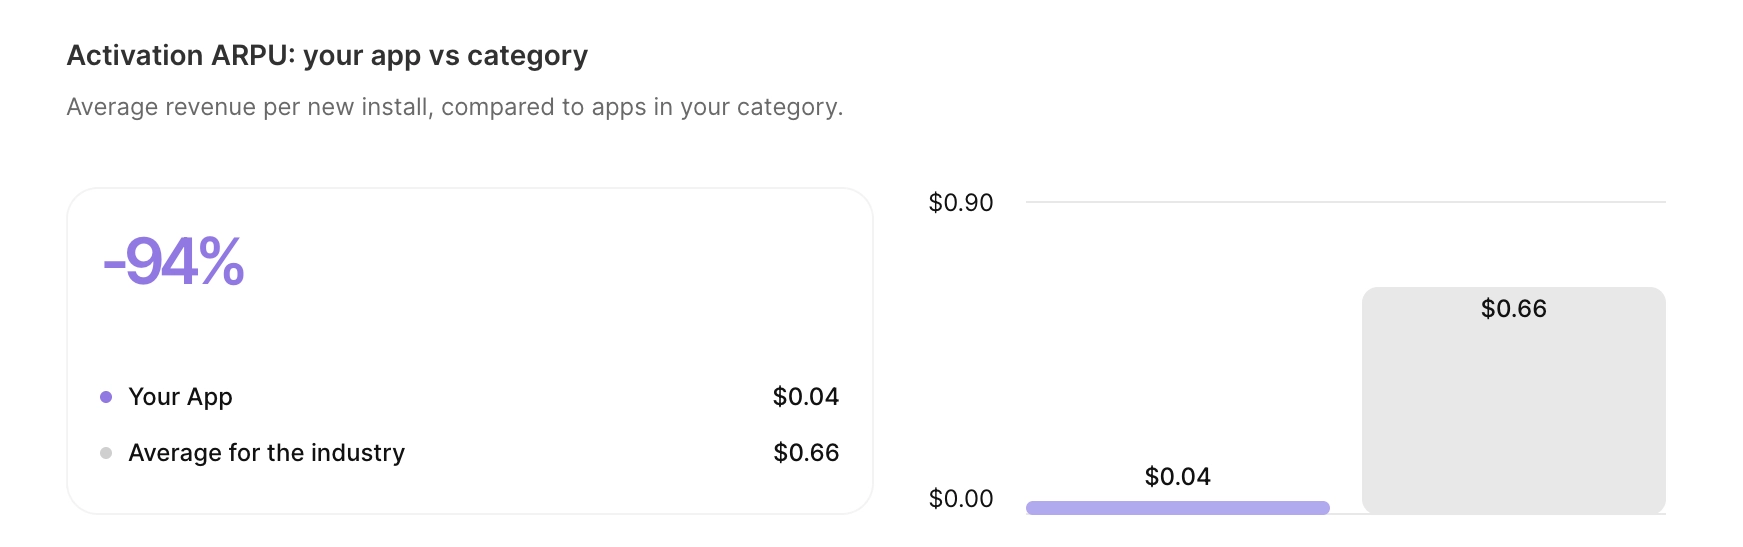
Activation ARPU
The Activation ARPU: your app vs. category chart compares your app’s average revenue per new install to the category average.
Use it alongside the conversion funnel:
- Conversion shows how many users pay.
- Activation ARPU shows the average income per user.
A high conversion rate with a low Activation ARPU may indicate underpriced offers.
The metric is cohort-based. Adapty takes users who installed the app in the last 90 days, and divides the revenue they generated by their number.
Comparison to other metrics
Activation ARPU won’t match the ARPU values you see elsewhere in your dashboard — each metric measures something different.
- The ARPU analytics chart: Includes renewals from older cohorts, so the number is several times higher than Activation ARPU.
- Revenue chart, Period filter set to “Activation”: only counts each user’s first payment. Does not count renewals made by the cohort within the 90-day window.
- Cohort revenue (90 days): The closest equivalent — use this metric as a reference.
Next Steps
Read Execute your growth plan to learn how to run A/B tests based on the analysis results.
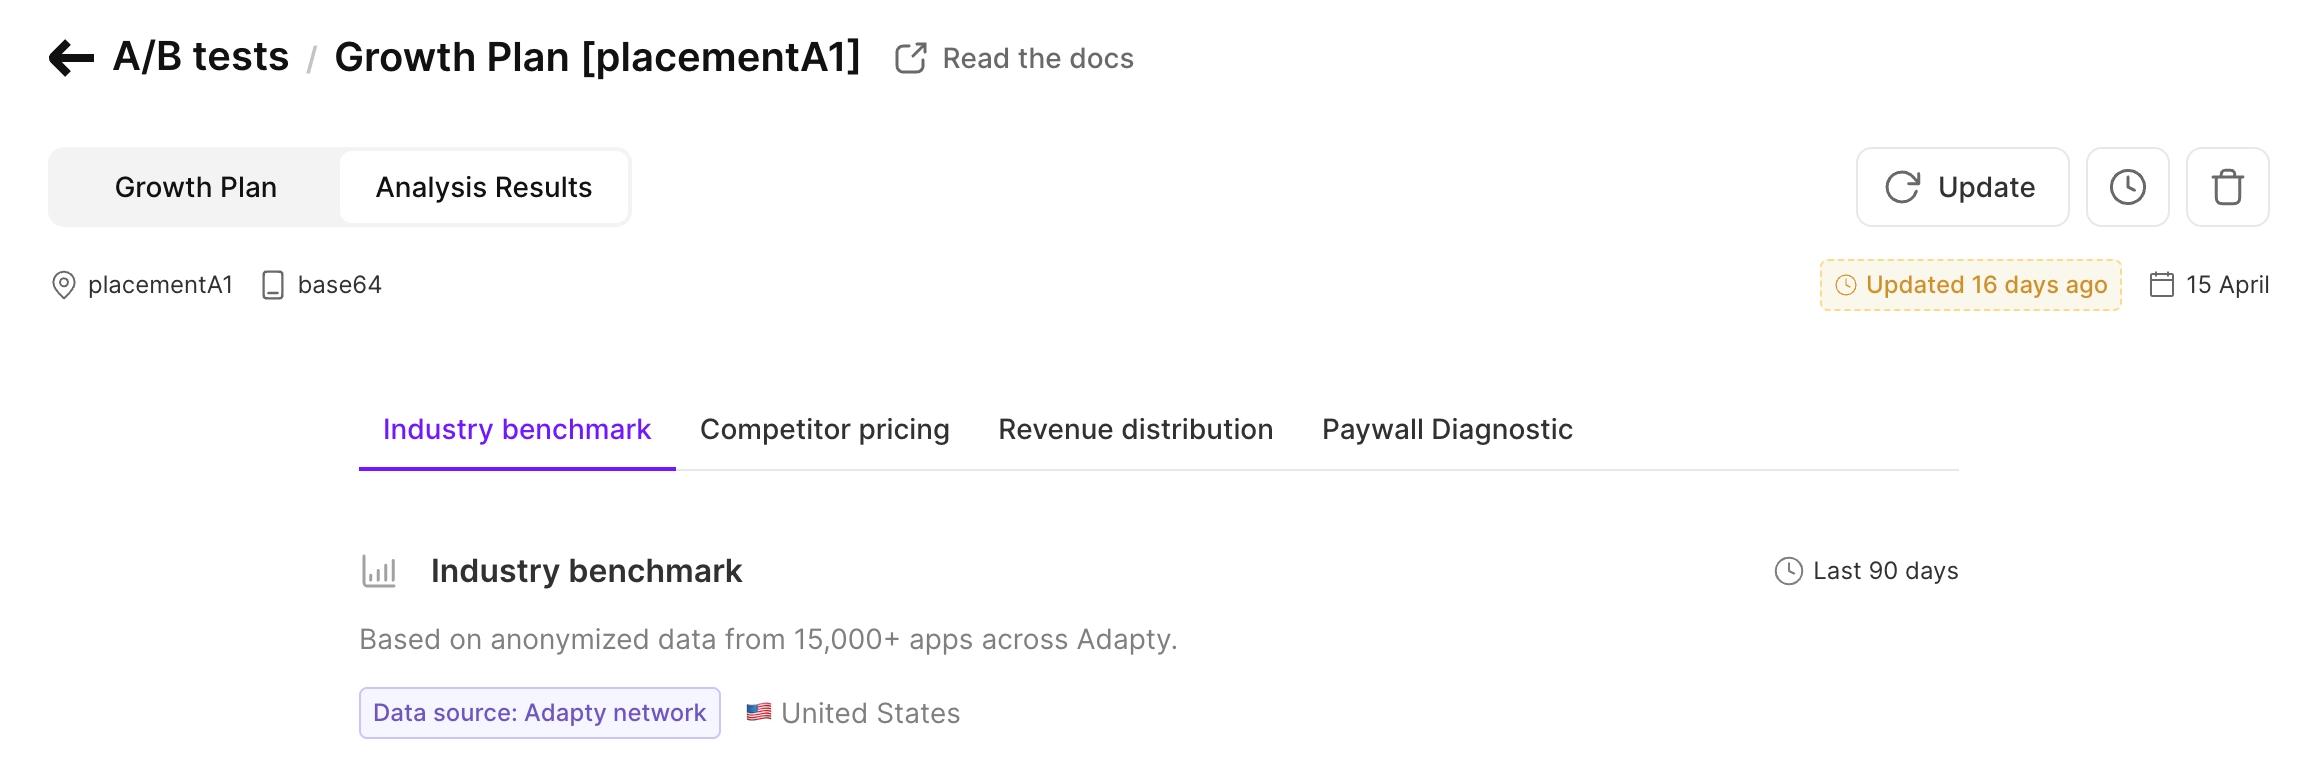
You can always review the analysis report from your growth plan — switch to the Analysis Results tab.