AI Growth Advisor
Growth Advisor is an AI-powered growth tool for subscription apps. It builds a long-term plan to increase your revenue through A/B tests, informed by market data from over 20 thousand apps tracked by Adapty.
Prerequisites
- App Store Connect access — AI Growth Advisor benchmarks against App Store data. Upload your App Store Connect credentials before starting your first analysis.
- At least one priced App Store product on the selected paywall — paywalls configured for Google Play only can’t be analyzed. Add an App Store product in the Products section before starting.
- Paywall placement — flow placements are in beta and can’t be analyzed by AI Growth Advisor yet.
- Note: AI Growth Advisor works for all apps — but the more financial data Adapty can analyze, the more reliable the recommendations.
How AI Growth Advisor works
The AI Growth Advisor: How it works article explains how Adapty generates its recommendations.
- AI Growth Advisor analyzes your paywall’s content and design, highlights things that work, and detects opportunities for conversion improvement.
- Recommendations compare your design to patterns from top-performing apps in your category.
- The analysis focuses only on subscription products. Consumable in-app purchases are not included.
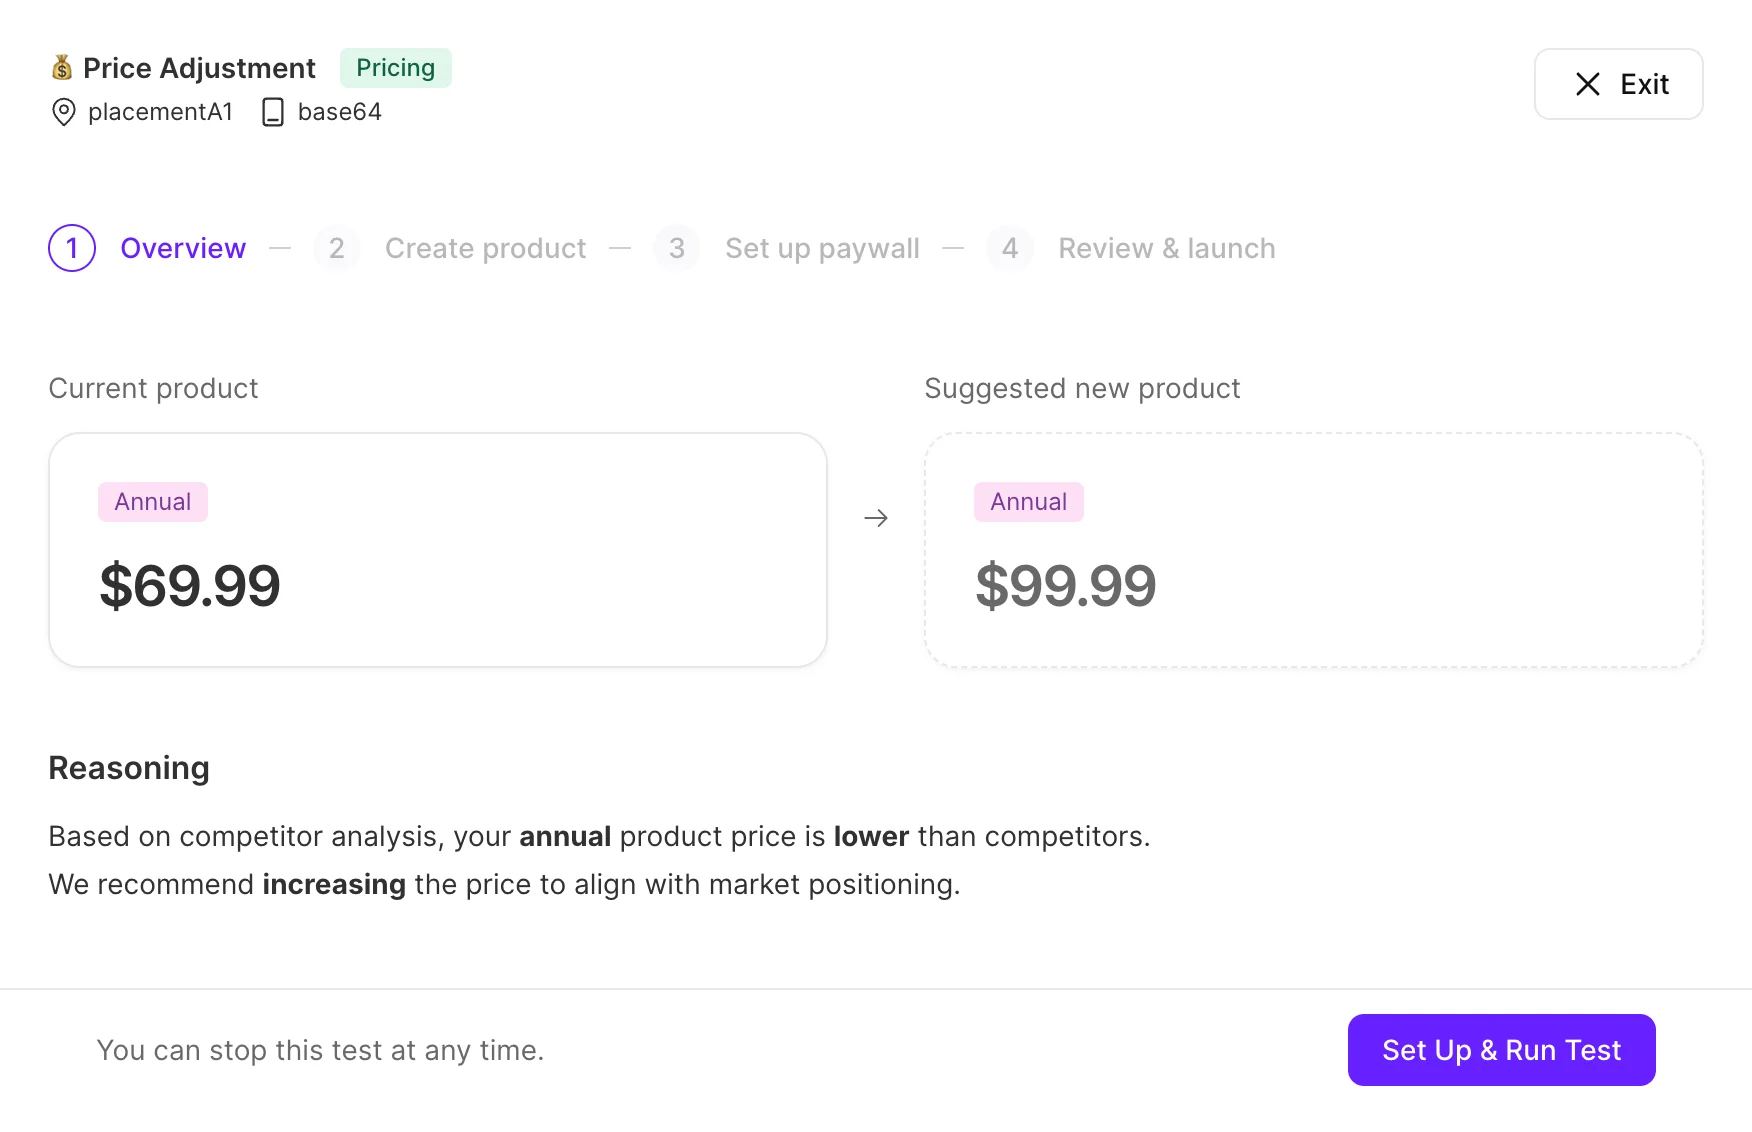
- Across your top markets, AI Growth Advisor recommends per-country price adjustments and compares your conversion to similar apps.
- Conversion benchmarks draw on anonymized data across the 20,000-app Adapty network.
- Pricing recommendations draw on the Adapty Pricing Index, a country-level benchmark of what subscribers actually pay.
- After the analysis is complete, AI Growth Advisor presents an actionable growth plan for the selected placement. Each hypothesis is an A/B test to try out a new approach. As market conditions change, you can re-run the analysis and expand your plan with new hypotheses.
- Run the suggested tests one by one. Based on our estimates, running the full set of recommended tests could increase your revenue by up to 80%.
Run the analysis
Main article: Paywall and Market Analysis
-
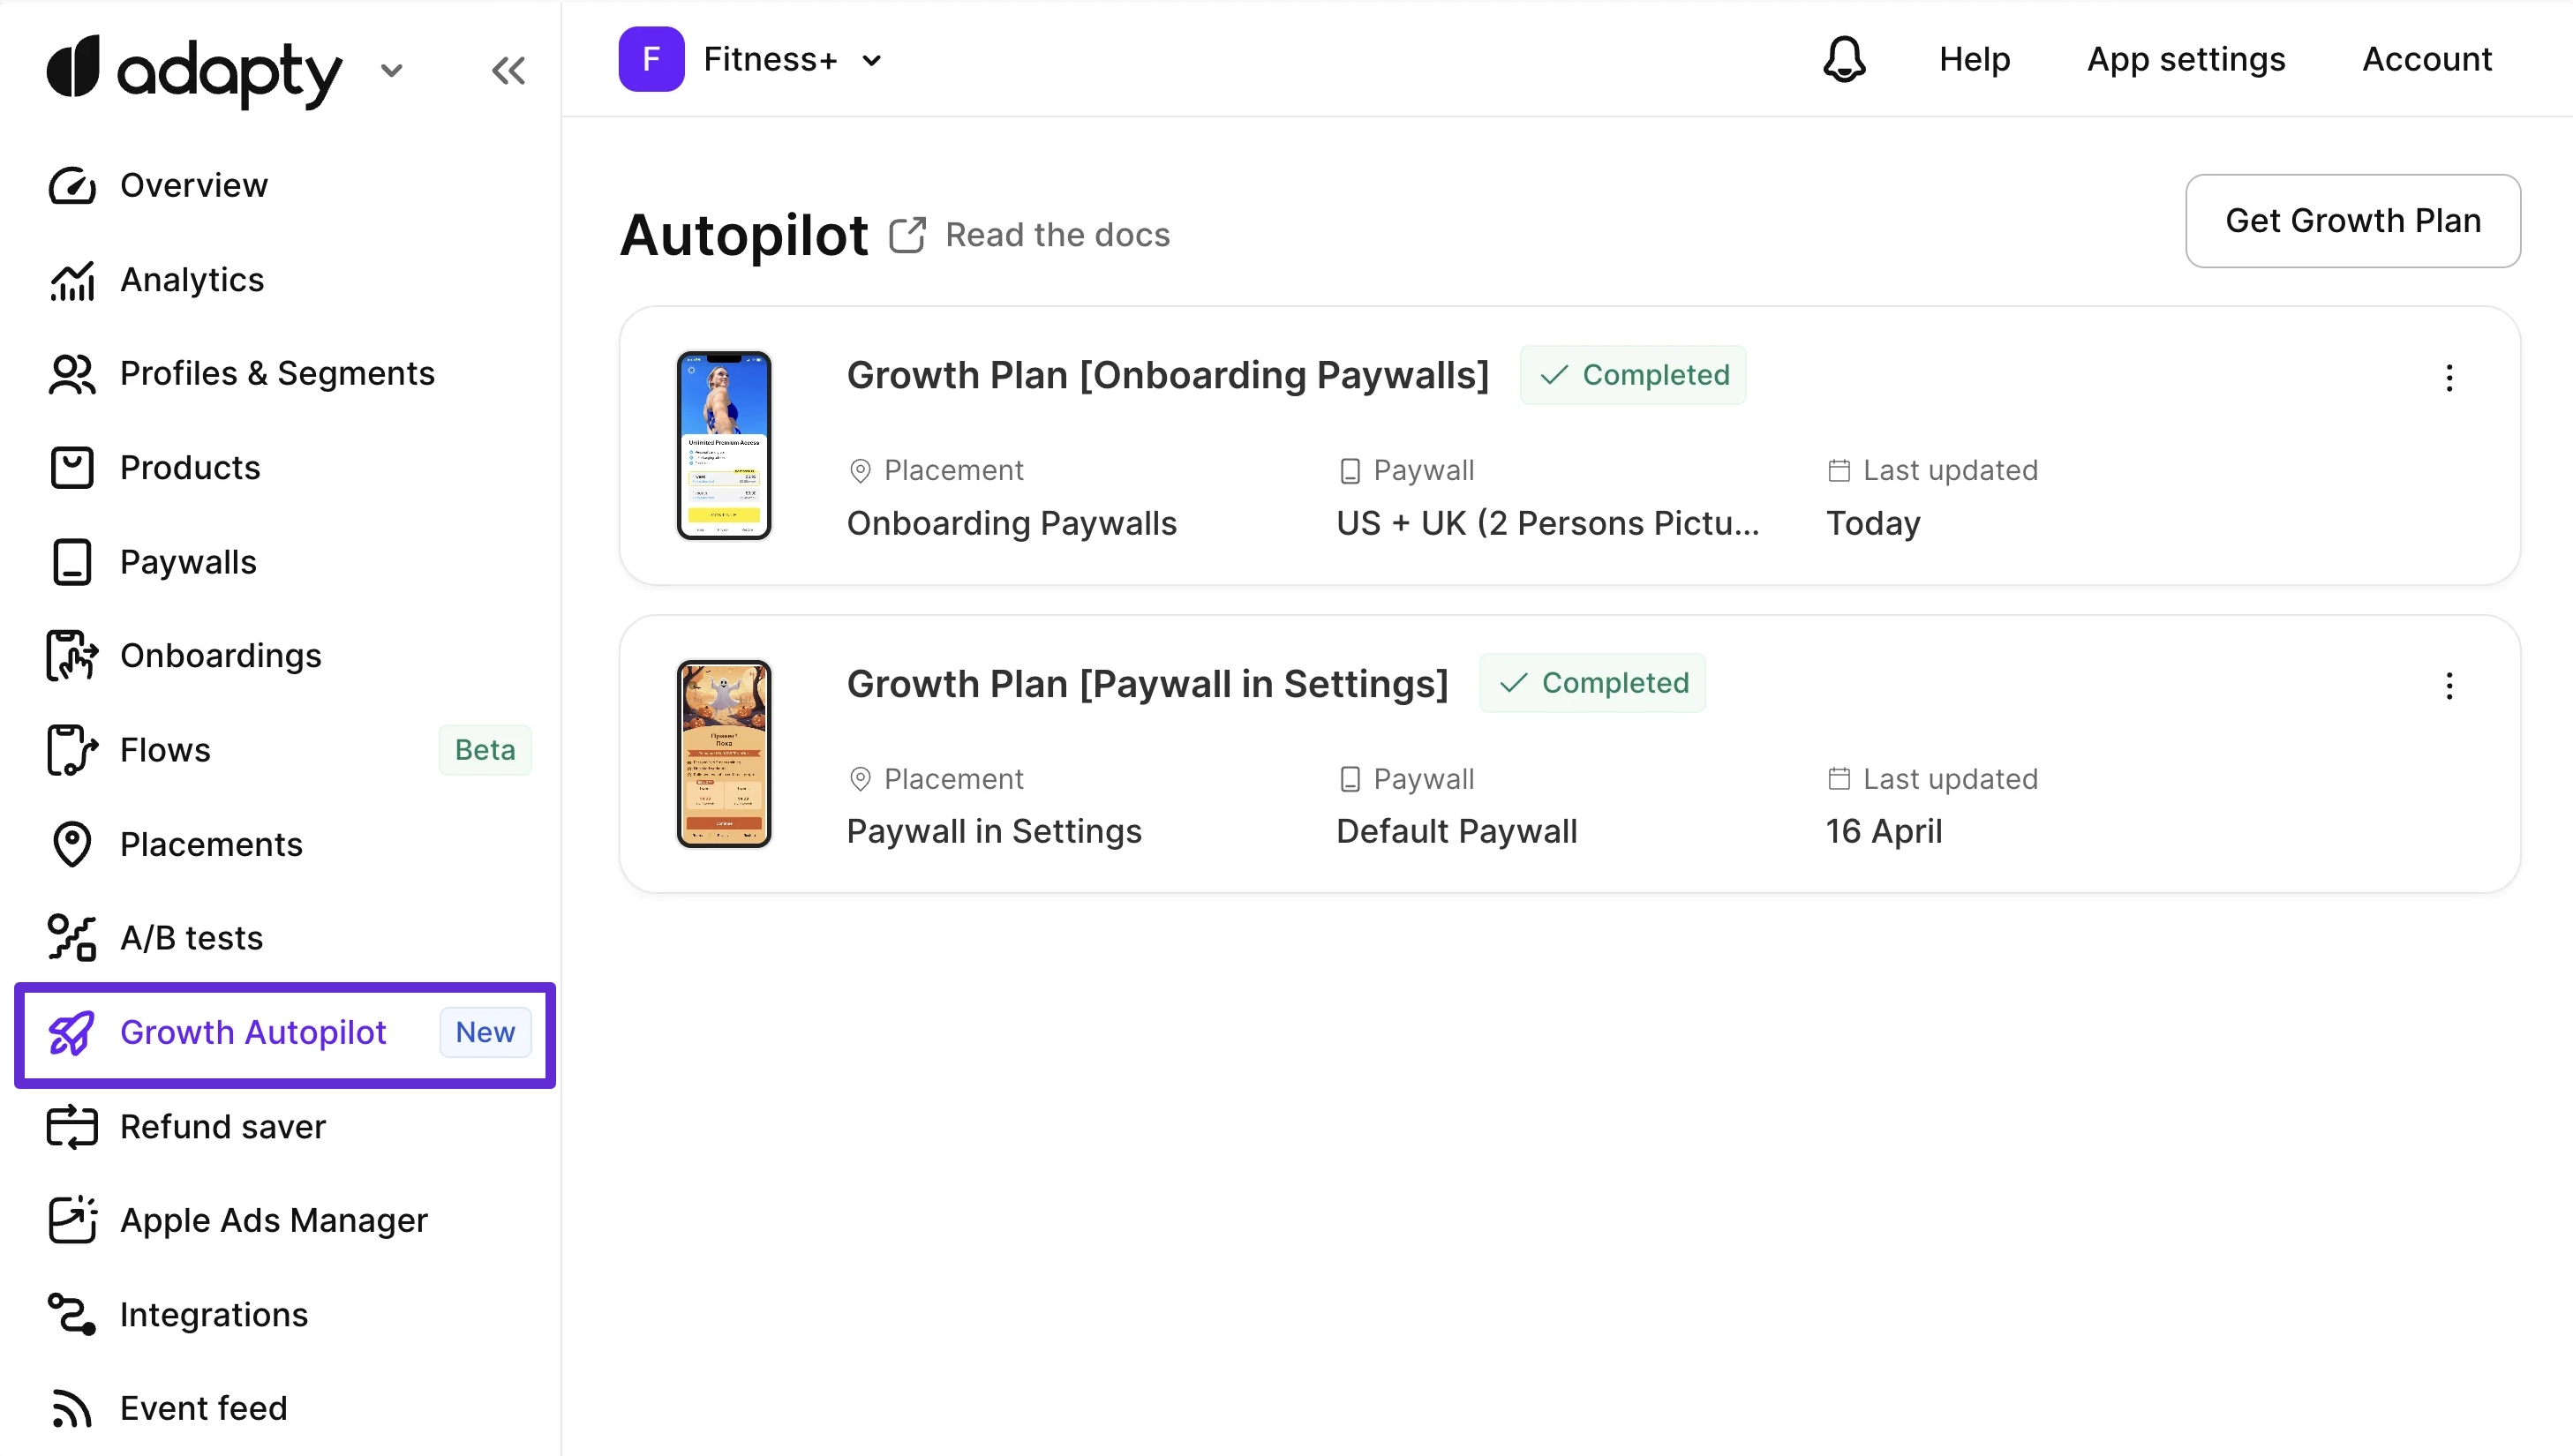
Open the AI Growth Advisor page and click the Get Growth plan button.
-
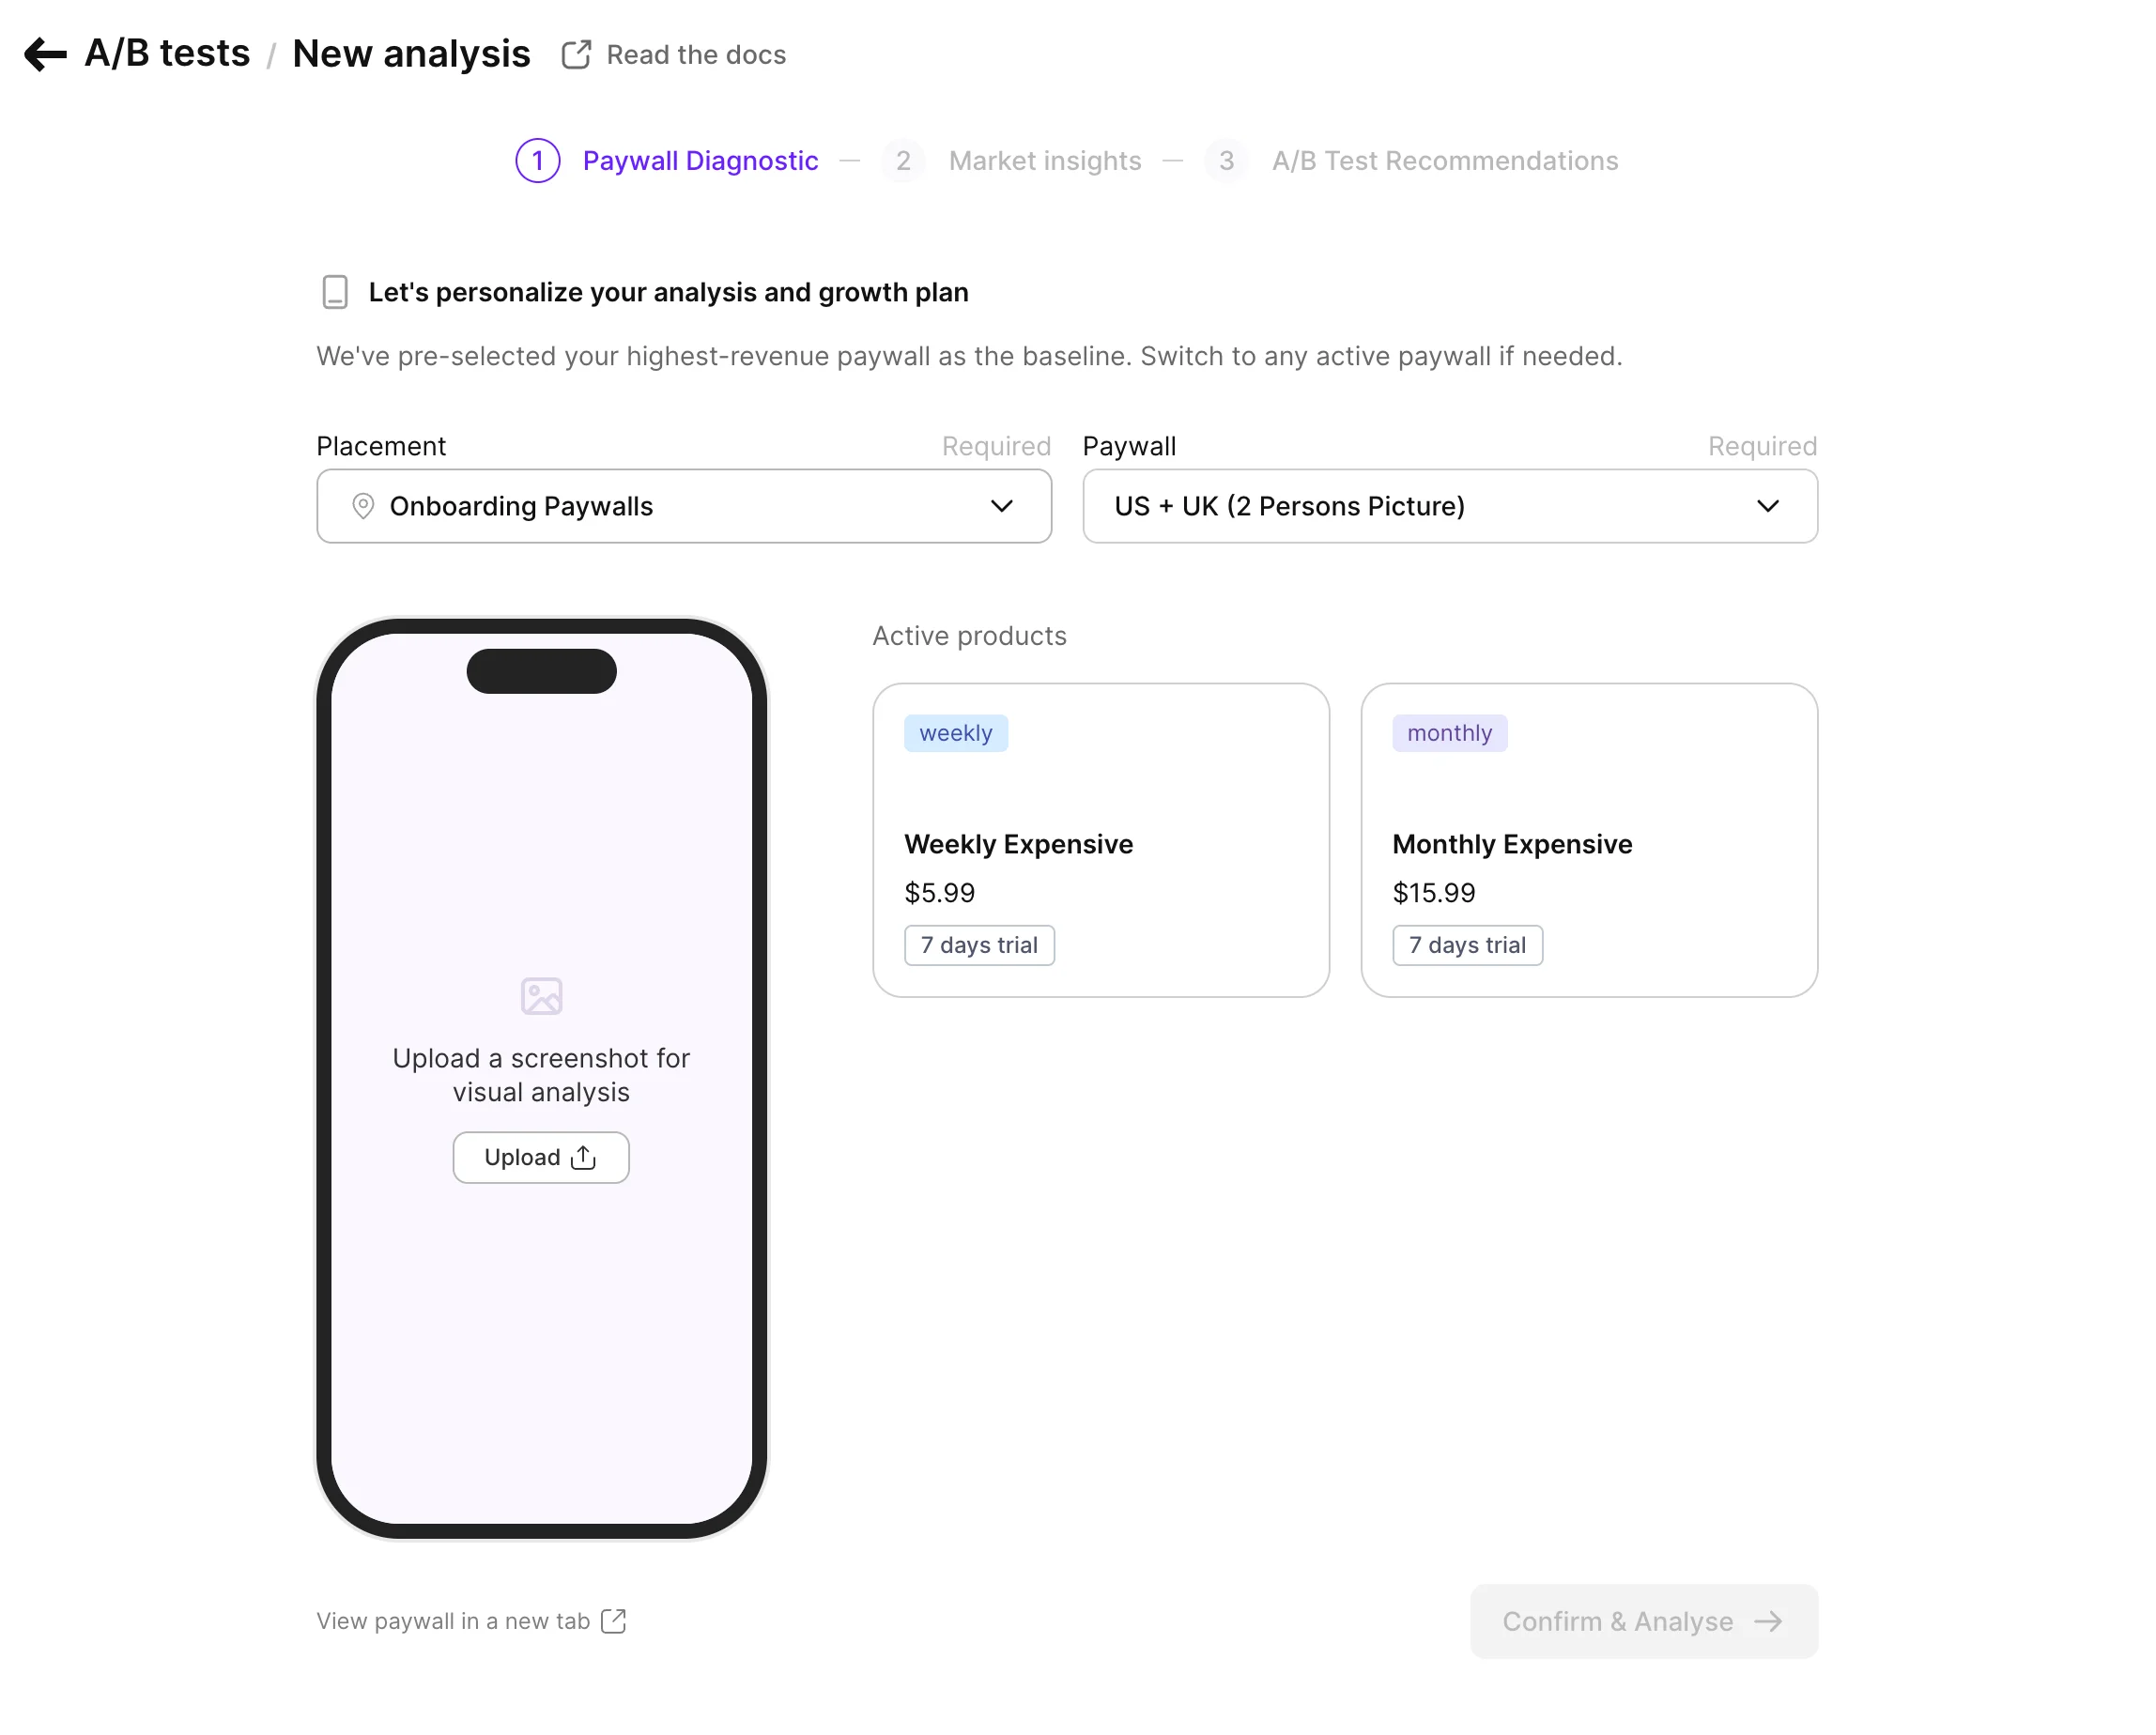
Select a Placement and Paywall. Confirm that the products displayed are correct. Upload a screenshot and click Confirm & Analyze.
-
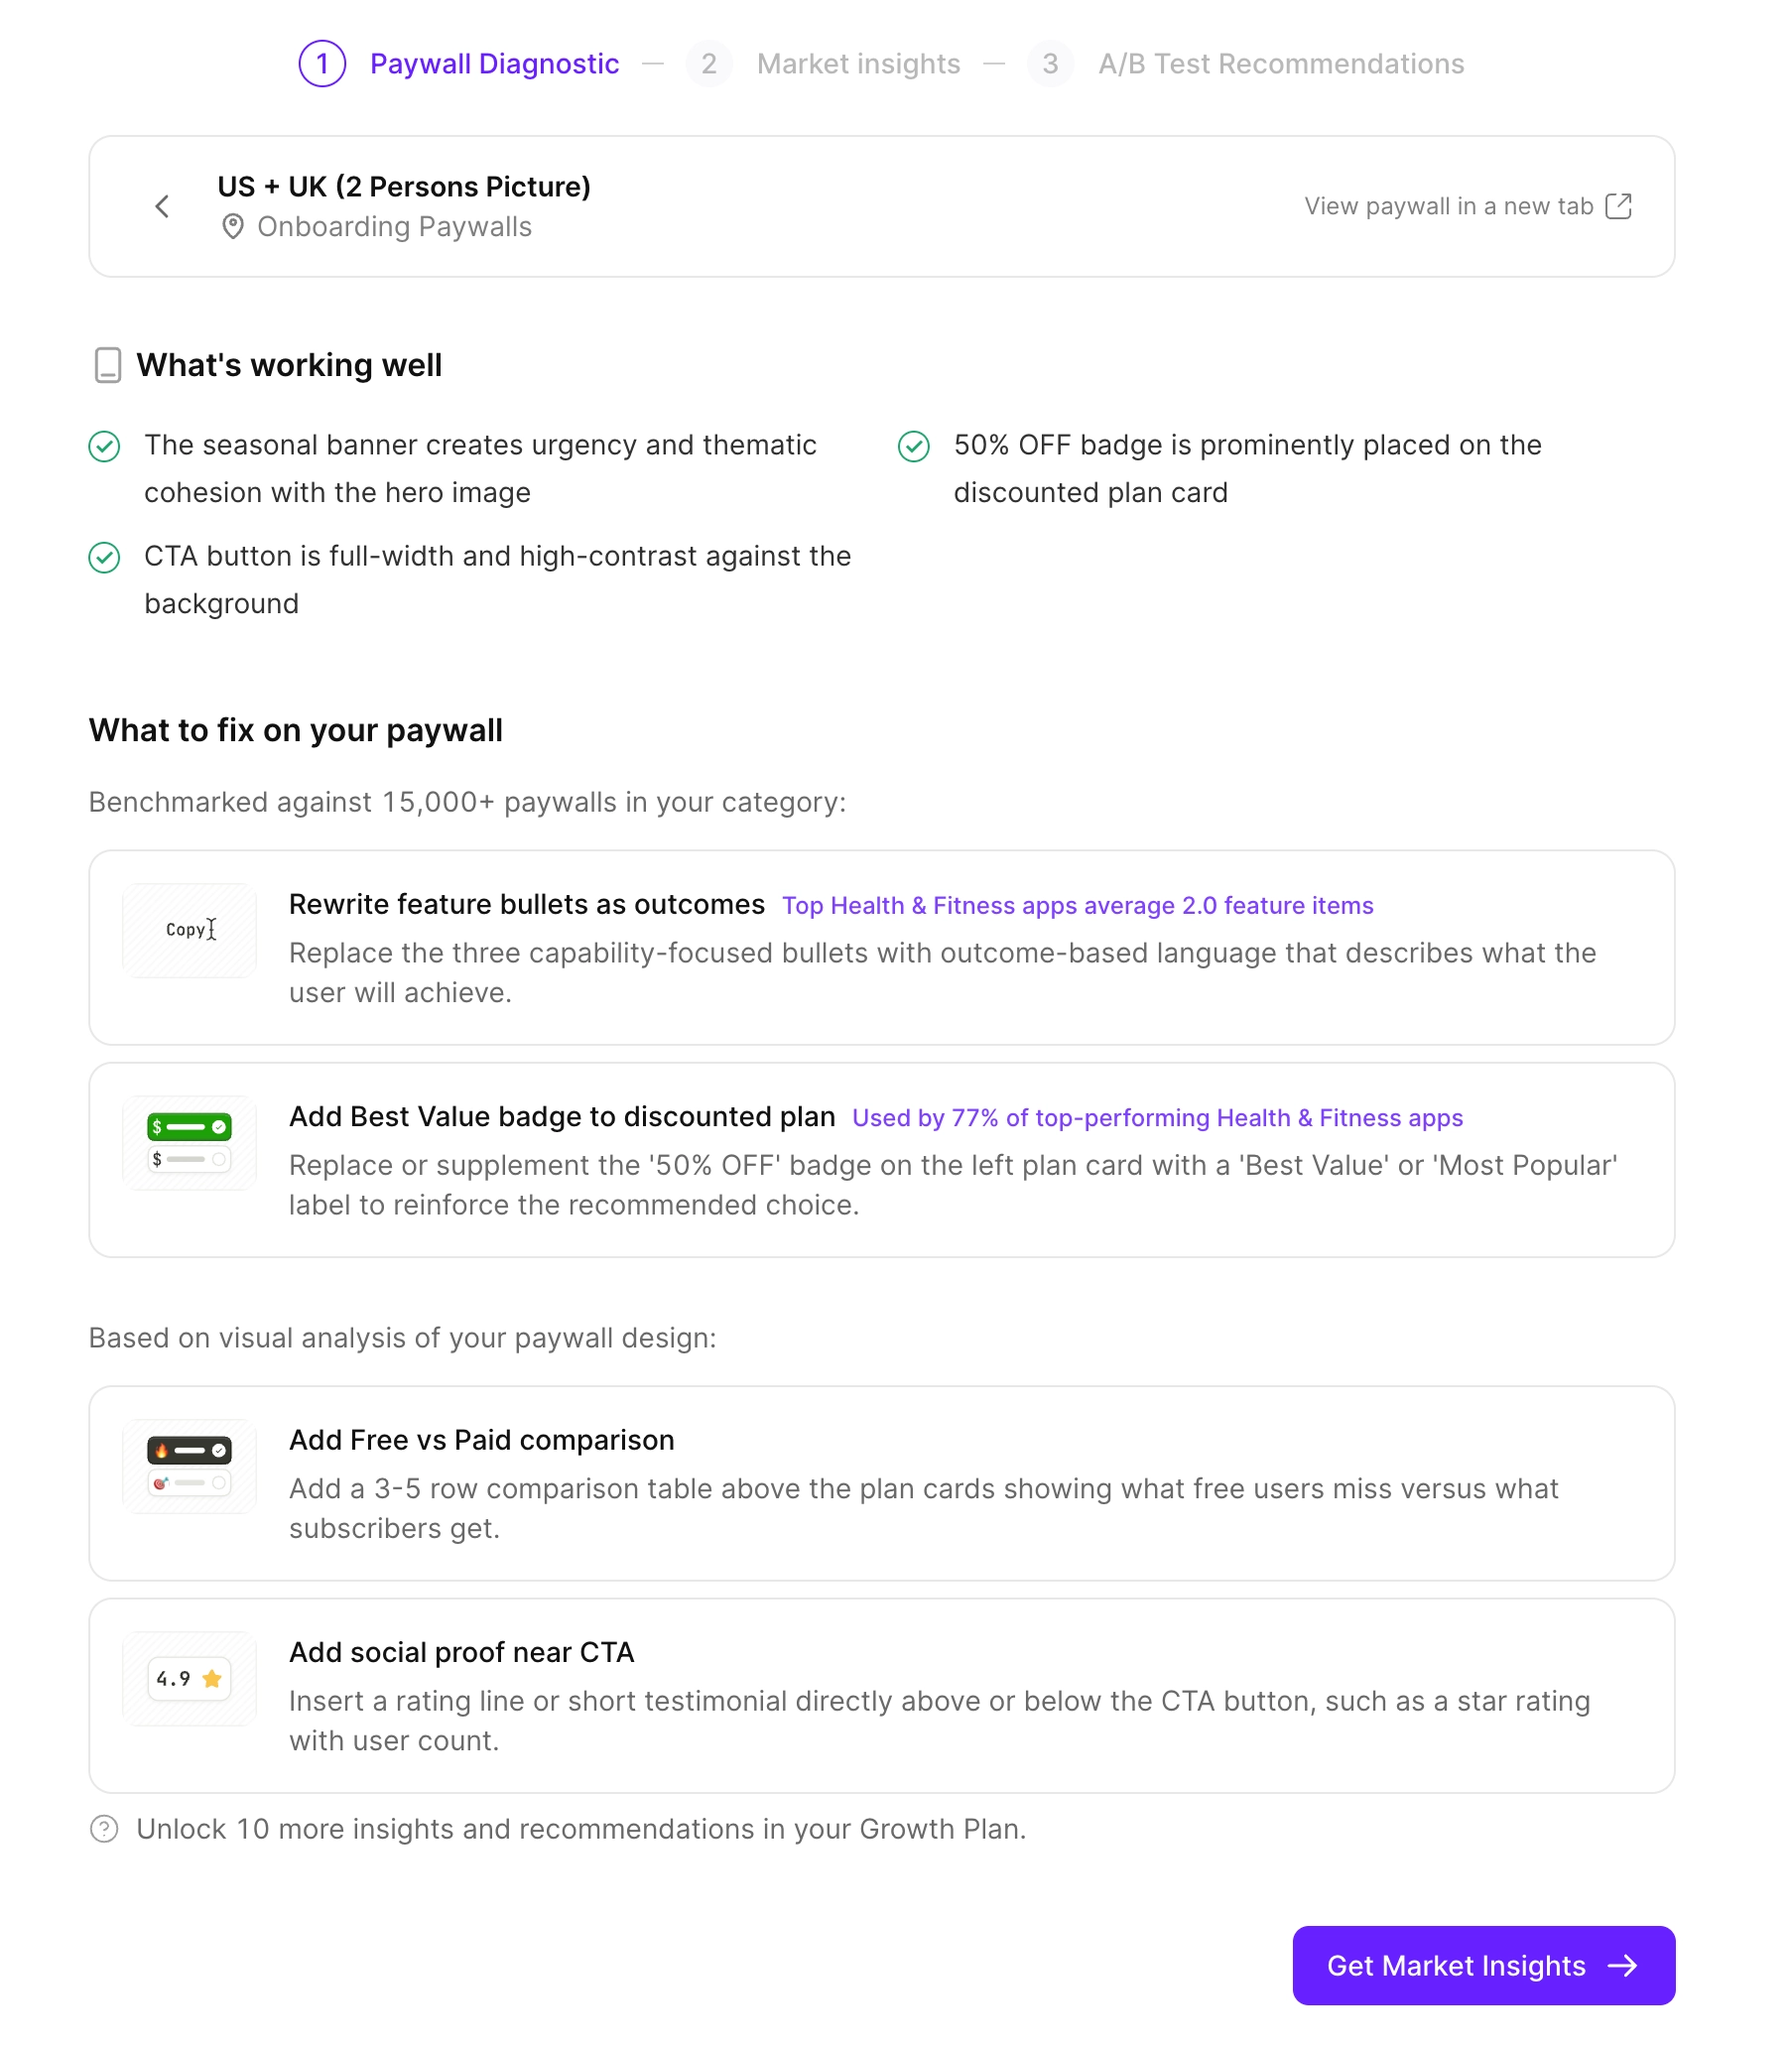
Adapty analyzes your paywall’s design, content, and revenue metrics. Review the report to find out what’s working and what needs improvement.
-
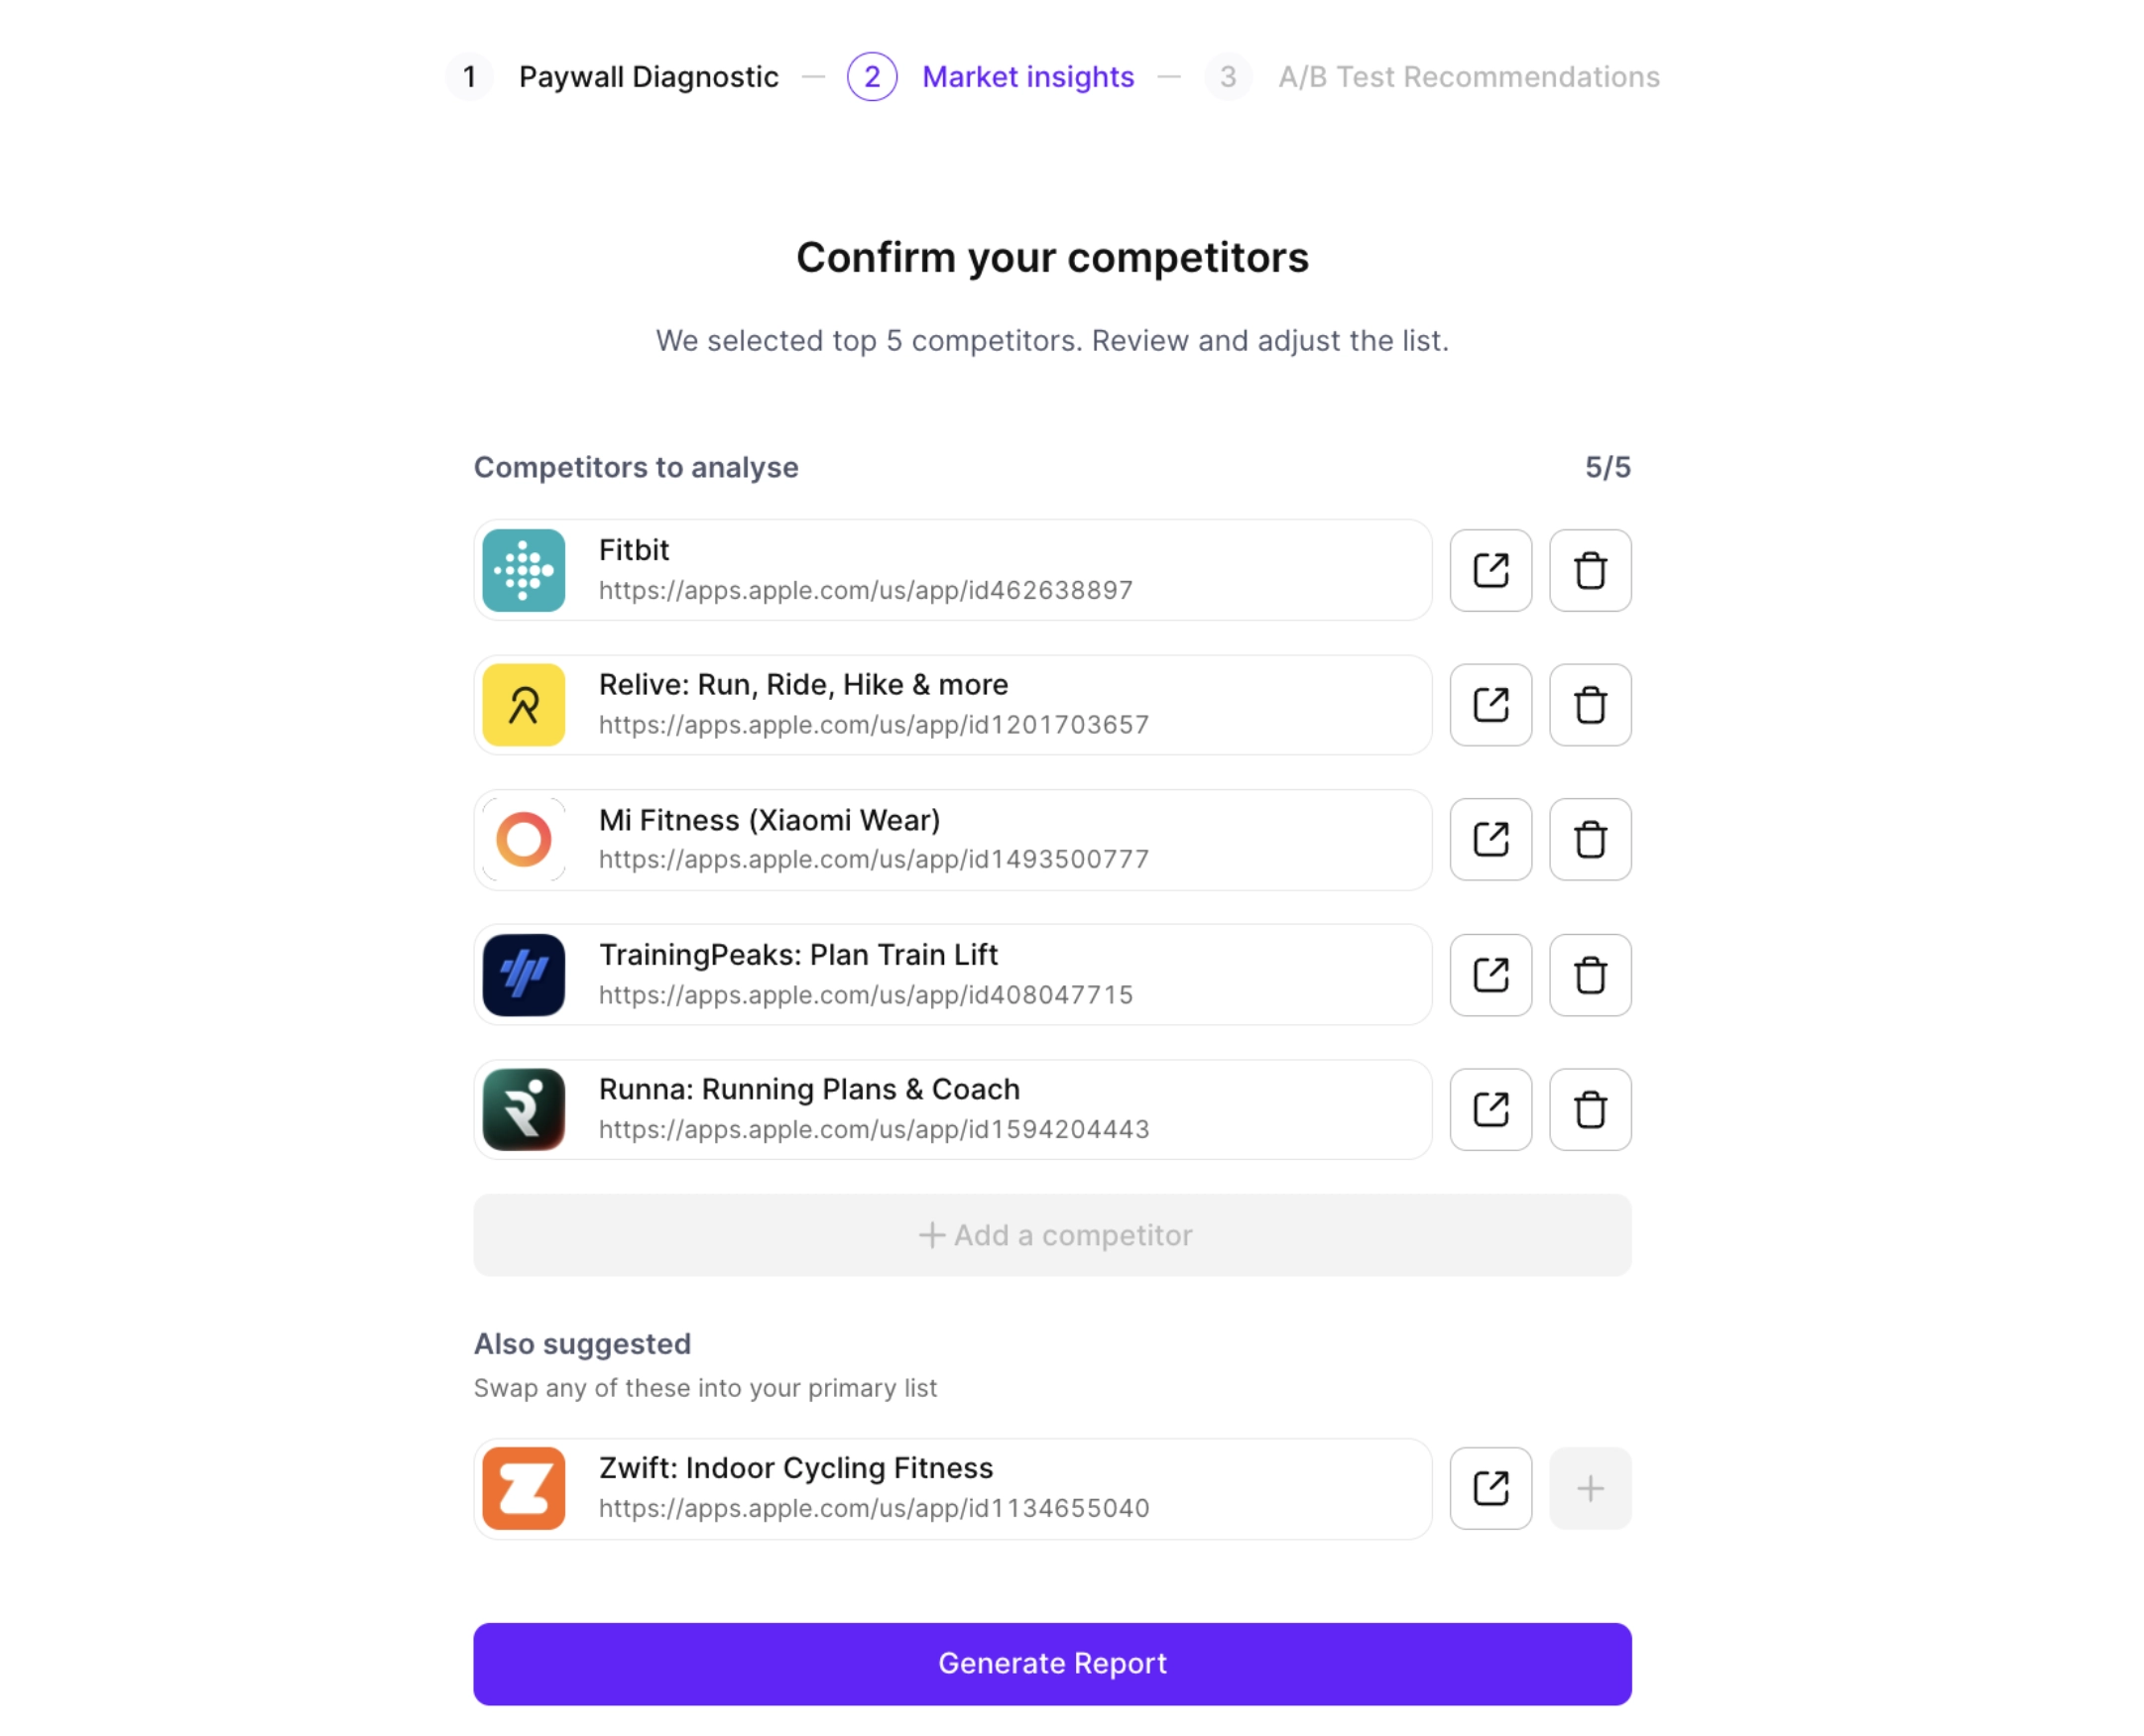
Select up to 5 competitors for an in-depth comparison. Click Generate report.
-
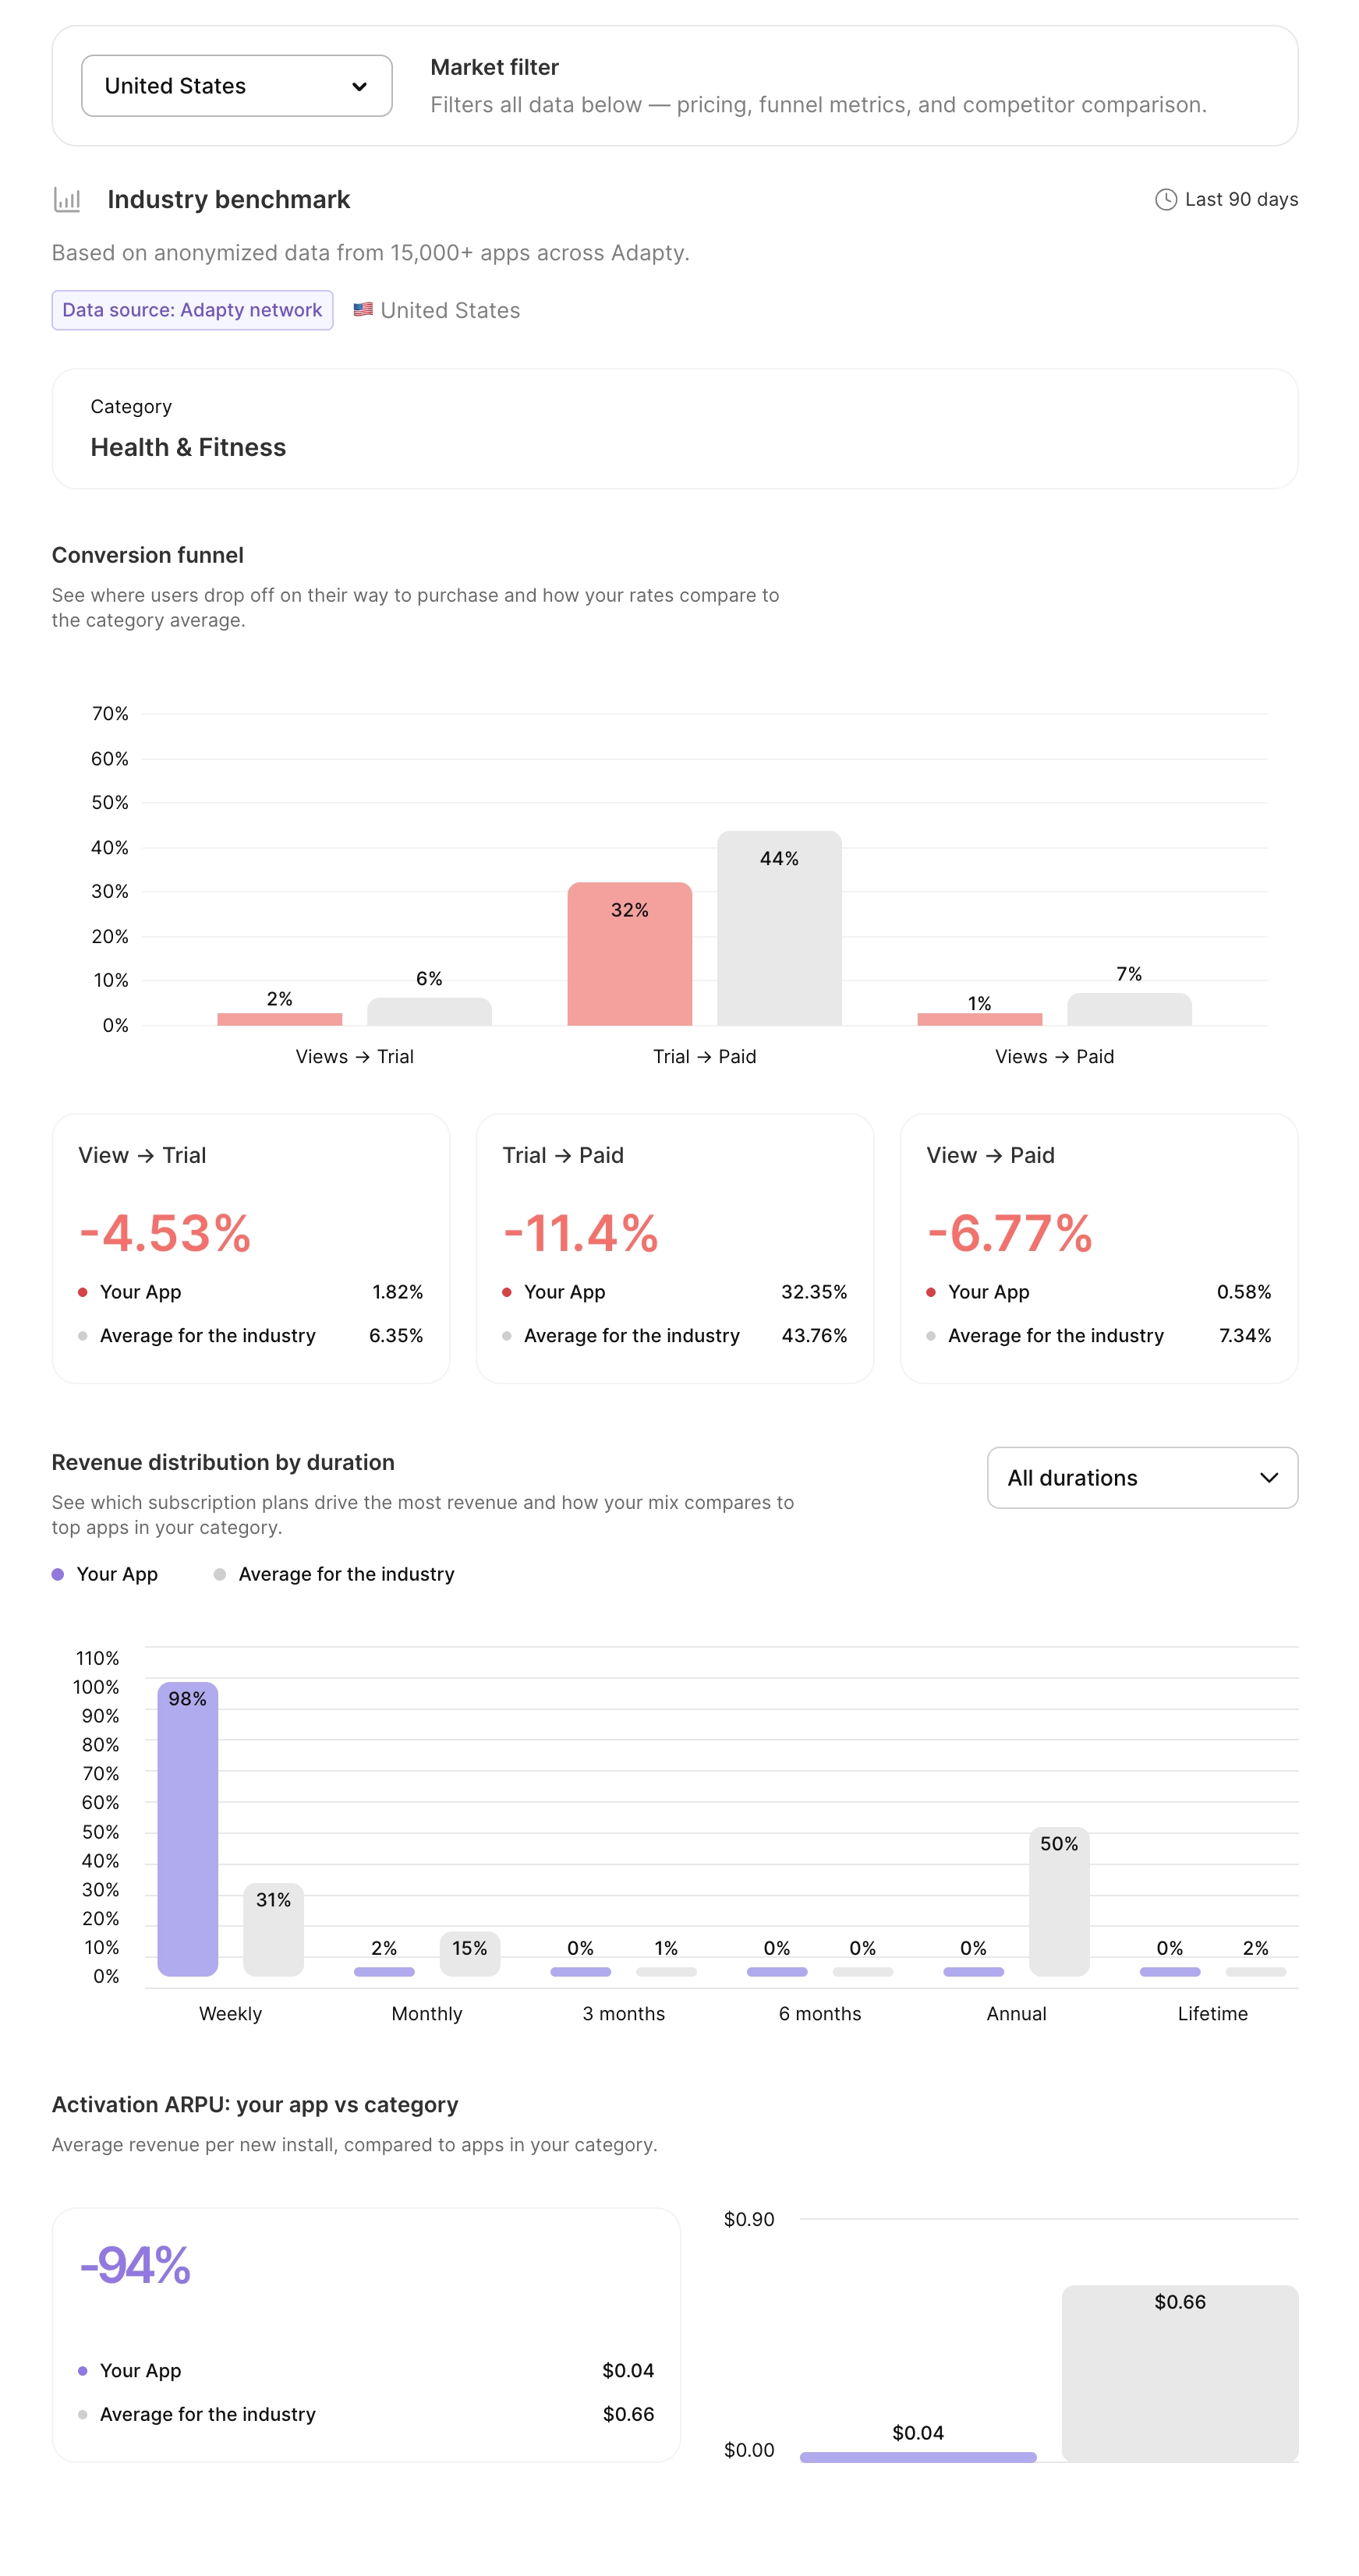
Read the market insights report. It compares your paywall’s performance against competitors and country-specific market benchmarks. You can switch between different countries to change the context of the analysis.
-
Geographic revenue distribution
-
Competitor pricing (country-specific)
-
Conversion funnel benchmarks (country-specific, market average)
-
Revenue distribution by subscription duration (country-specific, market average)
-
Activation ARPU (country-specific, market average)
-
Manage your growth plan
Main article: Manage your growth plan
-
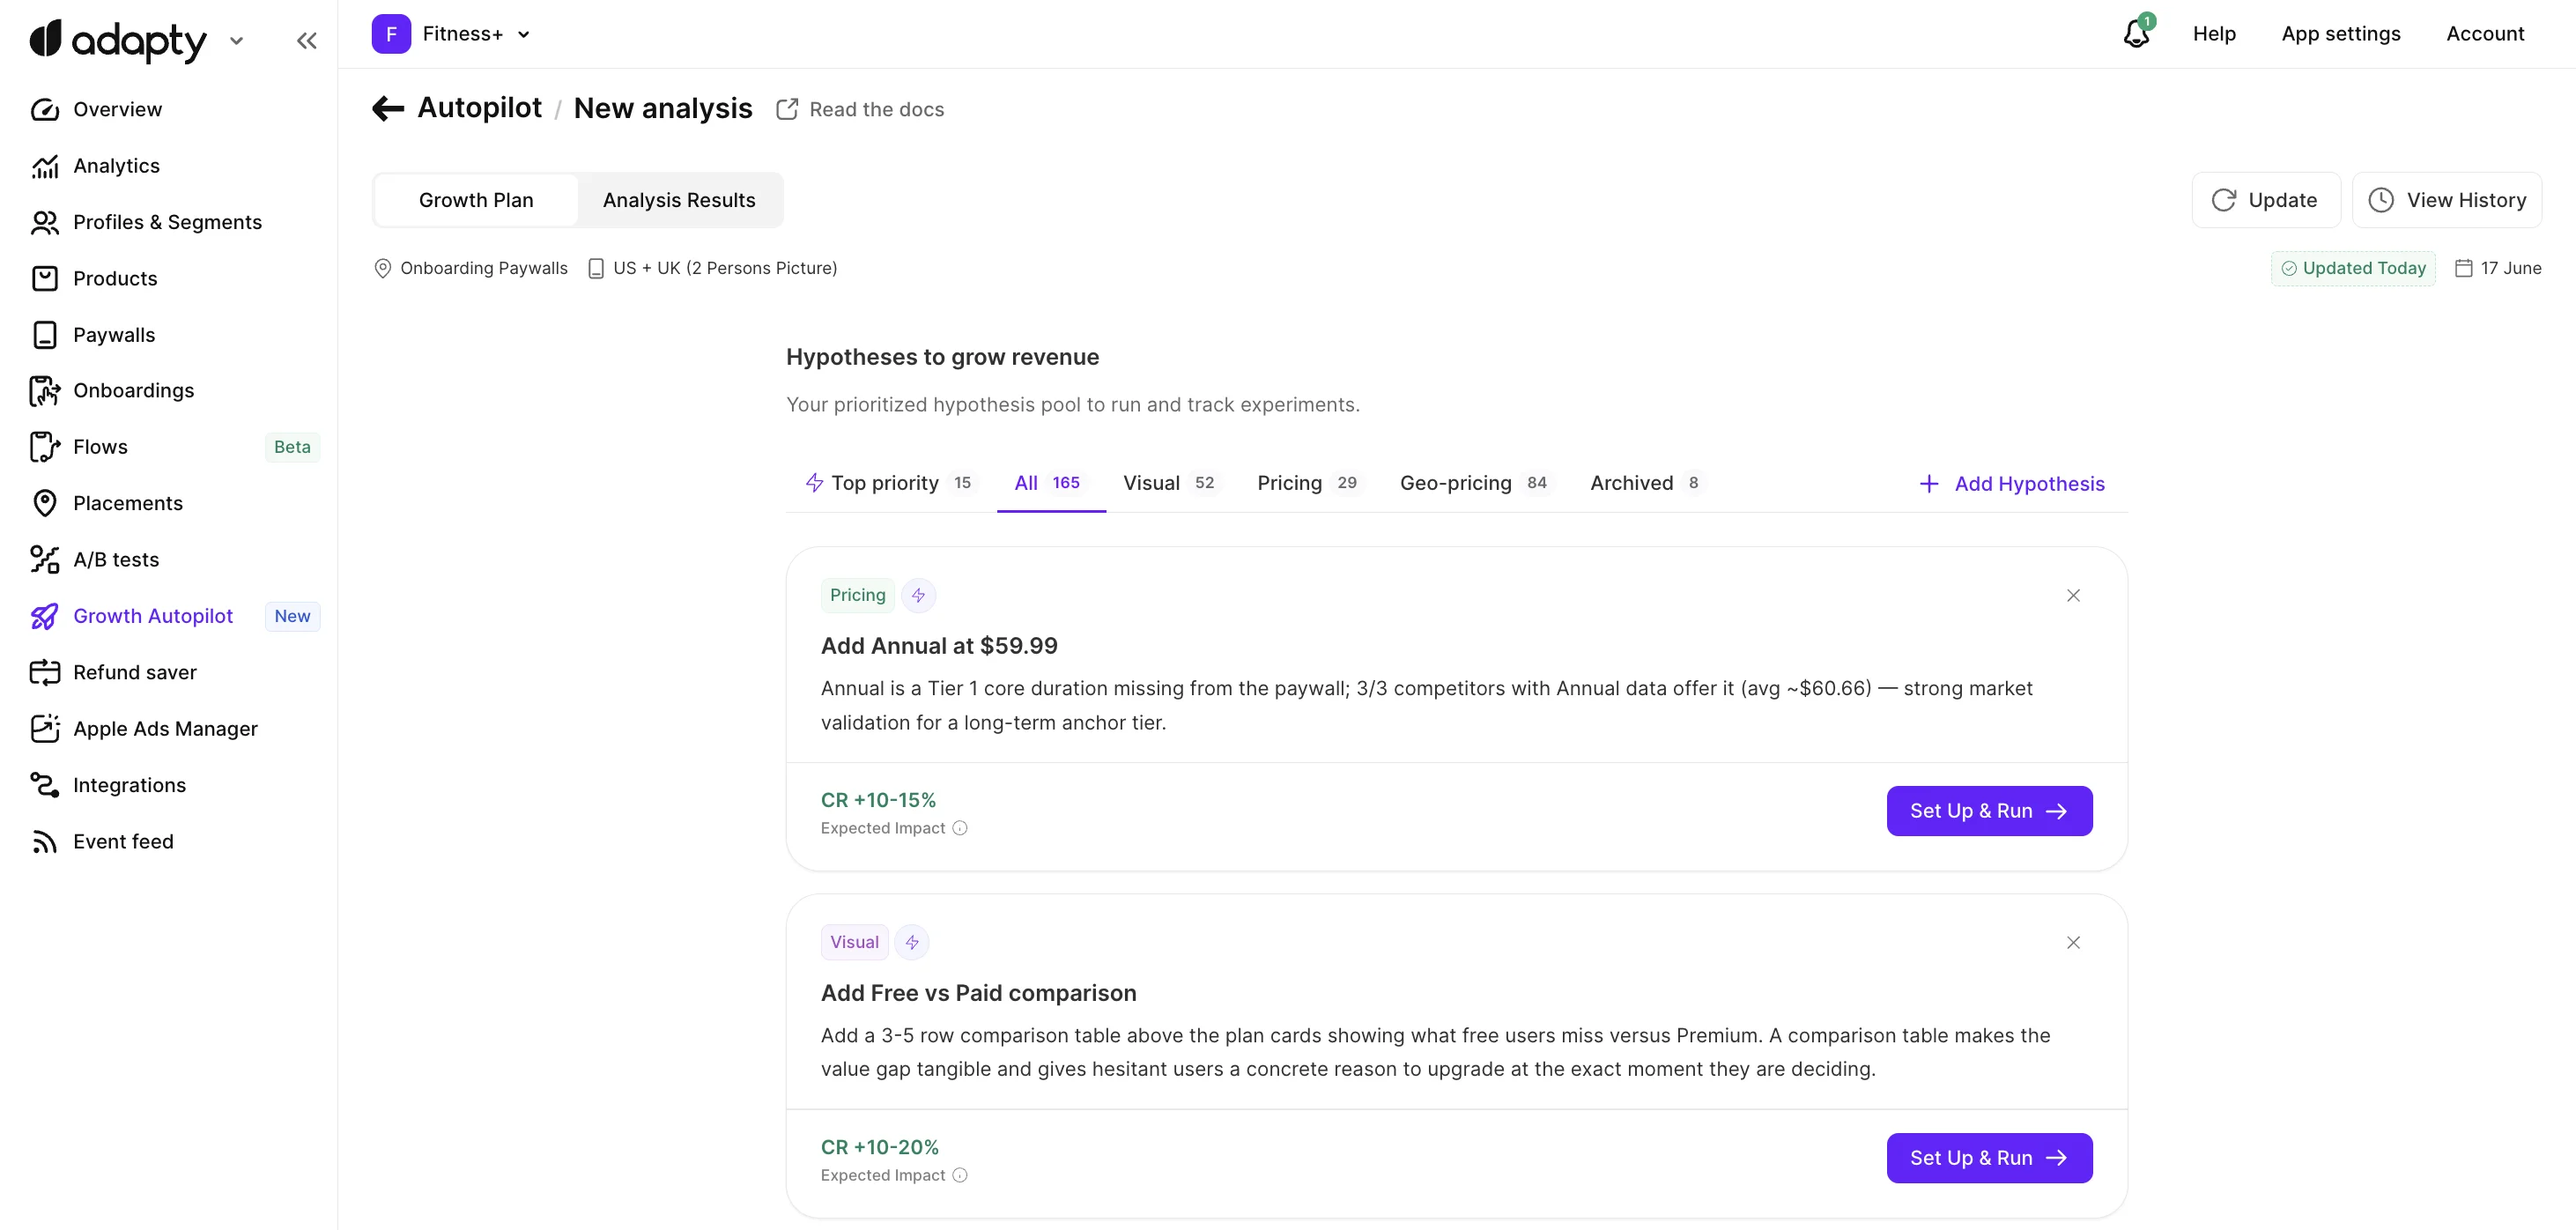
Open the growth plan and review Adapty’s data-driven hypotheses. Each is an A/B test that targets a single pricing or design change. Add your own hypotheses to expand the plan.
-
To keep your growth plan relevant, regularly re-run the analysis. Each re-run pulls in fresh market data and adds new hypotheses on top of your existing plan.
Execute your growth plan
Main article: Execute your growth plan
-
Run the tests one by one. Create new products, duplicate your paywall with the suggested changes, and launch the A/B test. The winner setup will participate in the next test.