Predictions in cohorts
Adapty Predictions are designed to help you answer the following questions:
- What is the predicted lifetime value (LTV) of your user cohorts?
- Which cohorts are likely to generate the highest revenue in the future?
- How much you can invest being aware of the predicted payoff?
With Adapty prediction, you can gain valuable insights and make data-driven decisions to optimize your revenue and growth strategy.
Adapty’s prediction model is a powerful new feature that uses machine learning to help you to get a better understanding of the long-term revenue potential and behavior of your app’s users. Using advanced gradient boosting techniques, the LTV prediction model can estimate the total revenue a user is expected to generate during the lifetime as a subscriber. This will help you to make informed decisions about user acquisition, marketing strategies, and product development.
Currently, the LTV prediction model provides two types of predictions: predicted LTV and predicted revenue.
Predictions in cohorts
Adapty now offers the ability to predict the lifetime value (LTV) of users and their predicted revenue for subscription-based apps. These predictions can be displayed on the cohort analysis page for 3, 6, and 12 months.
However, it is important to note that the model does not currently work for lifetimes and for one-time purchases. Additionally, the accuracy of the LTV model may be lower for very new apps with limited data and for apps that have experienced significant changes in their user traffic.
Prediction model
The prediction model is built using gradient boosting, a highly accurate and efficient machine-learning algorithm that can handle large datasets. By leveraging transaction data from your subscription-based apps, our model can predict the LTV for users a year after their profile was created. The data used for the model is completely anonymized.
The model is trained on data from all of your apps within Adapty. However, the predicted values are further refined and tailored based on the specific behavior patterns observed in cohorts associated with each individual app. This post-correction algorithm ensures more accurate predictions, taking into account the unique characteristics of each app.
The model achieves a high level of accuracy, with a Mean Absolute Percentage Error (MAPE) of slightly below 10%. This level of precision allows businesses to confidently rely on the model’s predictions when making data-driven decisions.
Adapty utilizes two distinct gradient-boosting models to forecast LTV:
- Revenue prediction model: Predicts the total revenue generated by a cohort of users.
- LTV prediction model: Predicts the average LTV of users in a cohort.
The trained models are then used to predict the total revenue and average LTV of each cohort within the selected period (3, 6, 9, or 12 months) after cohort creation. These predictions are verified and constrained to ensure they are consistent with typical user behavior patterns.
The predictions are initially generated after 1-3 weeks following the creation of the cohort. This timeframe allows for sufficient data gathering and analysis. Suppose a cohort is created on January 1st. Predictions for that cohort would be available sometime between January 15th and January 29th.
After the initial prediction generation, the predictions are then updated daily using the latest transactional data available for the cohort. This frequent updating ensures that the predictions remain current and reflect the most recent behavior of the cohort.
The model takes into account a variety of significant statistics pertaining to the cohorts, including revenue generated from past subscription periods, user retention rates, present LTV, subscription type, the proportion of users from Google Play and App Store, and geographic distribution of users by country, among others. These features are meticulously chosen to guarantee that the model captures the most pertinent information required to generate precise forecasts about the future LTV of users.
The model typically reflects changes in product performance, such as increased retention for monthly subscriptions, with a delay of approximately one week.
The ML model used to predict revenue and LTV has certain limitations that should be taken into account when interpreting its results. These limitations include:
- Data quality: The model’s performance depends on the quality and representativeness of the data available. Data quality is a crucial aspect of data analysis, and one of the main reasons for insufficient results is when a cohort behaves unusually and deviates from normal cohort metrics for a particular app or all other apps. This type of data is considered uncommon for the model, which can lead to unexpected results. This situation is more common for new, unusual products or new apps that haven’t been included in the training set.
- Time frame: The model can predict values up to 12 months from the creation of a user cohort. You will see growing actual revenue but the prediction will remain at the point of 12 months.
- Subscription durations: The model shows the best performance on monthly and weekly subscriptions
Prediction in Adapty cohorts
To access predicted revenue and predicted LTV values for your subscribers, you can navigate to the Cohort Analyses page in your Adapty dashboard. Also, if you want to learn more about the Adapty cohort, please reference our documentation about it.

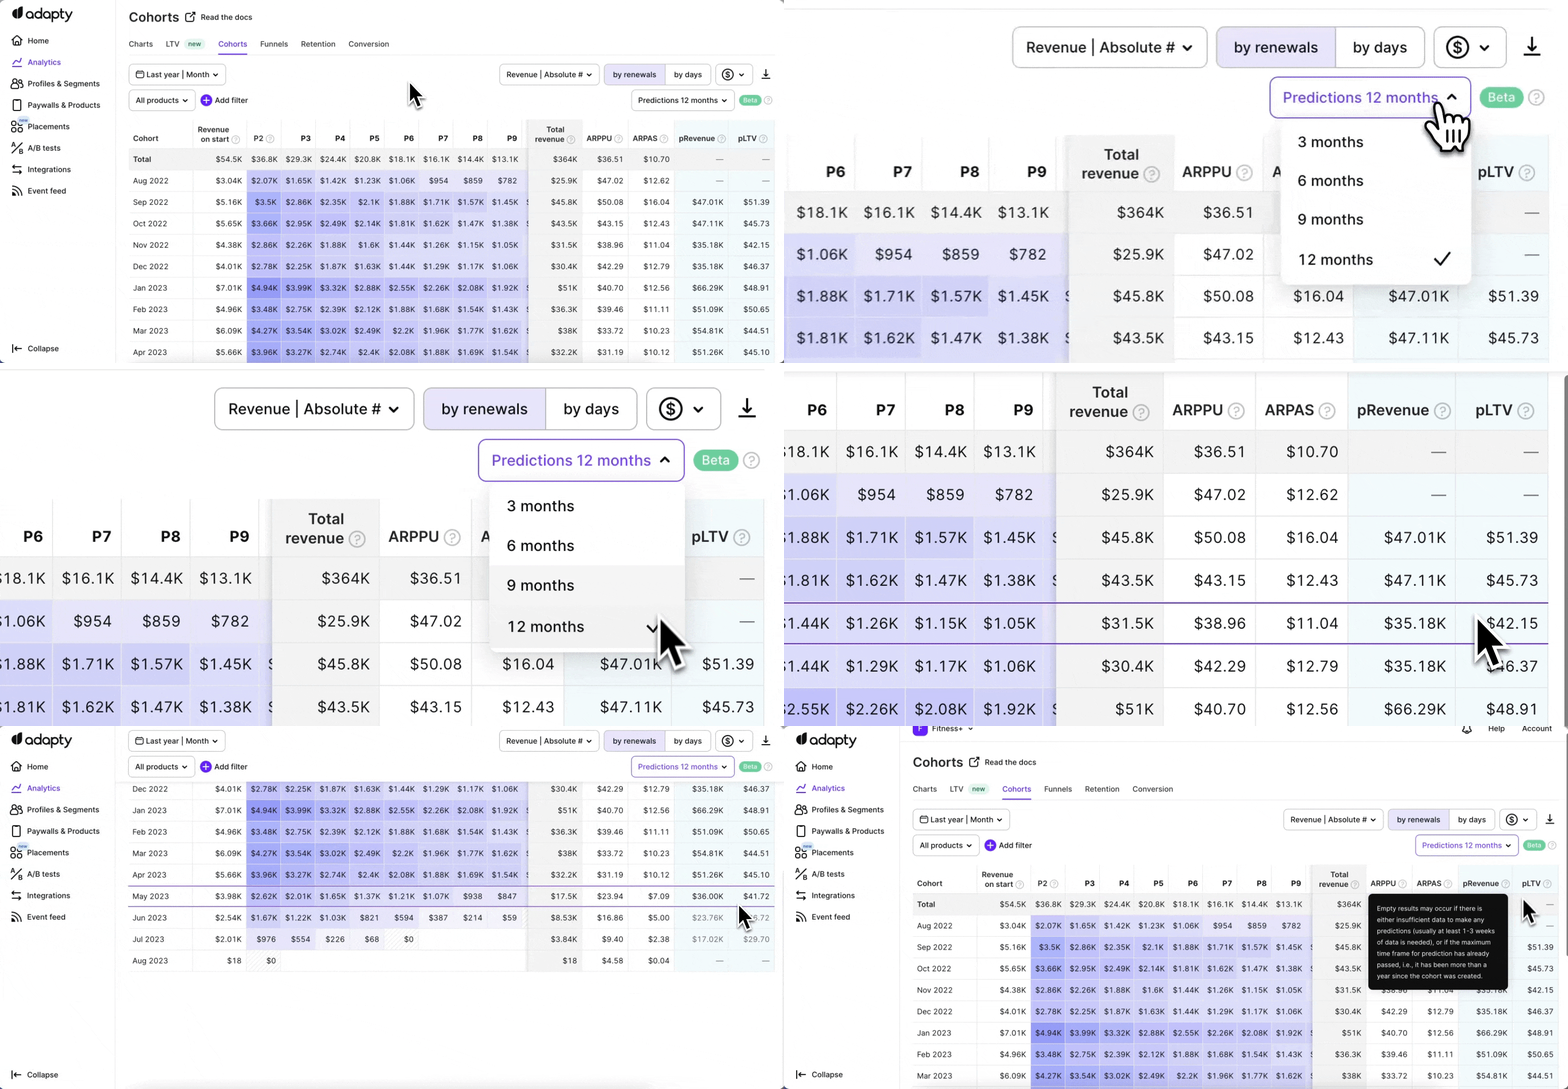
The predicted revenue (pRevenue) column shows the estimated total revenue a cohort of subscribers is expected to generate during the selected time frame after cohort creation. This value is calculated using Adapty’s revenue prediction model, which utilizes advanced gradient boosting techniques to predict revenue for users.
The predicted LTV (pLTV) column shows the estimated lifetime value of each user in the selected cohort. This value is calculated by dividing the predicted revenue by the predicted number of paying users in the cohort. The predicted number of paying users is calculated using Adapty’s base prediction model, which predicts the number of paying users in a cohort.
To define the time period for which the predicted revenue and predicted LTV values are displayed, you can select the desired value from the timeframe dropdown in the user interface. The available options are typically 3, 6, 9, or 12 months after cohort creation.
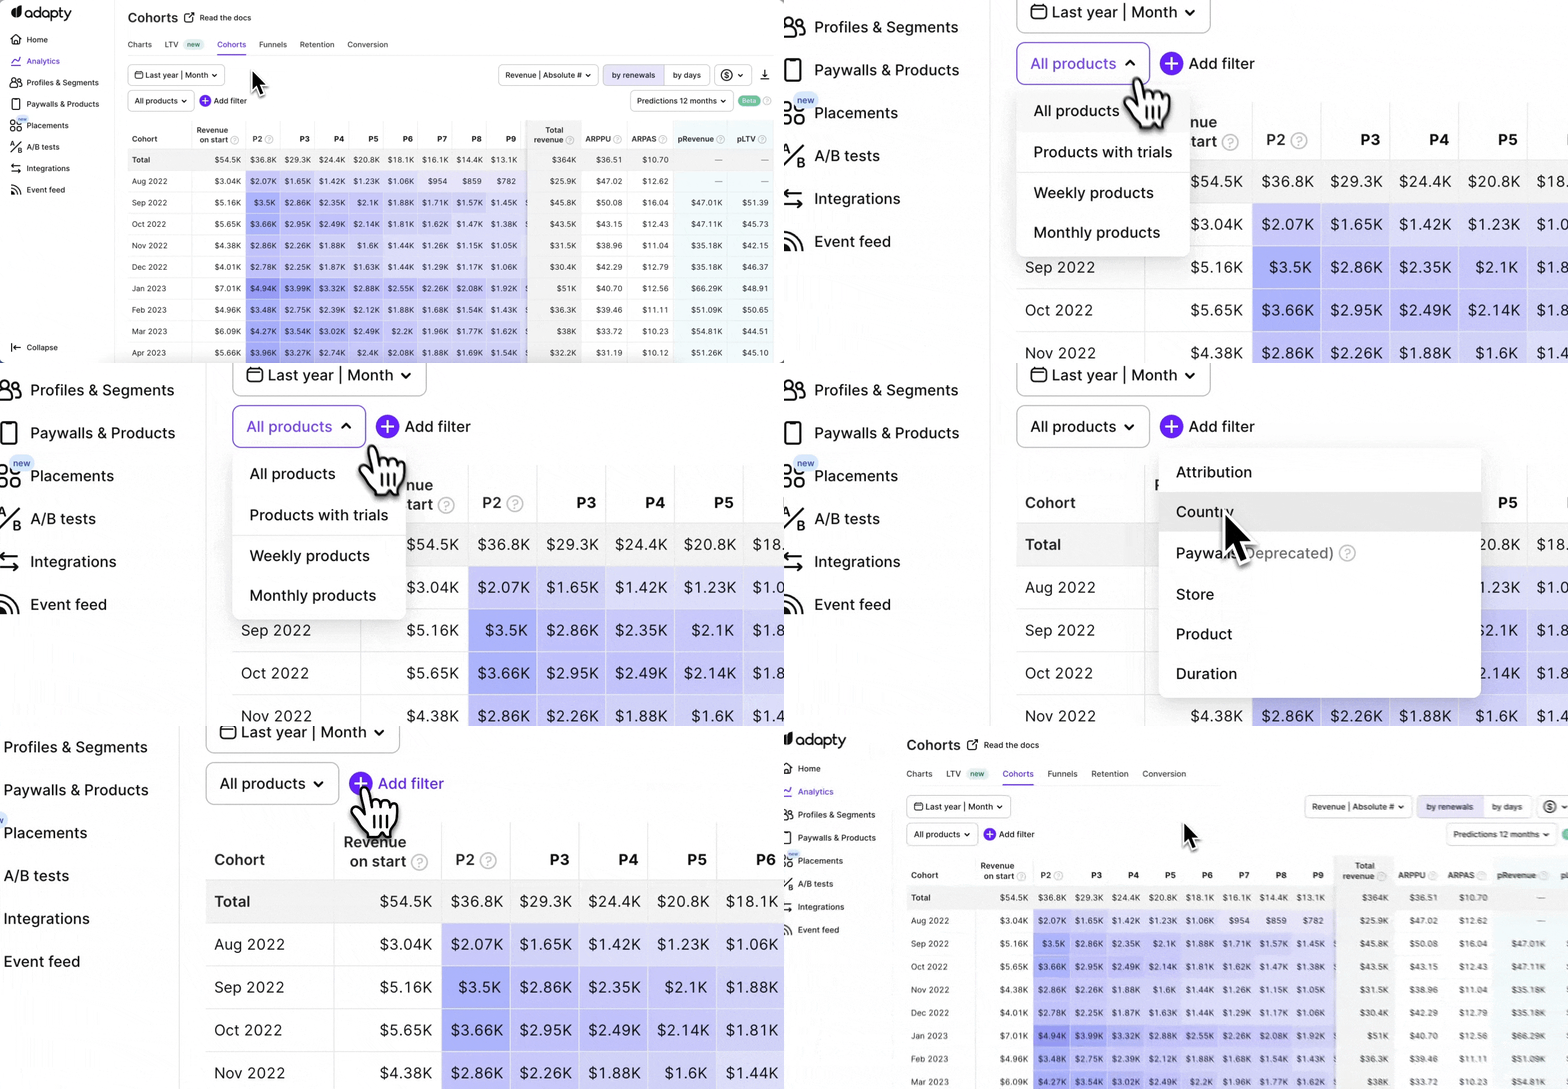
To provide even more valuable insights, Adapty allows you to filter predicted revenue and LTV by product. By default, Adapty builds predictions based on all purchase data, but filtering by product can help you better understand how each product is performing and how it contributes to your overall predicted revenue and LTV.

When there is insufficient data available to generate accurate predictions, the corresponding fields will be greyed out in the user interface. Hovering over the greyed-out fields will display a tooltip with the message “Insufficient data for accurate prediction”. This serves as a visual cue that the predicted values may not be reliable and further data collection and analysis may be necessary to generate accurate predictions. The lack of data may occur due to several reasons, such as insufficient time since cohort creation, a small cohort size, or an unpopular subscription type. In some cases, the cohort may behave unusually, deviating from the normal metrics used to train the model. Waiting a few weeks may help resolve this issue.
Also, another possible case is there are no values for the prediction. Empty results may occur if there is either insufficient data to make any predictions (usually at least 1-3 weeks of data is needed), or if the maximum time frame for prediction has already passed, i.e., it has been more than a year since the cohort was created.
When upgrading your pricing plan to the Pro+ or Enterprise, it’s important to note that there may be a maximum delay of 24 hours before the prediction data for Revenue and LTV becomes available on your Adapty dashboard.
Adapty cohorts provides valuable insights into your revenue and user LTV (lifetime value) by showing current revenue and current money per paying user. By tracking these metrics, you can monitor how your actual numbers are progressing toward the predicted values and track your progress over time. While the primary purpose of using prediction numbers in building plans, it’s important to exercise caution and not solely rely on these predictions for decision-making. Rather, they should be used as a guide to inform your strategy and help you make informed business decisions. By leveraging Adapty cohorts and predict, you can gain a better understanding of your revenue and user behavior, and use this information to optimize your business operations for greater success.