Analytics charts
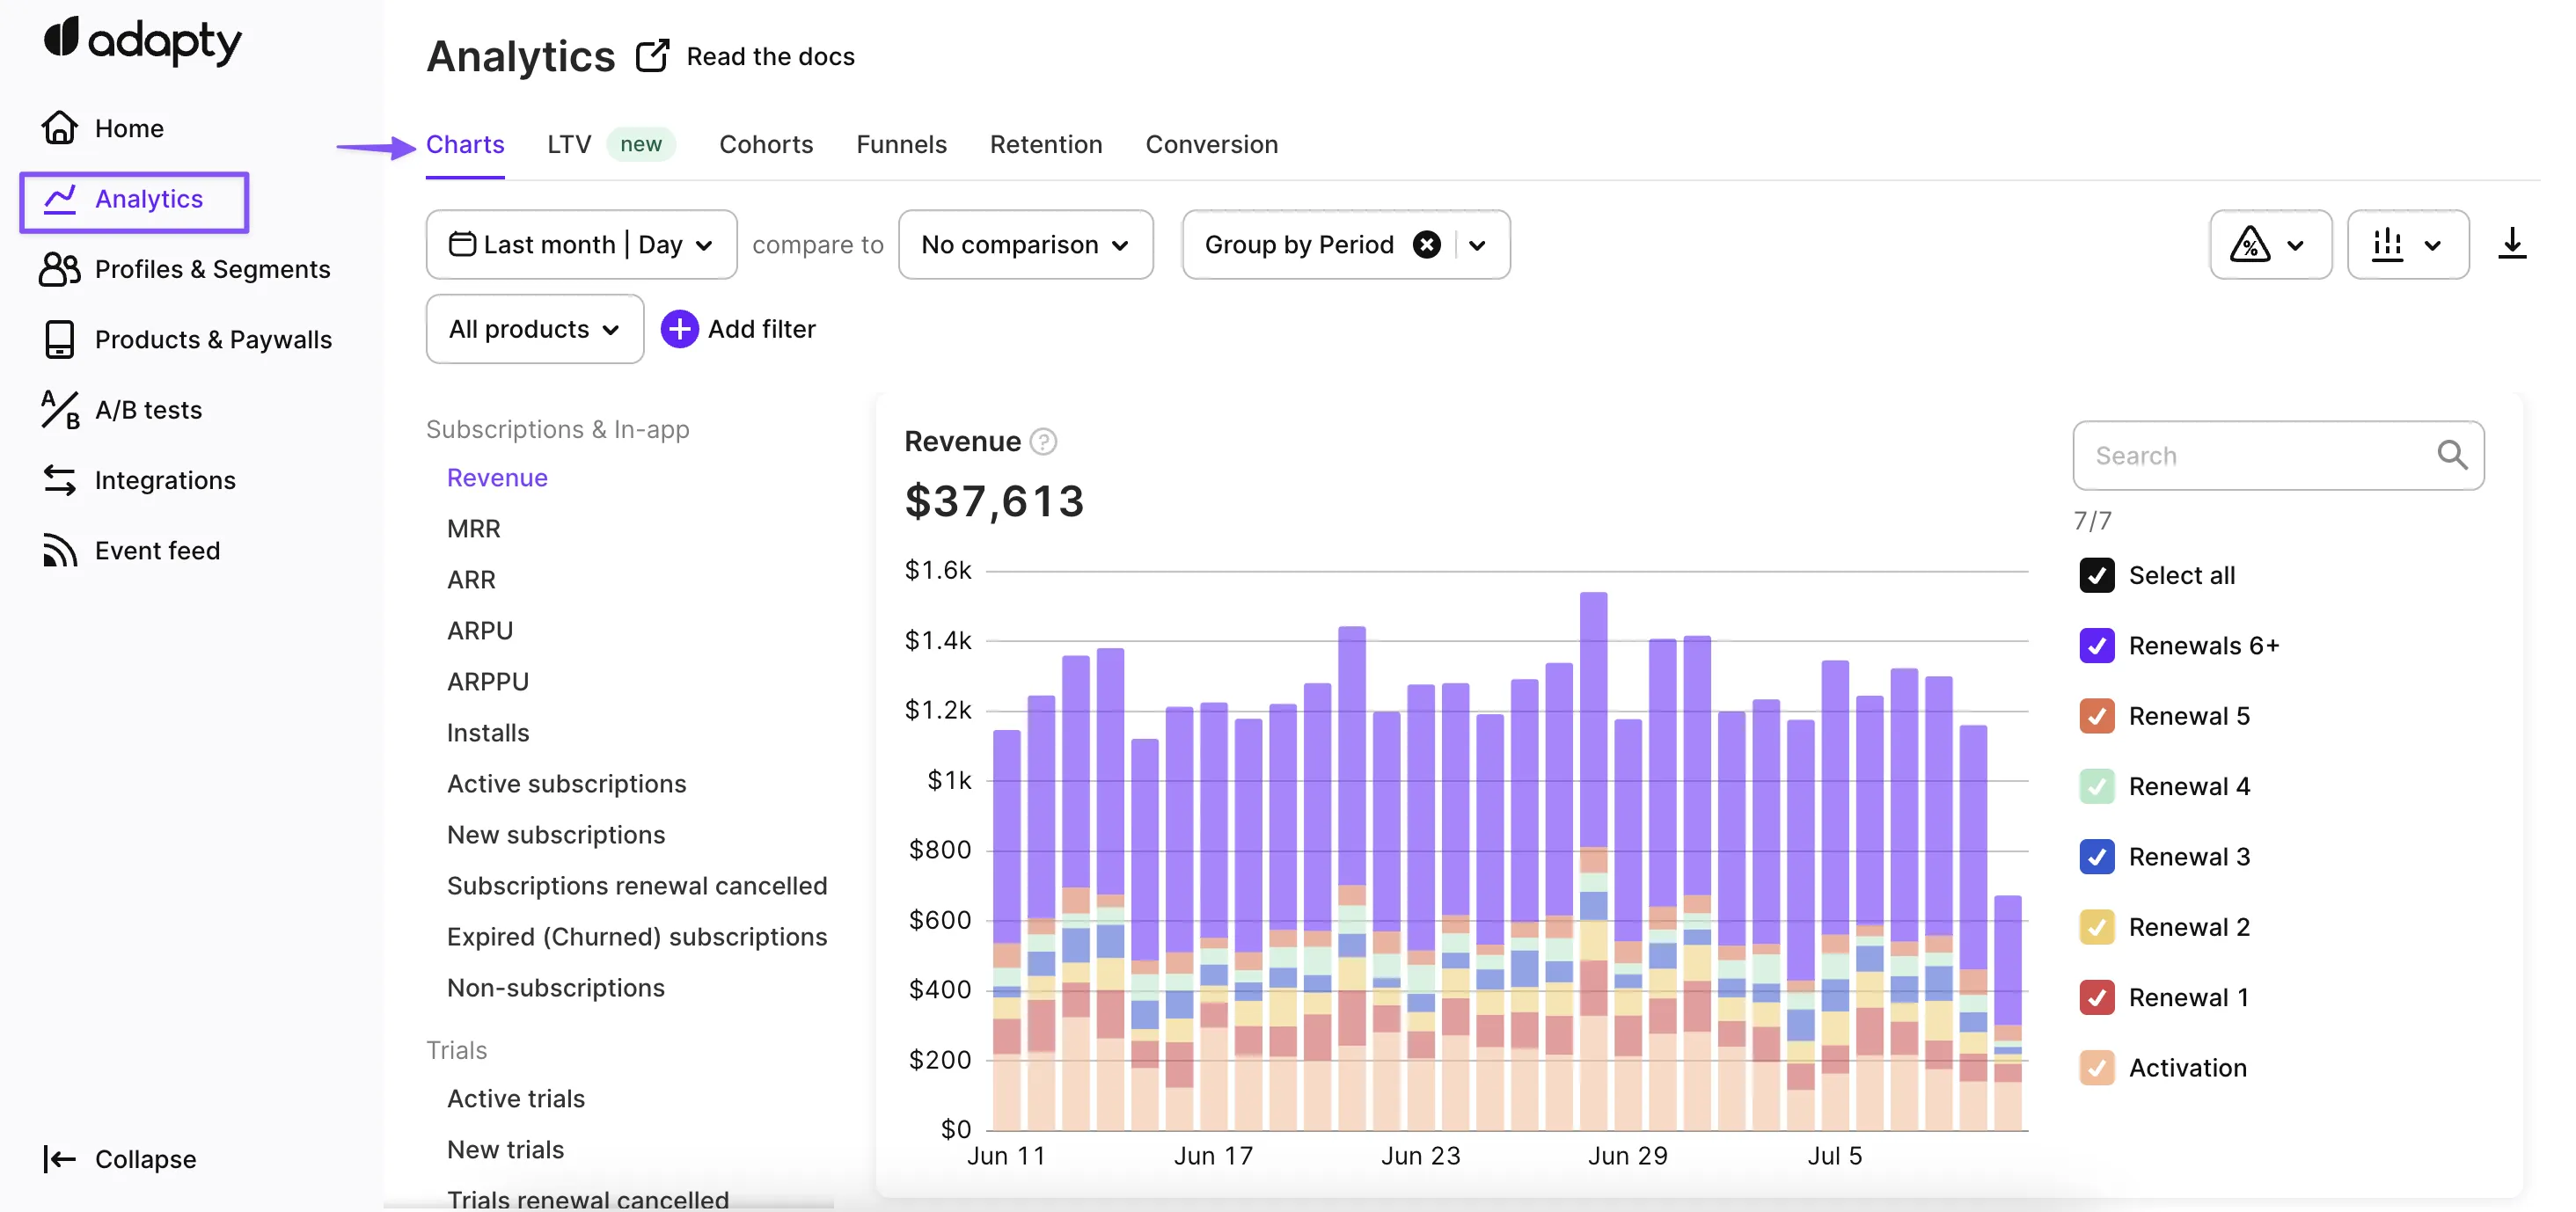
The Charts tab shows your app’s revenue, subscriptions, trials, and billing issues over time.
Sandbox transactions are excluded from all analytics charts. They still appear on individual profile pages and in the event feed.
For descriptions and side-by-side comparisons of every chart, see the Metric comparison table. For filtering, grouping, and time-range controls, see Analytics controls.
Paywalls and placements have their own metrics pages: Paywall metrics and Placement metrics.
Subscription and in-app charts
- Revenue: Total revenue from subscriptions and one-time purchases, minus refunds.
- MRR: Monthly recurring revenue from active subscriptions.
- ARR: Annual recurring revenue from active subscriptions.
- ARPU: Average revenue per user.
- ARPPU: Average revenue per paying user.
- Installs: Number of app installs.
- Active subscriptions: Paid subscriptions that haven’t expired.
- New subscriptions: Subscriptions activated for the first time.
- Subscription renewal cancelled: Subscriptions where auto-renewal was turned off.
- Expired (churned) subscriptions: Subscriptions that ended.
- Non-subscriptions: Count of consumables, non-consumables, and non-renewing subscriptions.
Trial charts
- Active trials: Trials that haven’t expired.
- New trials: Trials activated.
- Trial renewal cancelled: Trials where auto-renewal was turned off.
- Expired (churned) trials: Trials that ended without converting.
Billing and refund charts
- Grace period: Subscriptions that entered the grace period after a failed payment.
- Grace period converted: Grace period subscriptions that successfully renewed.
- Grace period converted revenue: Revenue from grace period recoveries.
- Billing issue: Subscriptions that entered the billing issue state.
- Billing issue converted: Billing issue subscriptions that successfully renewed.
- Billing issue converted revenue: Revenue from billing issue recoveries.
- Refund events: Number of refunded purchases or subscriptions.
- Refund money: Total amount refunded.