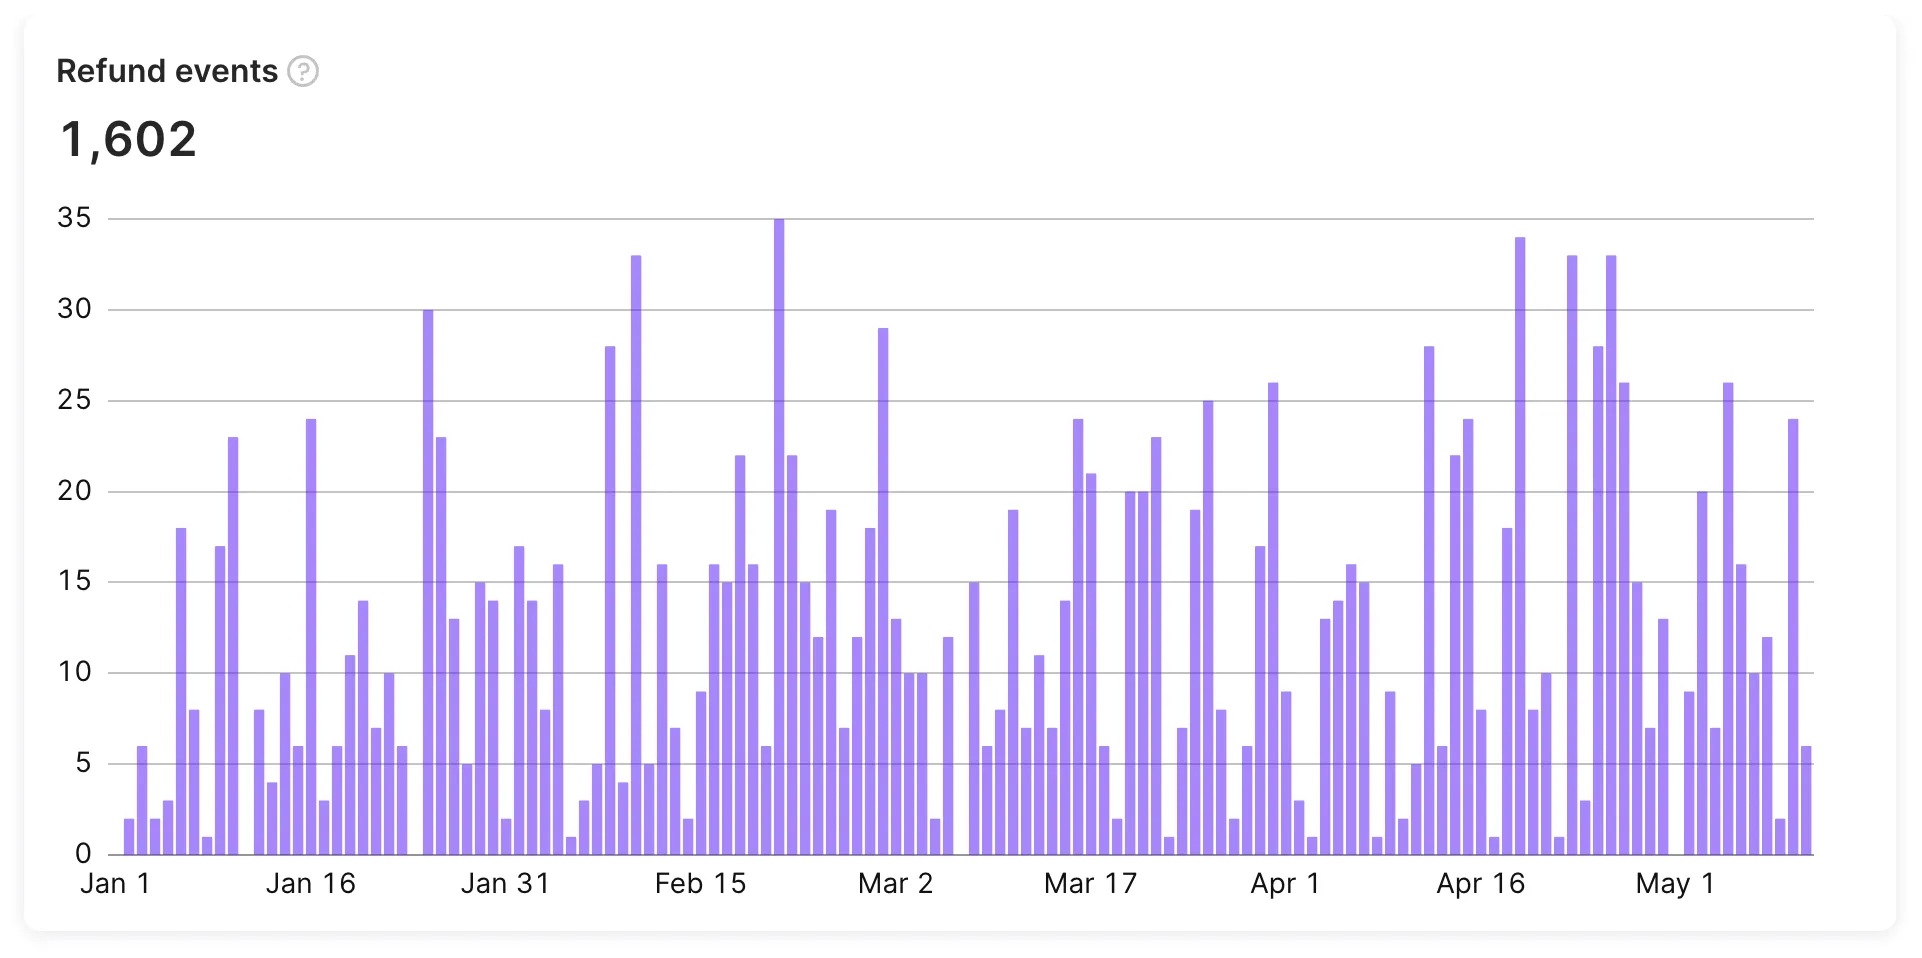
Refund events
The Refund events chart shows how many purchases and subscriptions were refunded. Adapty ties each refund event to the date the refund was issued, not to the subscription start date.
Calculation
Adapty counts every purchase or subscription refunded within the selected period. Each refund is attributed to the date it happened, not to when the subscription began. Refunds for trials are excluded because trials generate no revenue.
How metrics handle refunds
Different metrics treat refunds differently. The same refund event may decrease one chart immediately, decrease another chart retroactively (changing past-period values), or not affect a third at all. The matrix below shows the rules per metric.
| Metric | Refunds applied? | Attribution date | Can go negative? | Notes |
|---|---|---|---|---|
| Revenue | Yes | Refund date — not the original purchase date | Yes — on days when refunds exceed new revenue | Revenue = total transactions − refunds. |
| MRR | Yes, retroactively | Subscription is removed from all periods it was active | No | Past-period values can decrease after a refund. |
| ARR | Yes, retroactively | Same as MRR | No | Past-period values can decrease after a refund. |
| ARPU | Yes | Refund date | Yes (in refund-heavy periods) | Refunds subtract from the revenue numerator. |
| ARPPU | Yes, numerator only | Refund date | Yes (in refund-heavy periods) | Refunds subtract from the revenue numerator. A refunded user still counts in the paying-user denominator, so heavy refunds push ARPPU down faster than expected. |
| Active subscriptions | Yes, retroactively | Subscription is removed from count | No | |
| New subscriptions | No | — | No | Count includes later-refunded subscriptions. Compare with Refund events for net impact. |
| Refund money / Refund events | Refunds are the data | Refund date | No (always ≥ 0) | |
| Retention | No | — | No | Refunded users stay counted on the retention curve. This can make Retention look higher than Active subscriptions or Revenue for the same cohort. |
| Cohort revenue | Yes, cumulatively | Refund date | No (cumulative subtractions don’t drive cohort revenue below zero) | Refunds subtract from cohort revenue as they occur. For the other cohort metrics, see Cohorts > Refund handling. |
| Paywall metrics / A/B test metrics (counts) | No | — | No | Subscribers, Paying Subscribers, and ARPPU counts on these pages don’t deduct refunds. |
| GCS / S3 exports | Refund as its own event row | event_datetime = refund timestamp | Net columns can go negative when aggregating | The refund row carries is_refund = true (S3/GCS) or event type subscription_refunded (webhooks). |
Negative values
In aggregated views (the Revenue chart, custom analytics on exports), a metric can show a negative value for a specific period or grouping when refunds in that bucket exceed new revenue in the same bucket. This isn’t a bug — it’s the arithmetic working as designed.
For example: a country had no new purchases on a Tuesday, but a $100 refund for an older purchase was processed that day. The country’s revenue for Tuesday will show as −$100.
Available filters and grouping
Main article: Analytics controls
- ✅ Filter by: Attribution, Audience, Refund Reason, Country, Offer Type, Offer ID, Offer Discount Type, Paywall, A/B tests, Placement, Period, Segment, Store, Product, and Duration.
- ✅ Group by: Refund Reason, Product, Country, Store, Paywall, Audience, Placement, Duration, Offer Type, Offer Discount Type, Offer ID, Segment, and Attribution.
Similar metrics
For a side-by-side comparison of these metrics, see the Metric comparison table.