
ARPPU
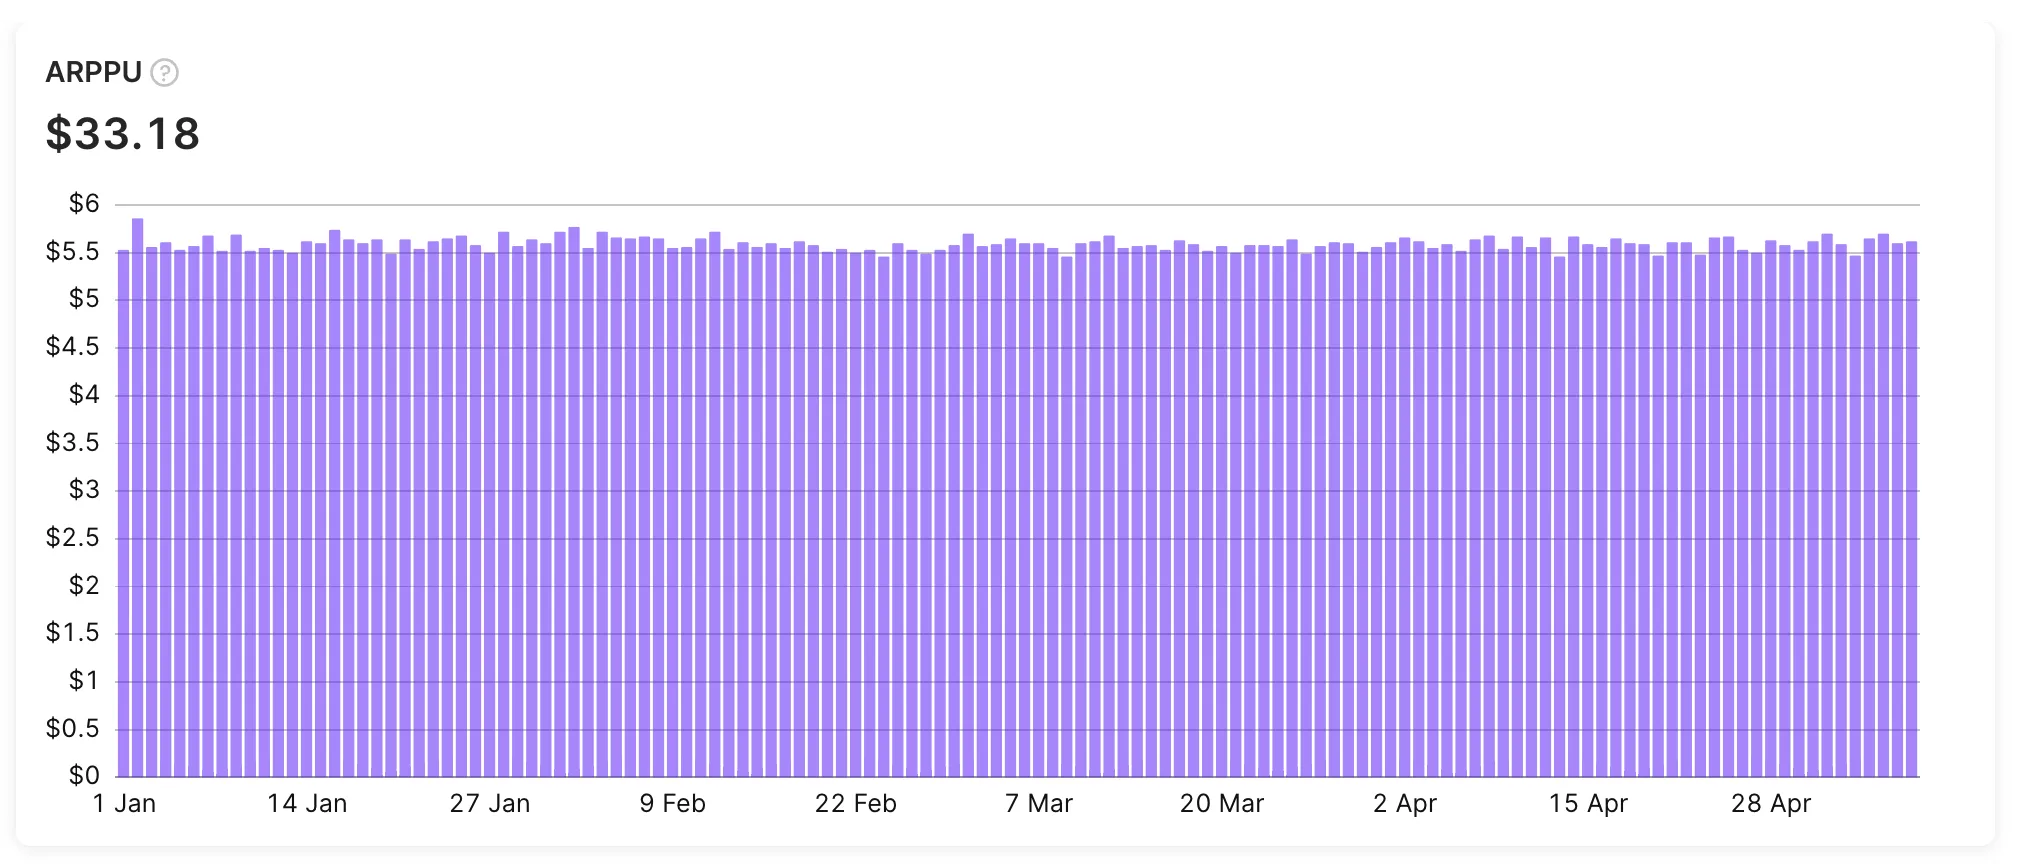
The Average revenue per paying user (ARPPU) chart displays the average revenue per paid user. It displays the actual revenue generated by paying customers, divided by the number of customers, minus refunds. Group ARPPU by attribution to see which acquisition channels bring in higher-value paying users.
Calculation
The calculator below does not take into account store commission and taxation. Compare the result to your gross revenue calculations.
ARPPU shows the average revenue per paying user — typically much higher than ARPU because non-paying users are excluded from the denominator.
ARPPU is the period’s revenue (minus refunds) divided by the number of paying users in that period.
ARPPU
Refund handling
Refunds subtract from the revenue numerator on the date the refund was processed. A user whose purchase was later refunded still counts in the paying-user denominator, so heavy refunds push ARPPU down faster than expected.
For the full comparison across metrics, see How metrics handle refunds.
Currency
Adapty displays all monetary charts in US dollars, regardless of the original transaction currency. This includes Revenue, MRR, ARR, ARPU, ARPPU, LTV, predicted revenue, refund money, and the revenue figures inside cohorts and A/B test reports. There’s no setting to display them in another currency.
Adapty converts each transaction to USD using a rate from currencylayer.com refreshed every 8 hours, fixed at the time of the transaction. Historical USD values don’t re-rate when FX moves.
Local-currency values are available per-transaction in:
- The
price_localandcurrencyfields in webhooks - The
_localcolumns (such asrevenue_localandproceeds_local) andcurrencyin S3, GCS, and BigQuery exports - The profile page (per-transaction view)
For finance reporting in a local currency, pull the per-transaction local-currency values from an export and aggregate them yourself.
Available filters and grouping
Main article: Analytics controls
- ✅ Filter by: Attribution, Audience, Country, Paywall, Flow, Flow screen, A/B tests, Placement, Period, Segment, Store, Product, and Duration.
- ✅ Group by: Period, Renewal status, Product, Country, Store, Paywall, Flow, Flow screen, Audience, Placement, Duration, Segment, and Attribution.
Similar metrics
For a side-by-side comparison of these metrics, see the Metric comparison table.