
New trials
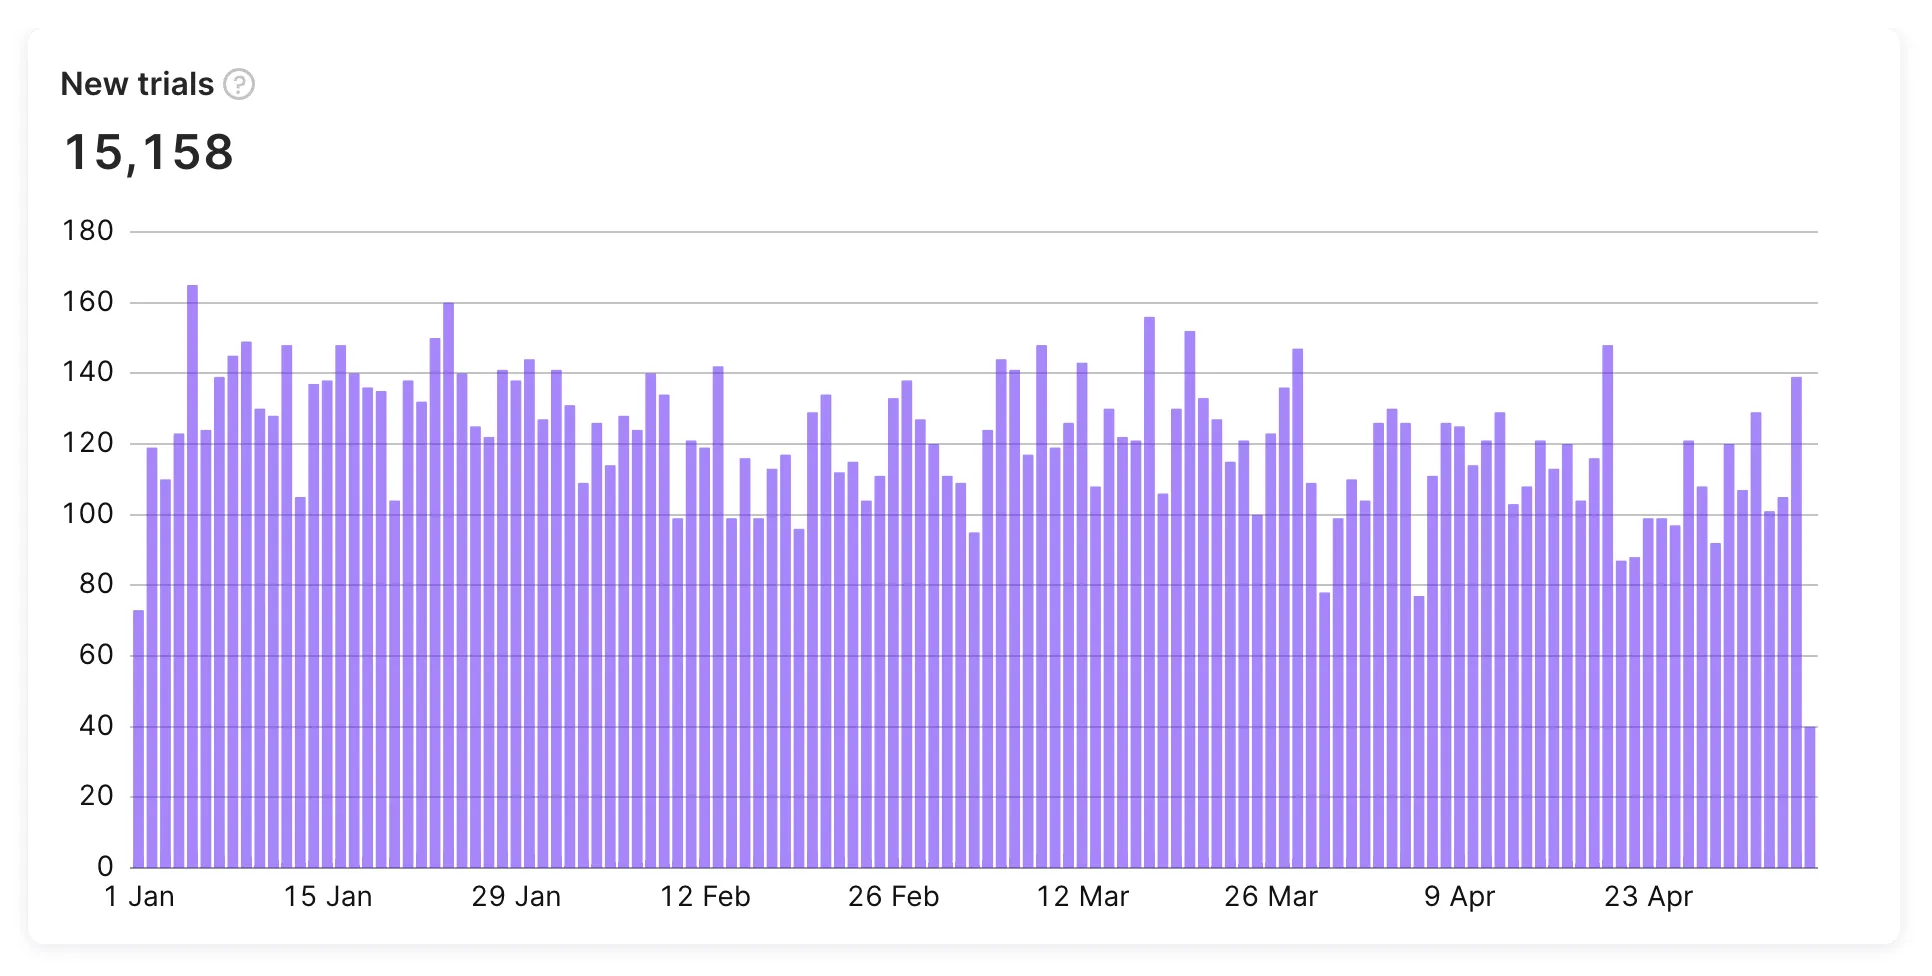
The new trial chart displays the number of activated trials during the selected time period. Use it to track trial volume from ad campaigns and other acquisition efforts.
Calculation
The new trials metric counts trials started during the period, regardless of whether they’re still active by the end of the period.
For example, if 50 users start a trial in May, the May data point shows 50 — even if some have already expired or converted to paid by the time you view the chart.
Available filters and grouping
Main article: Analytics controls
- ✅ Filter by: Attribution, Audience, Country, Offer Type, Offer ID, Offer Discount Type, Paywall, Flow, Flow screen, A/B tests, Placement, Segment, Store, Product, and Duration.
- ✅ Group by: Product, Country, Store, Paywall, Flow, Flow screen, Audience, Placement, Duration, Offer Type, Offer Discount Type, Offer ID, Segment, and Attribution.
Similar metrics
For a side-by-side comparison of these metrics, see the Metric comparison table.