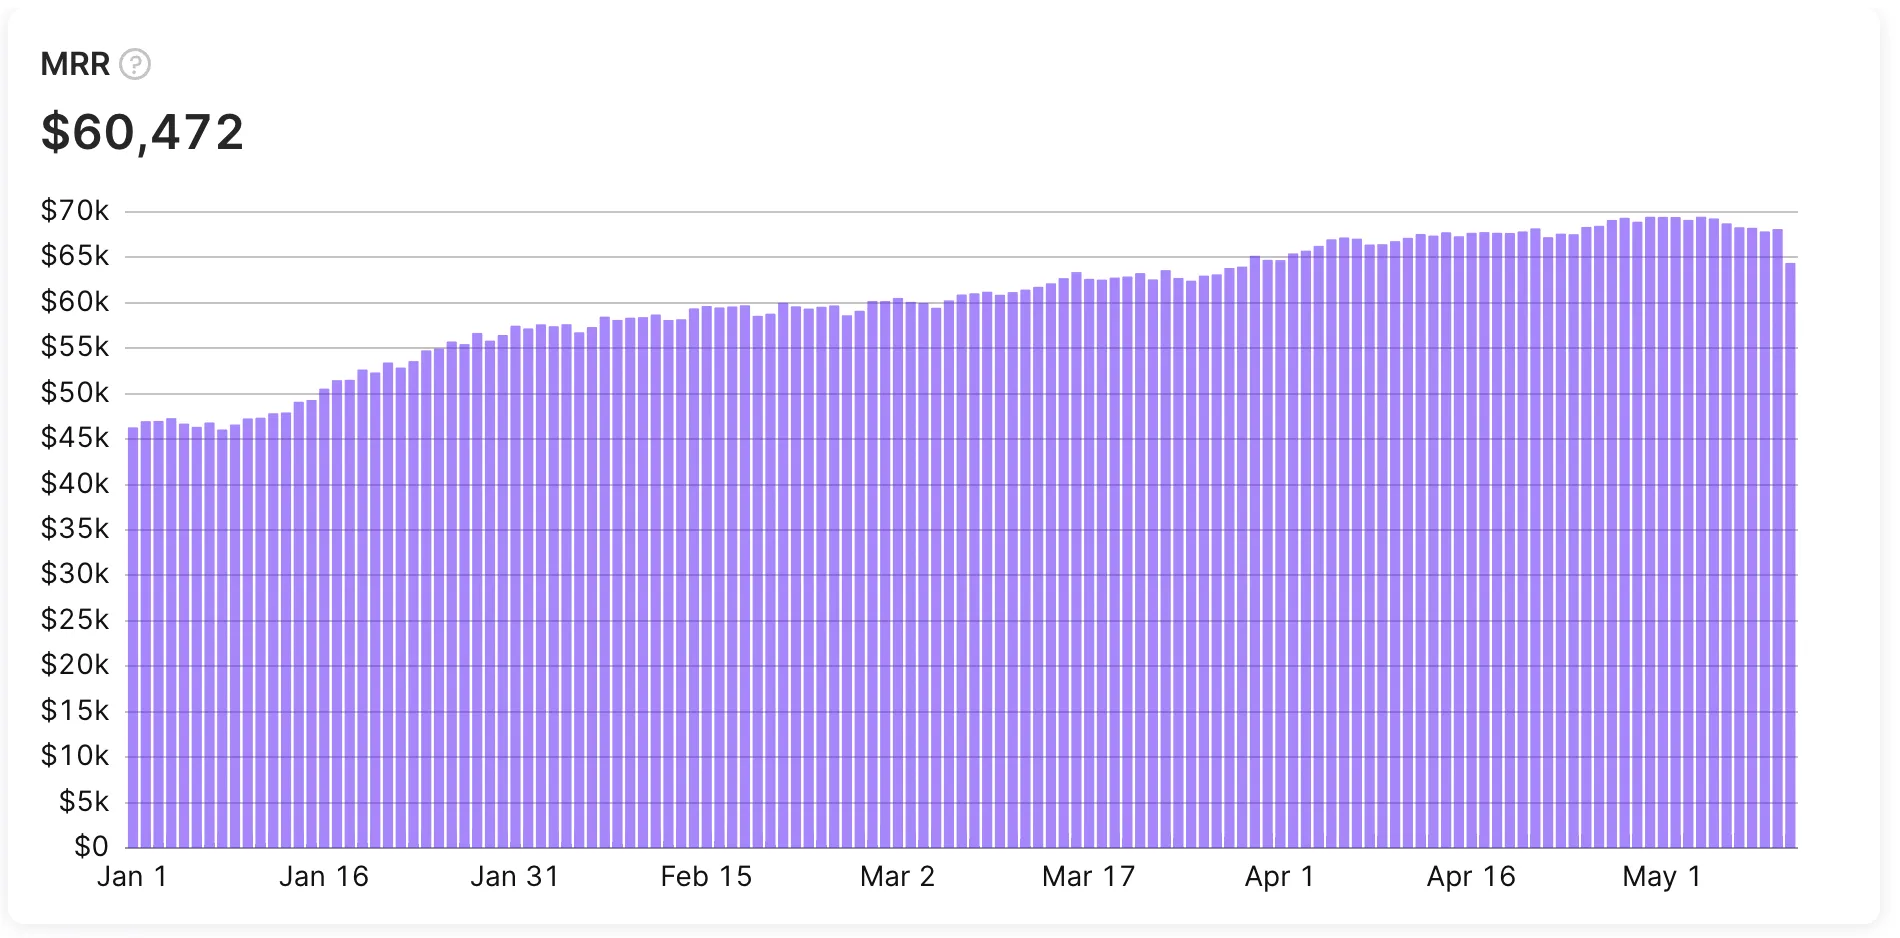
MRR
The Monthly recurring revenue (MRR) chart displays the normalized revenue generated by your active paid subscriptions on a monthly basis. This chart enables you to understand your business’s velocity and size, regardless of the fluctuations that may arise from varying subscription durations.

Calculation
Adapty calculates the predictable and recurring revenue components of your subscription business using the following formula:

Where:
Ps - subscription price
Ns - number of active paid subscriptions for this subscription. Adapty considers any paid subscription that has not yet expired as an active subscription.
Dsm - subscription duration in months (0.23 for weekly subscriptions)
It is important to note that Adapty does not include non-recurring subscriptions, consumable, or one-time purchases in the calculation of Monthly Recurring Revenue (MRR). This is because these types of purchases do not represent predictable and recurring revenue.
Basically, MRR shows revenue from all active subscriptions normalized to one month. For example, for a yearly subscription, instead of counting full revenue from the start, revenue is split into 12 equal parts which are evenly spread across 12 month period.
MRR excludes subscriptions that have been refunded. When a subscription is refunded, it’s removed from the MRR calculation for all periods it was active, ensuring that MRR reflects only the recurring revenue from subscriptions that remain valid.
E.g. if there are 2 active yearly subscriptions with price $240 and 10 monthly subscriptions with a price $30,
MRR = (2 * $240 / 12) + (10 * $30 / 1) + (20 * $10 / 0.23) = $1209.5
Available filters and grouping
- ✅ Filter by: Attribution, country, paywall, store, product, and duration.
- ✅ Group by: Renewal status, period, product, country, store, paywall, duration, attribution status, attribution channel, attribution campaign, attribution Ad group, attribution Ad set, and attribution creative.
You can find more information about the available controls, filters, grouping options, tax and commission controls, and how to use them in this documentation.
MRR chart usage
MRR is a crucial metric for businesses that rely on recurring subscription revenue. It not only captures the size of your subscriber base but also standardizes different subscription durations to a common denominator (monthly recurring revenue). By doing so, MRR provides a real velocity metric for your business, making it easier to track your growth trajectory accurately.
To leverage MRR effectively, segment your subscriber cohorts by their first purchase month and change the resolution to monthly. By doing this, you can create a stacked area chart that reveals how monthly subscriber cohorts have translated over time. This approach enables you to identify trends and patterns in your subscriber base, making it easier to adjust your business strategy and optimize your products and marketing efforts accordingly.
Similar metrics
In addition to MRR, Adapty also provides metrics for other revenue-related events, such as Revenue, ARR, ARPU, and ARPPU. To learn more about these revenue-related metrics, please refer to the following documentation guides: