ARR
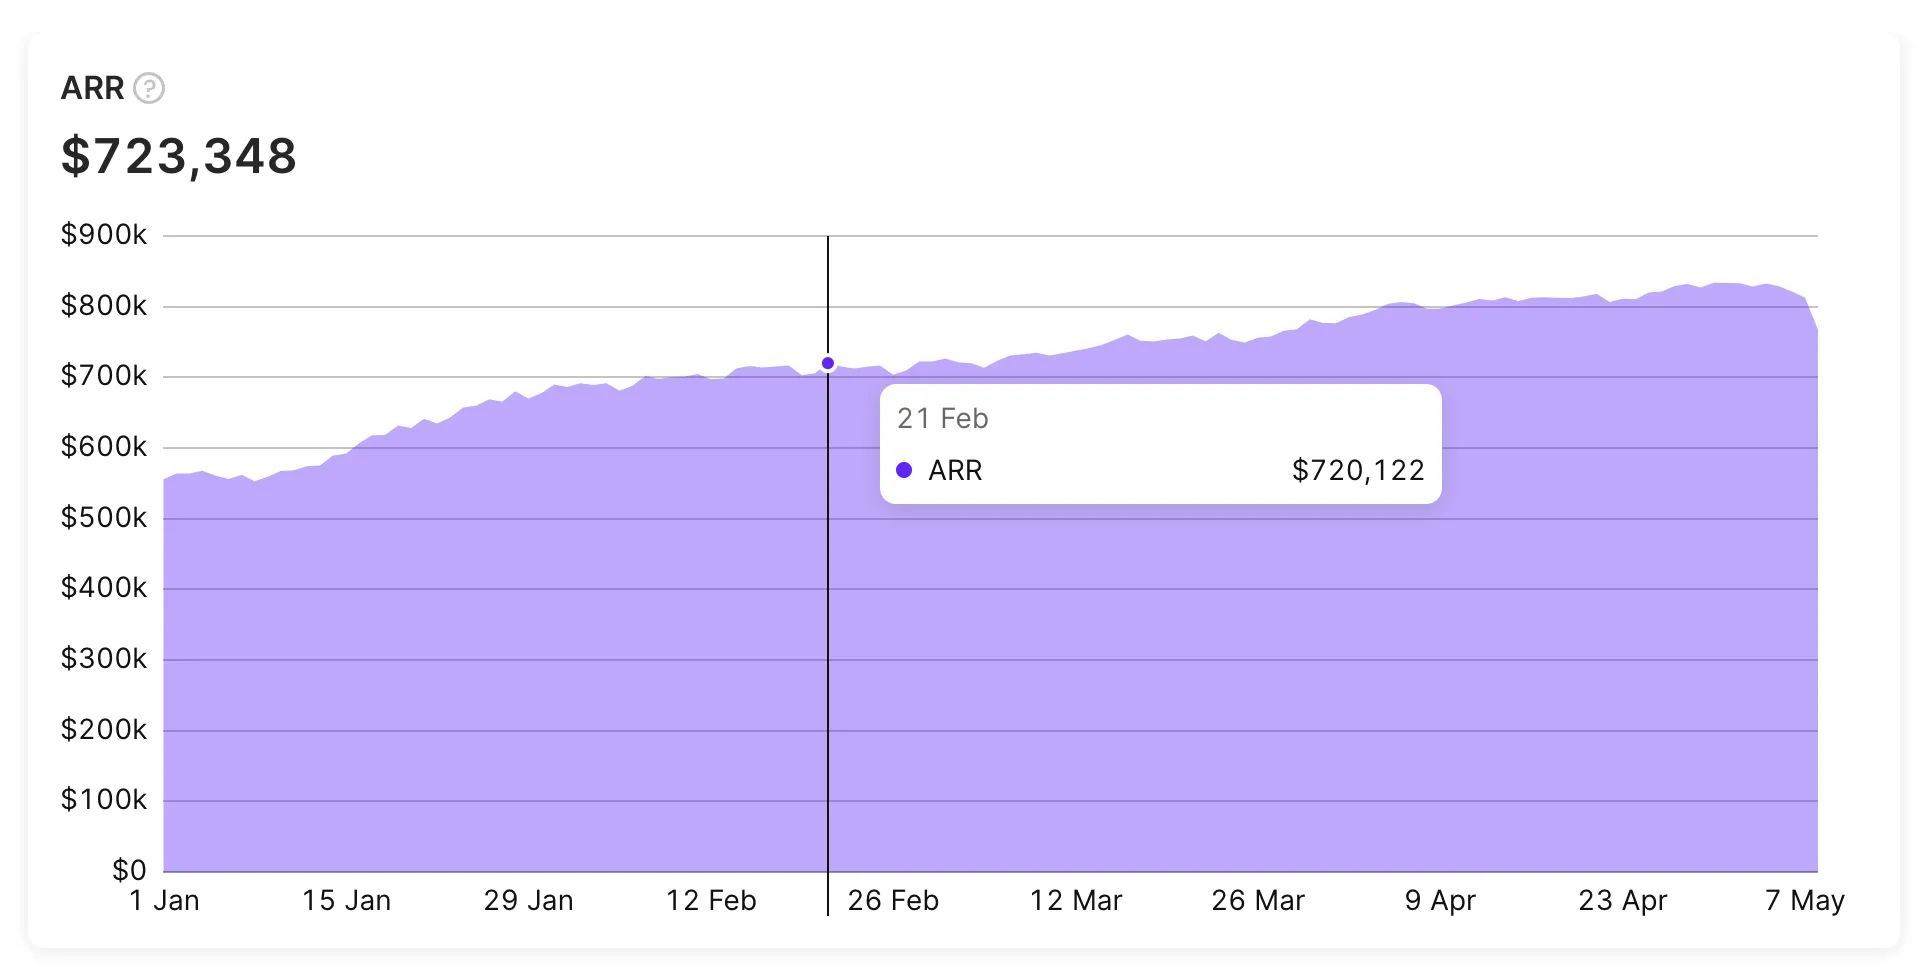
The Annual recurring revenue chart shows revenue from all active auto-renewable subscriptions normalized to one year. The chart considers any paid, unexpired subscription as active. ARR is a crucial metric for tracking your subscription business’s growth and predicting future revenue.
Calculation
The calculator below does not take into account store commission and taxation. Compare the result to your gross revenue calculations.
ARR is the annualized version of your recurring subscription revenue. It’s most useful when annual subscriptions are your primary product — for businesses with mostly monthly or weekly subscriptions, MRR is more informative.
ARR is the sum of (price × active subscribers ÷ billing period in years) across all your subscription types. Use 1/12 for monthly, 1/52 for weekly.
ARR
Refund handling
When a subscription is refunded, ARR removes its contribution from every date on the chart where it was previously counted. Past ARR values can decrease after a refund lands.
For the full comparison across metrics, see How metrics handle refunds.
Currency
Adapty displays all monetary charts in US dollars, regardless of the original transaction currency. This includes Revenue, MRR, ARR, ARPU, ARPPU, LTV, predicted revenue, refund money, and the revenue figures inside cohorts and A/B test reports. There’s no setting to display them in another currency.
Adapty converts each transaction to USD using a rate from currencylayer.com refreshed every 8 hours, fixed at the time of the transaction. Historical USD values don’t re-rate when FX moves.
Local-currency values are available per-transaction in:
- The
priceandcurrency_codefields in webhooks - The
priceandcurrency_codecolumns in S3, GCS, and BigQuery exports - The profile page (per-transaction view)
For finance reporting in a local currency, pull the per-transaction local-currency values from an export and aggregate them yourself.
Renewal pricing
Adapty calculates renewal revenue at the product’s current price, even for users who were on a previous price when they first subscribed. After you change a price in App Store Connect or Google Play, the dashboard’s Revenue, MRR, and ARR figures for existing subscribers may diverge from the actual revenue collected — Adapty applies the new price, even if the store kept those users on the old one.
To verify, compare the per-transaction price field in the S3, GCS, or BigQuery export against the dashboard for the same transactions. The export field reflects what the store reported (the price the customer actually paid); the dashboard reflects the current product price.
Available filters and grouping
Main article: Analytics controls
- ✅ Filter by: Attribution, Audience, Country, Offer Type, Offer ID, Offer Discount Type, Paywall, A/B tests, Placement, Period, Segment, Store, Product, and Duration.
- ✅ Group by: Period, Renewal status, Product, Country, Store, Paywall, Audience, Placement, Duration, Offer Type, Offer Discount Type, Offer ID, Segment, and Attribution.
Similar metrics
For a side-by-side comparison of these metrics, see the Metric comparison table.