Onboarding metrics
Adapty collects a series of metrics to help you better measure the performance of the onboardings. All metrics are updated in real-time, except for the views, which are updated once every several minutes. This document outlines the metrics available, their definitions, and how they are calculated.
The onboarding revenue is calculated from all the transactions that occurred after the onboarding has been shown.
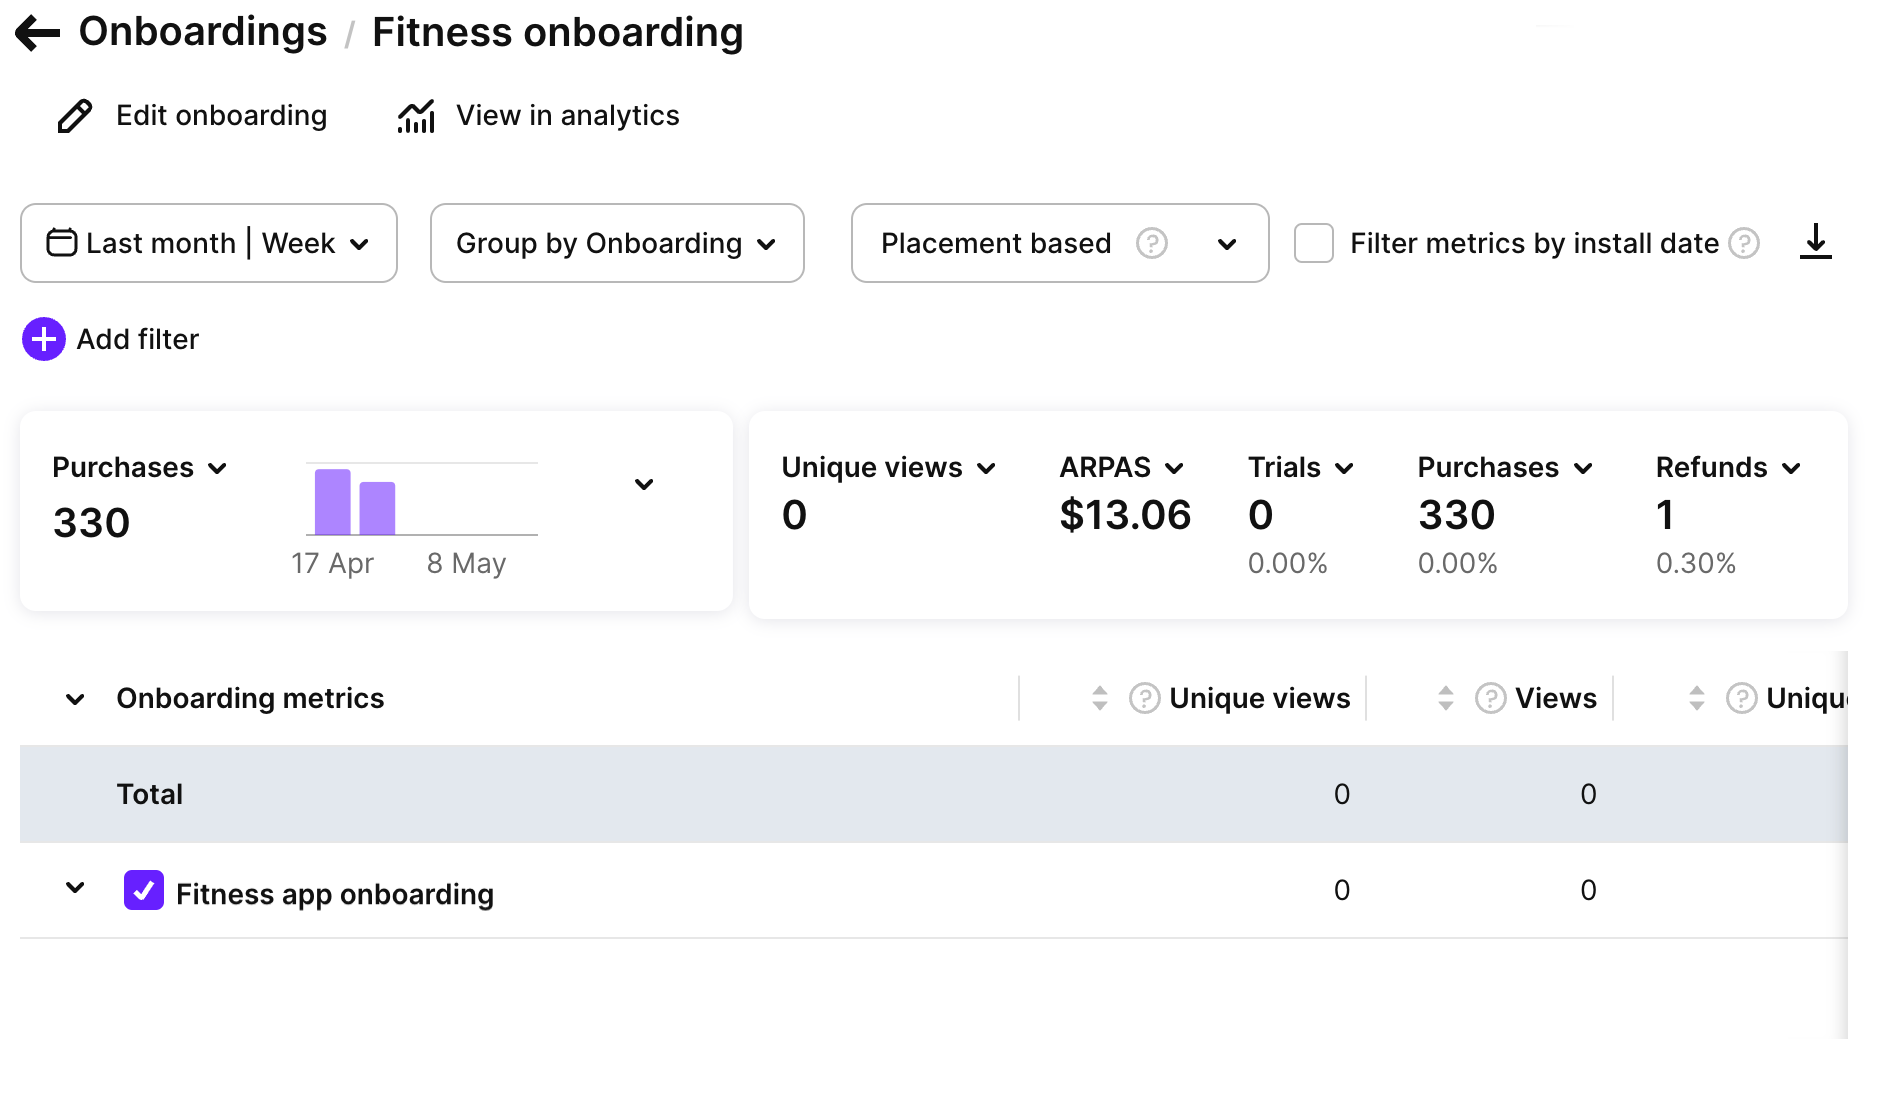
Onboarding metrics are available on the onboarding list, providing you with an overview of the performance of all your onboardings. This consolidated view presents aggregated metrics for each onboarding, allowing you to assess their effectiveness and identify areas for improvement.
For a more granular analysis of each onboarding, you can navigate to the onboarding detail metrics. In this section, you will find comprehensive metrics specific to the selected onboarding, offering deeper insights into its performance.
Metrics controls
The system displays the metrics based on the selected time period and organizes them according to the left-side column parameter with three indentation levels.
For Live onboardings, the metrics cover the period from the onboarding’s start date until the current date. For inactive onboardings, the metrics encompass the entire period from the start date to the end of the selected time period. Draft and archived onboardings are included in the metrics table, but if no data is available, they will be listed without any displayed metrics.
View options for metrics data
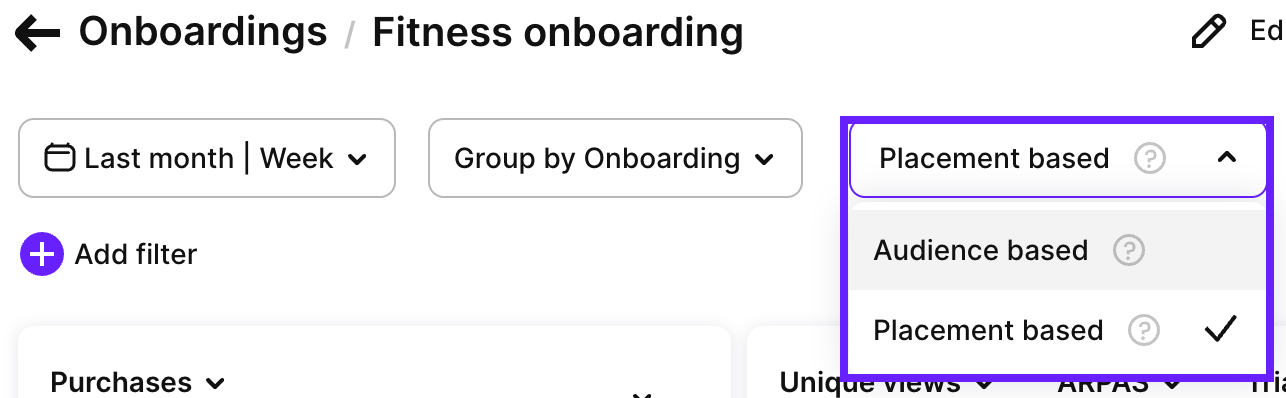
The onboarding page offers two viewing options for metrics data:
-
Placement-based view: Metrics are grouped by placements associated with the onboarding. This allows users to analyze metrics by different placements.
-
Audience-based view: Metrics are grouped by the target audience of the onboarding. Users can assess metrics specific to different audience segments.
The dropdown at the top of the onboarding page allows you to select the preferred view.
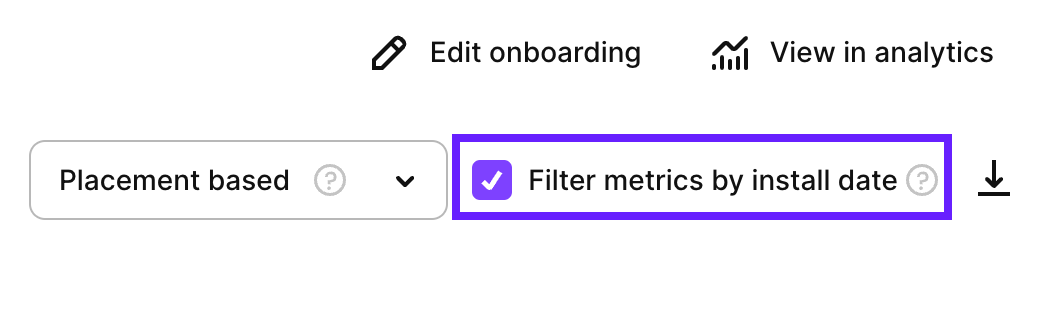
Filter metrics by install date
The Filter metrics by install date checkbox lets you analyze data based on when users installed your app. This helps you measure how well you’re acquiring new users during specific time periods. It’s a handy option when you want to customize your analysis.
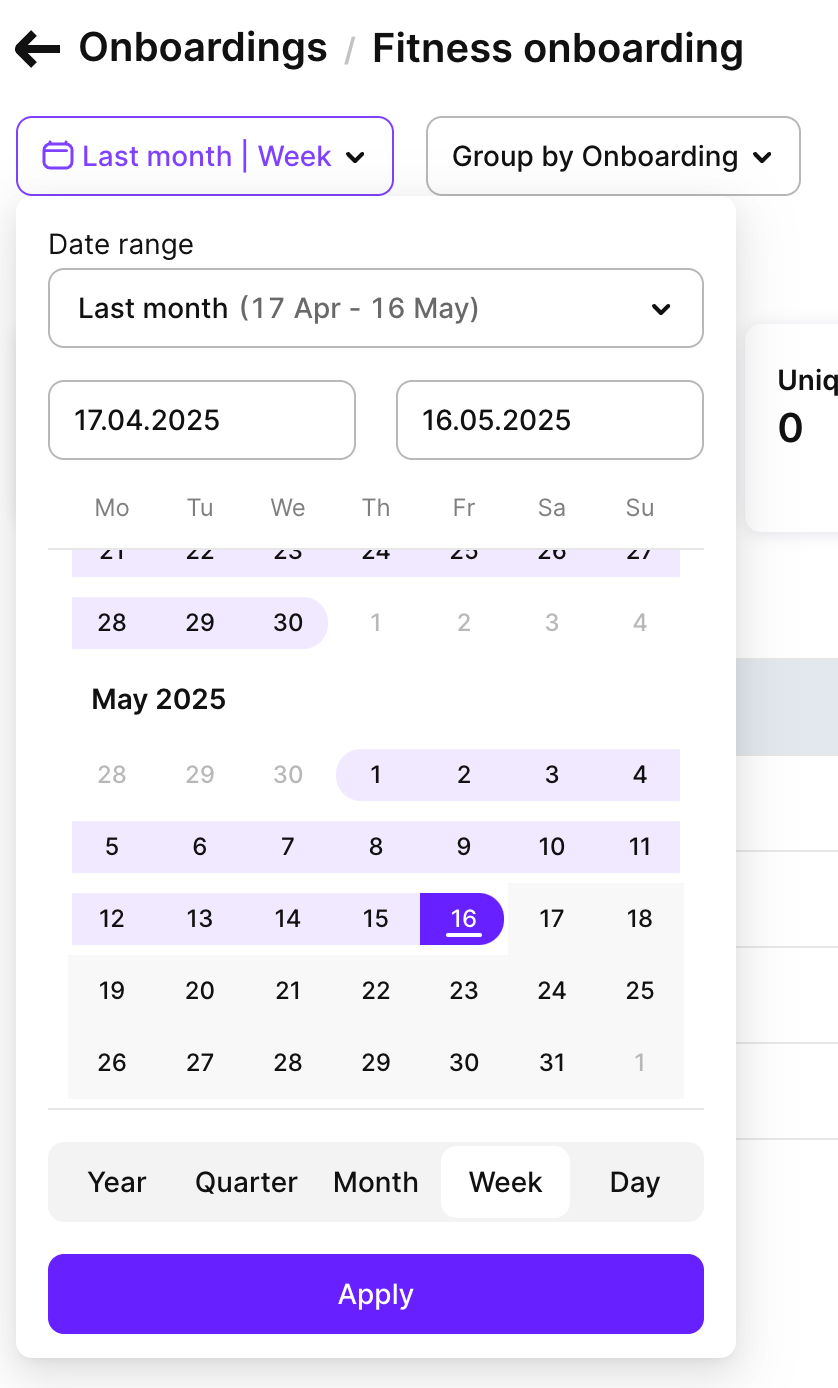
Time ranges
You can analyze metrics data using a time range, allowing you to focus on specific durations such as days, weeks, months, or custom date ranges.
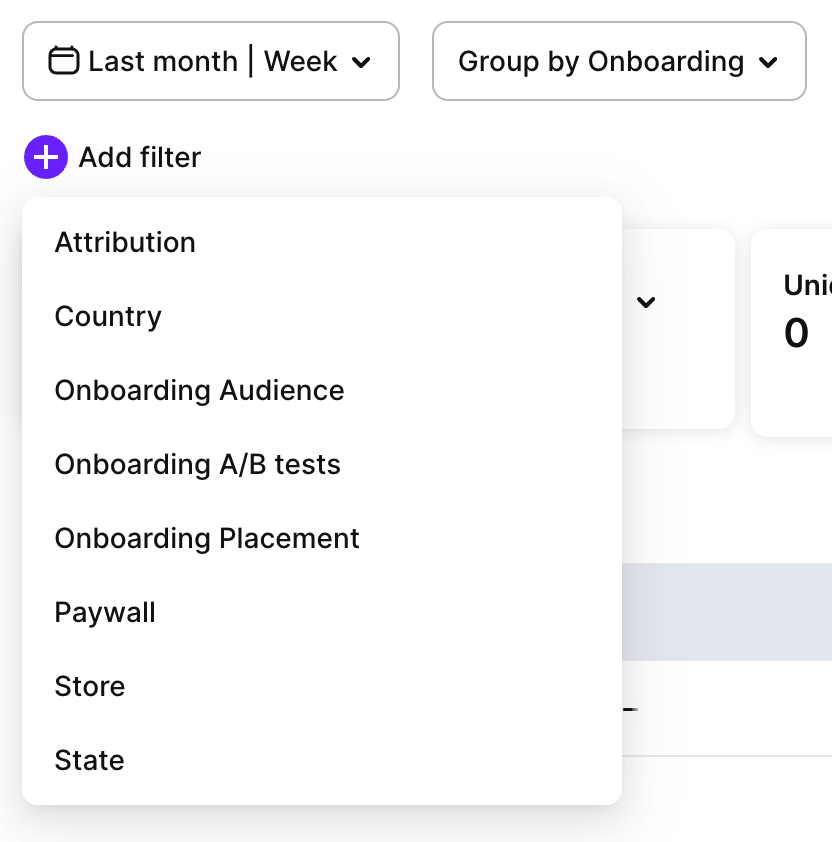
Filters and groups
Adapty offers powerful tools for filtering and customizing metrics analysis to suit your needs. Adapty’s metrics page gives you access to various time ranges, grouping options, and filtering possibilities.
-
Filter by: Attribution, Country, Onboarding audience, Onboarding A/B tests, Onboarding placement, Paywall, Store, State.
-
Group by: Product or Store.
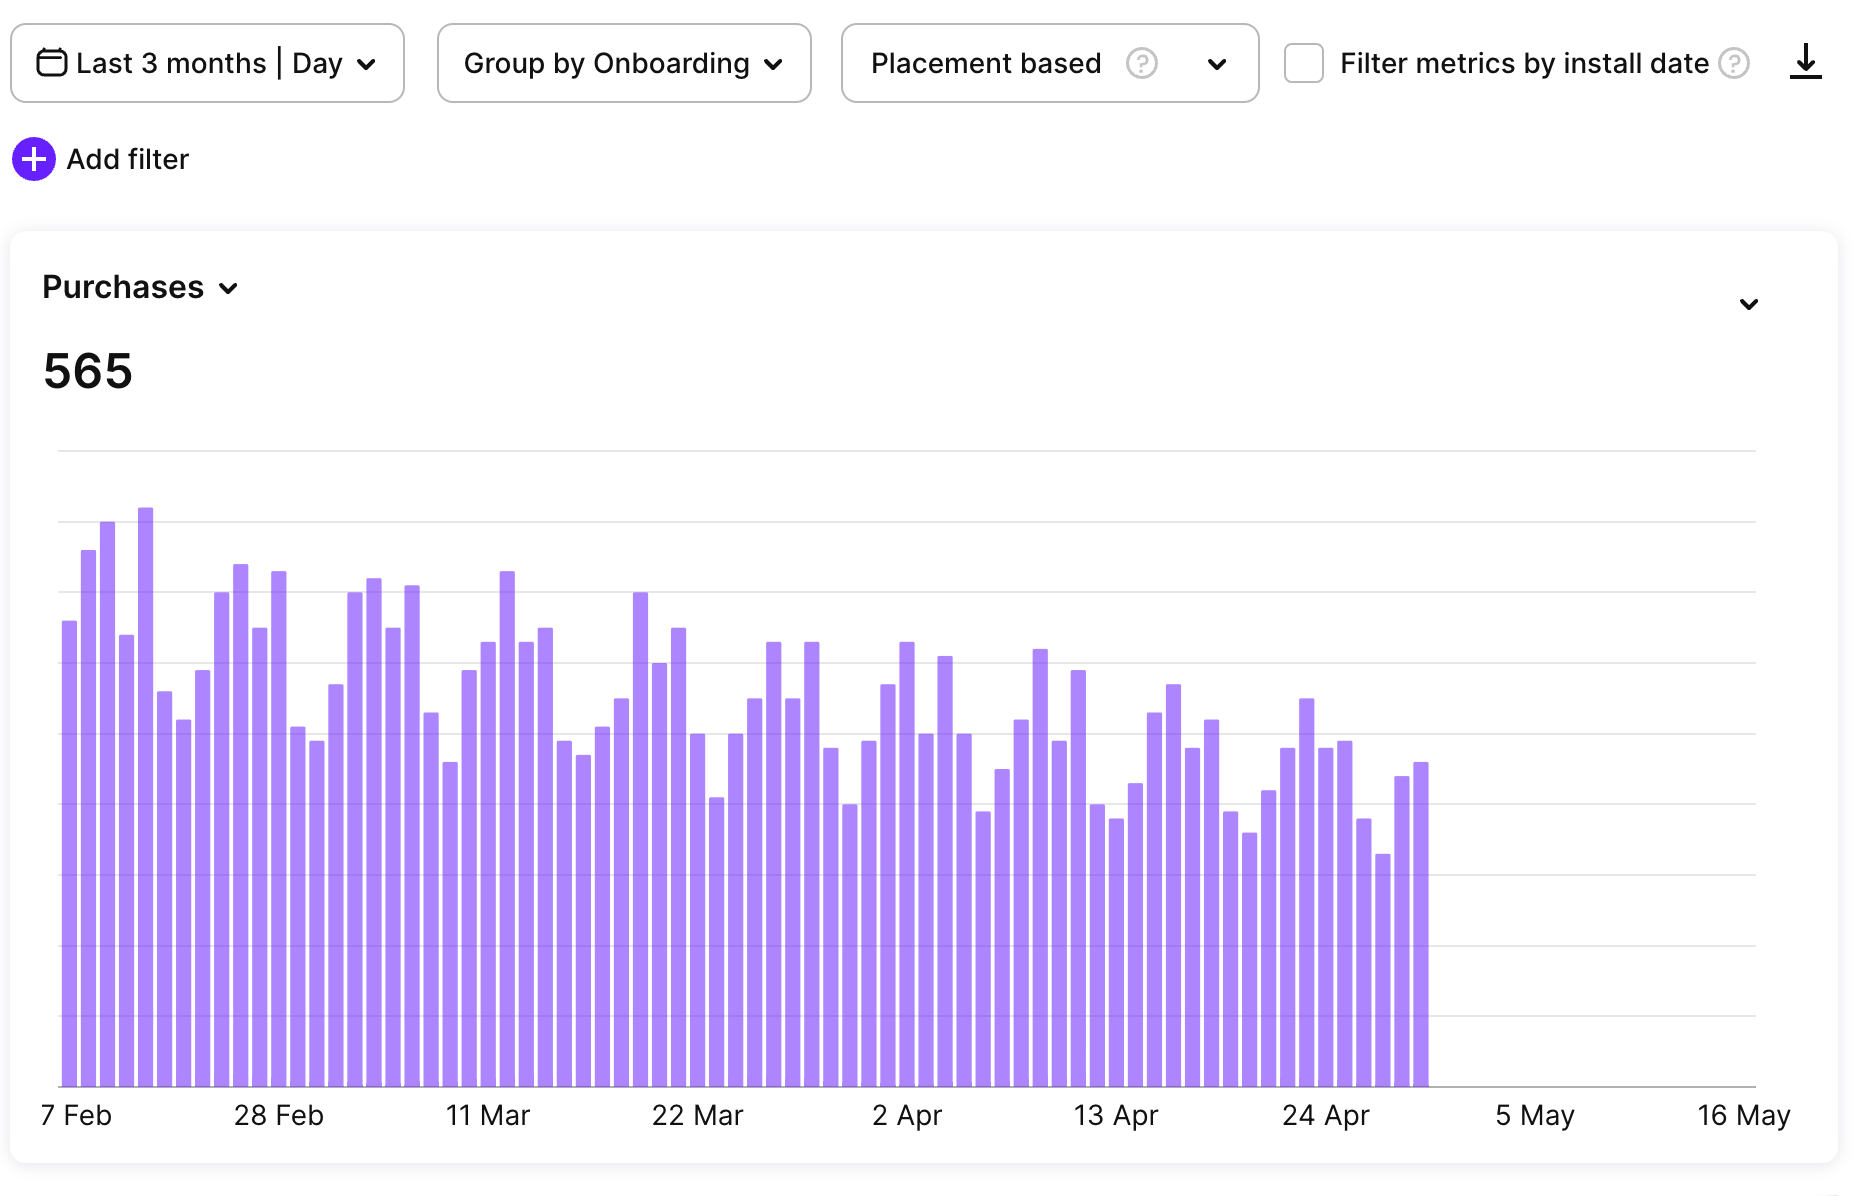
Single metric chart
The chart section shows your data in a simple bar graph. The chart helps you quickly see:
- The exact numbers for each metric.
- Period-specific data.
A total sum appears next to the chart, giving you the complete picture at a glance.
Click the arrow icon to expand the chart.
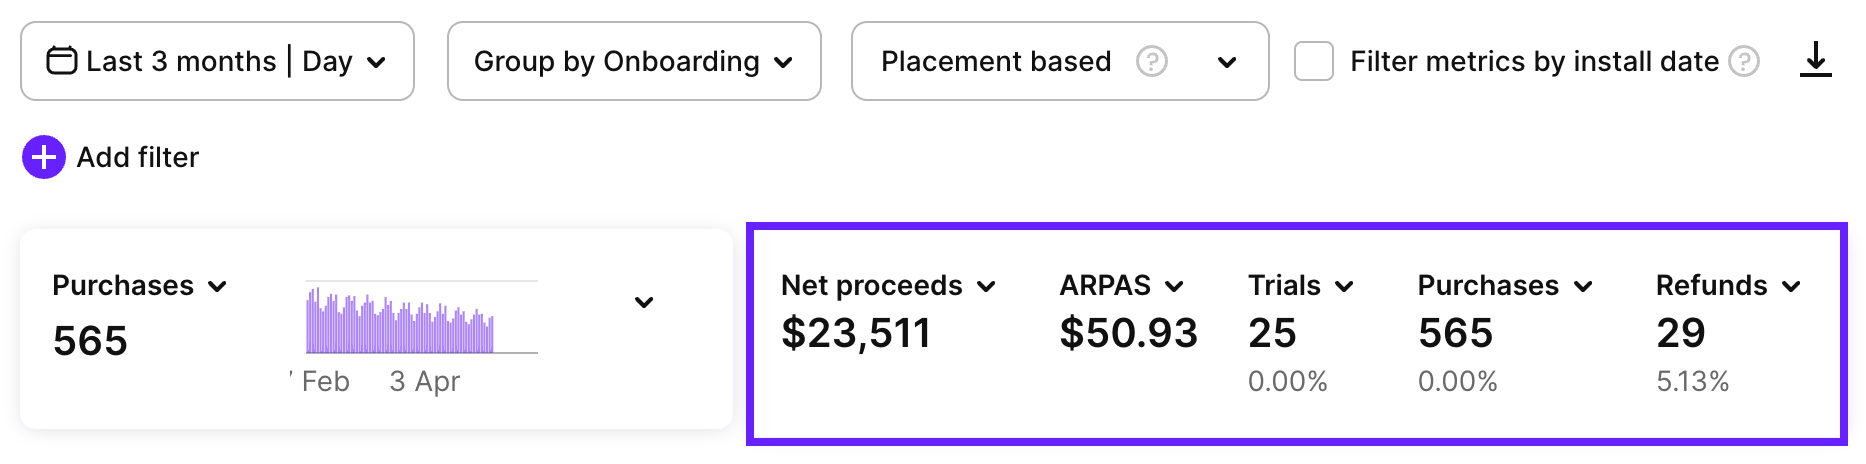
Total metrics summary
Next to the single metrics chart, there is a total metrics summary section. This section shows the cumulative values for the selected metrics at a specific point in time. You can change the displayed metric using a dropdown menu.
Metrics definitions
Views & unique views
Views count the number of times users see your onboarding. If someone visits twice, that’s two views but one unique view. This metric helps you understand how often your onboarding has been shown.
Completions & unique completions
Completions count the number of times users complete your onboarding, meaning that they go from the first to the last screen. If someone completes it twice, that’s two completions but one unique completion.
Unique completions rate
The unique completion number divided by the unique view number. This metric helps you understand how people engage with onboarding and make changes if you notice that people ignore it.
Revenue
Revenue shows your total earnings in USD from purchases and renewals. This is the amount before any deductions.
Proceeds
Proceeds shows what you receive after App Store/Play Store takes their commission, but before taxes.
Notify Adapty if your app is enrolled in a reduced commission program. To ensure correct calculations, specify your Small Business Program and Reduced Service Fee program status in your app settings.
Net proceeds
Your final earnings after both store commissions and taxes are deducted.
ARPPU
ARPPU is the average revenue per paying user. It’s calculated as total revenue divided by the number of unique paying users. $15000 revenue / 1000 paying users = $15 ARPPU.
ARPU
ARPU is the average revenue per user who viewed the onboarding. It’s calculated as total revenue divided by the number of unique viewers.
ARPAS
ARPAS shows how much money each active subscriber generates on average. Simply divide your total revenue by your number of active subscribers. For example: $5,000 revenue ÷ 1,000 subscribers = $5 ARPAS.
CR purchases & unique CR purchases
Conversion rate to purchases shows what percentage of onboarding views lead to purchases. For example, 10 purchases from 100 views is 10% conversion rate. Unique CR purchases measures what percentage of unique users who view your onboarding end up making a purchase, counting each user only once, regardless of how many times they see it.
CR trials & unique CR trials
Conversion rate to trials shows what percentage of onboarding views lead to starting a trial. For example, 10 trials from 100 views is 10% conversion rate. Unique CR trials measures what percentage of unique users who view your onboarding start a trial, counting each user only once, regardless of how many times they see it.
Purchases
Purchases counts all transactions on your onboarding, except renewals. This includes:
- New direct purchases
- Trial conversions
- Plan changes (upgrades, downgrades, cross-grades)
- Subscription restores
This metric gives you a complete picture of new transaction-related activity from your onboarding.
Trials
Trials counts the number of users who started free trial periods through your onboarding. This helps you track how well your trial offers attract users before they decide to pay.
Trials cancelled
Trials cancelled shows how many users turned off auto-renewal during their trial period. This tells you how many people decided not to continue with a paid subscription after trying your service.
Refunds
Refunds counts how many purchases and subscriptions were returned for a refund, regardless of the reason.
Refund rate
Refund rate shows the percentage of first-time purchases refunded. Example: 5 refunds from 1,000 purchases = 0.5% refund rate. Renewals aren’t counted in this calculation.