Analytics in Adapty Attribution
Analytics is a section of the Adapty Attribution Dashboard that allows you to see multiple campaign metrics in a single place. You can customize which charts you would like to see and view data for all of your campaigns at once.
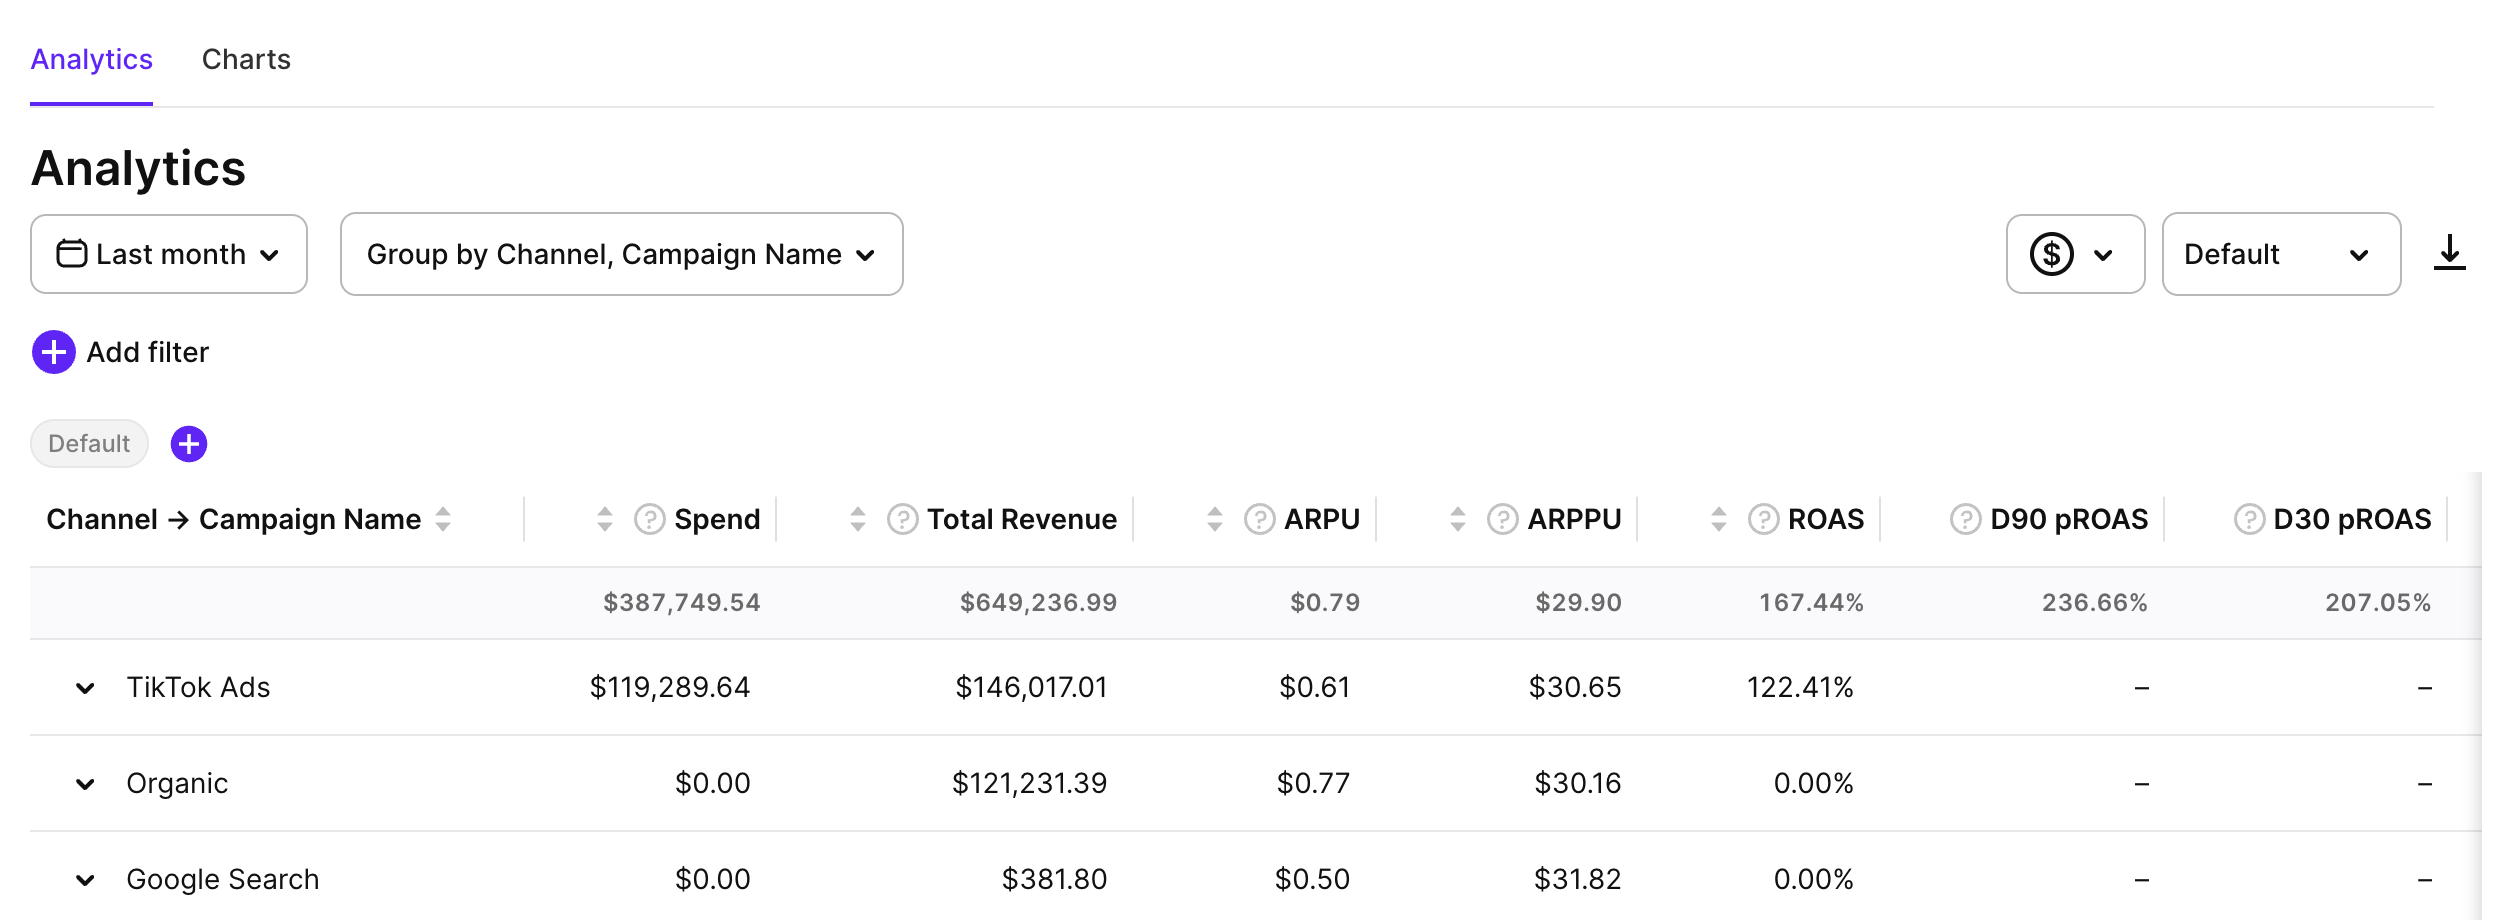
The Analytics section has two tabs:
- Analytics: A cohort-based table of your campaign metrics.
- Charts: Line charts for individual metrics over time.
Metrics
Adapty Attribution provides comprehensive metrics to measure campaign performance and user behavior. These metrics are available as standard values, with key metrics also offered as cohort metrics for time-based analysis of user groups.
See the complete metric list here.
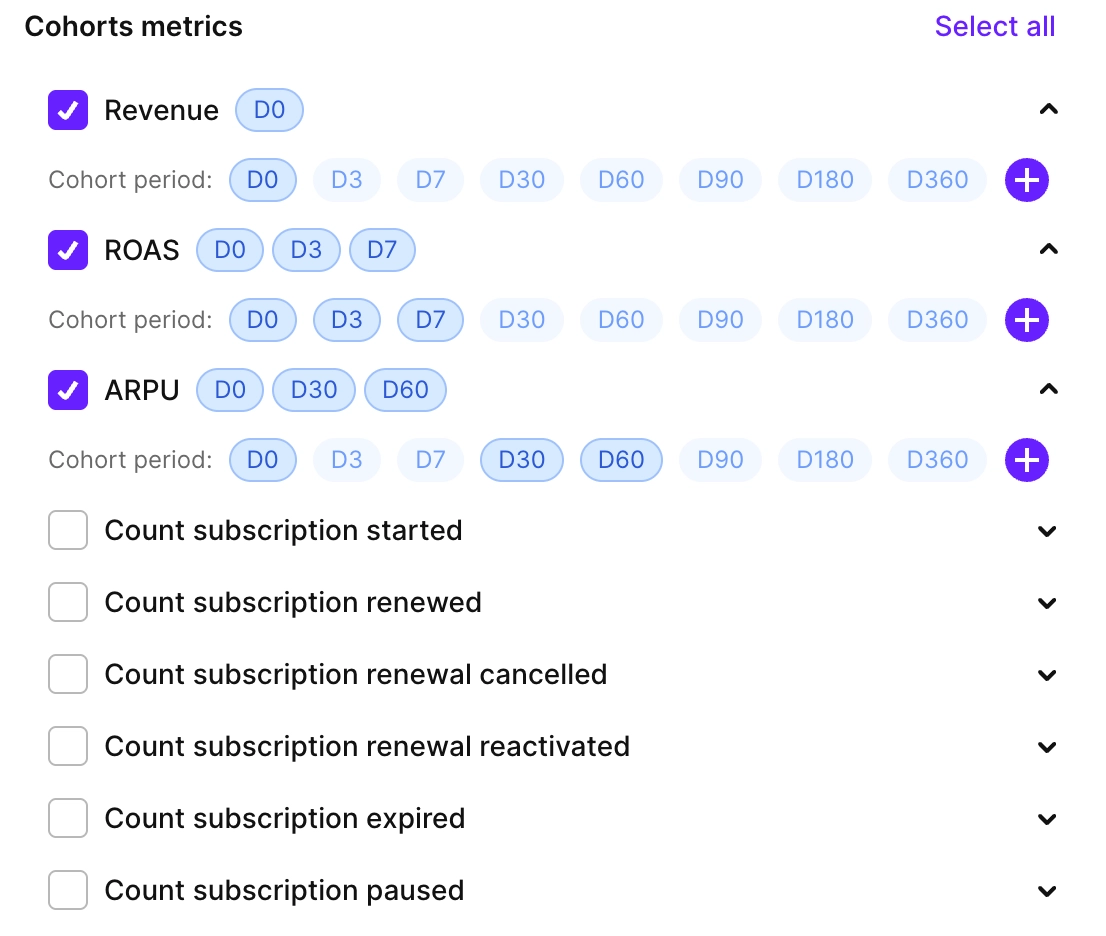
Customize which metrics to show
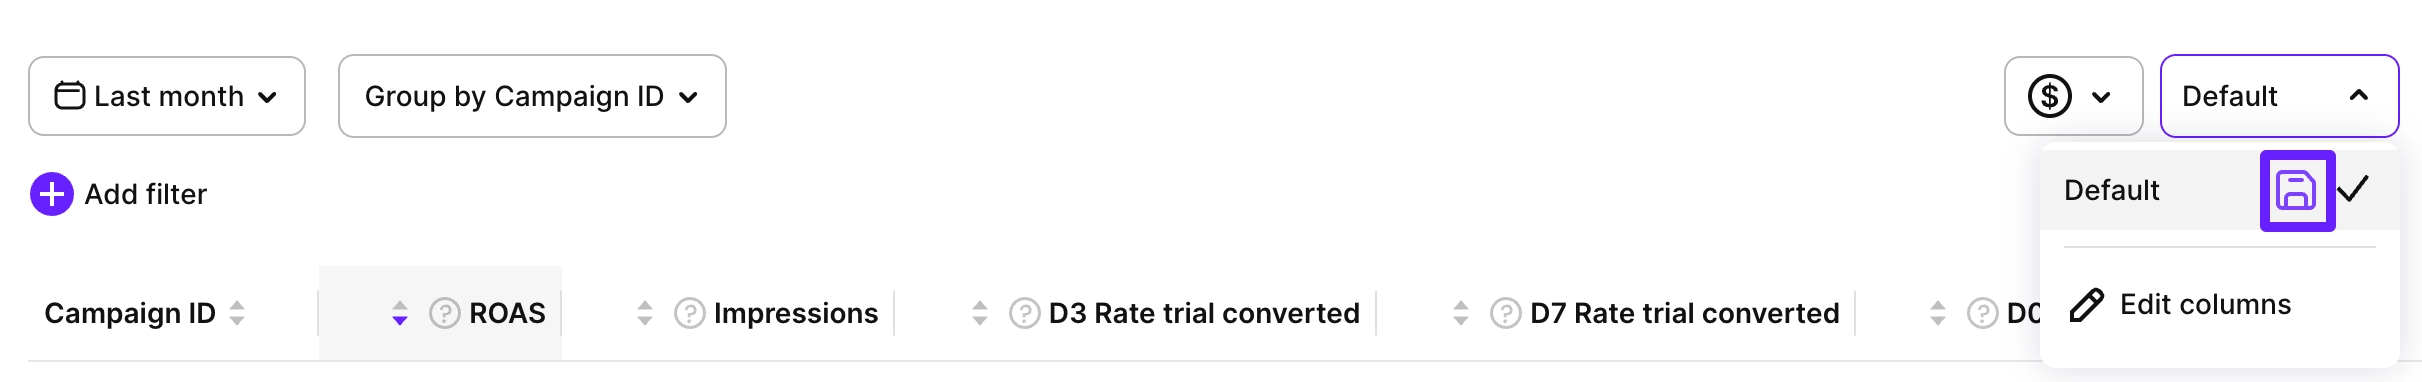
You can customize which metrics to show as well as their order. To do that, click the current present name (it’s Default at first) in the top-right corner, select Edit columns and then either remove charts you don’t need, add more or rearrange existing ones by drag and dropping.
For cohort metrics, you can add one or more cohorts at once. Select them from the existing cohorts or create custom ones.
You can also save views you use most as presets, so you can switch between them quickly anytime. Click the current preset name and click the Save icon or, in the Edit columns window, click Save as preset.
Controls
On the Analytics page, you have four main controls:
- Time ranges: See more.
- Filters: Filter by metrics, so you can see only those values that are above or below some threshold.
- Group by: Group by campaign parameters (like campaign ID or country) or time periods, so the results are better organized.
- Store commission and taxes: See more.
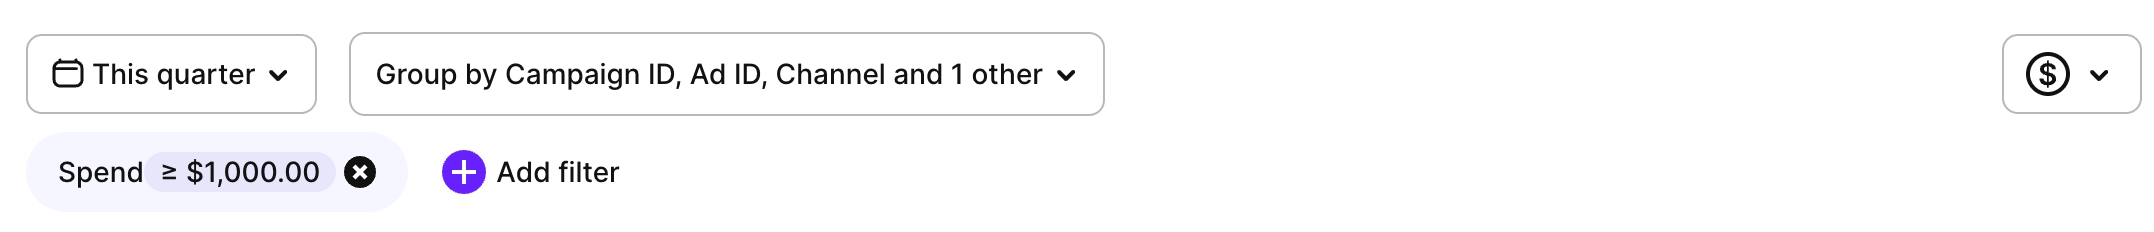
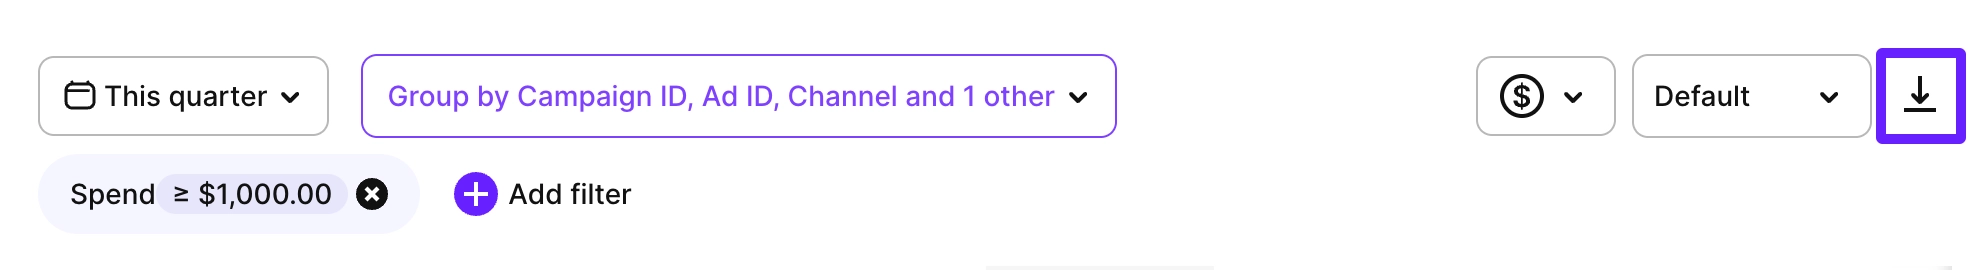
Filter sets
Filter sets let you save a group of filters and switch between them with a single click. Use them to keep the views you check most often, like “Campaigns above $1,000 spend” or “iOS only”.
Beneath the main filter controls, each saved filter set appears as a chip. Click a chip to apply its filters, or click the × on a chip to delete it. The active set is highlighted.
To save the current filters as a new set:
- Set up the filters you want to save.
- Click + at the end of the filter sets row.
- Enter a name and click Save.
ua-filter-sets.gifCharts
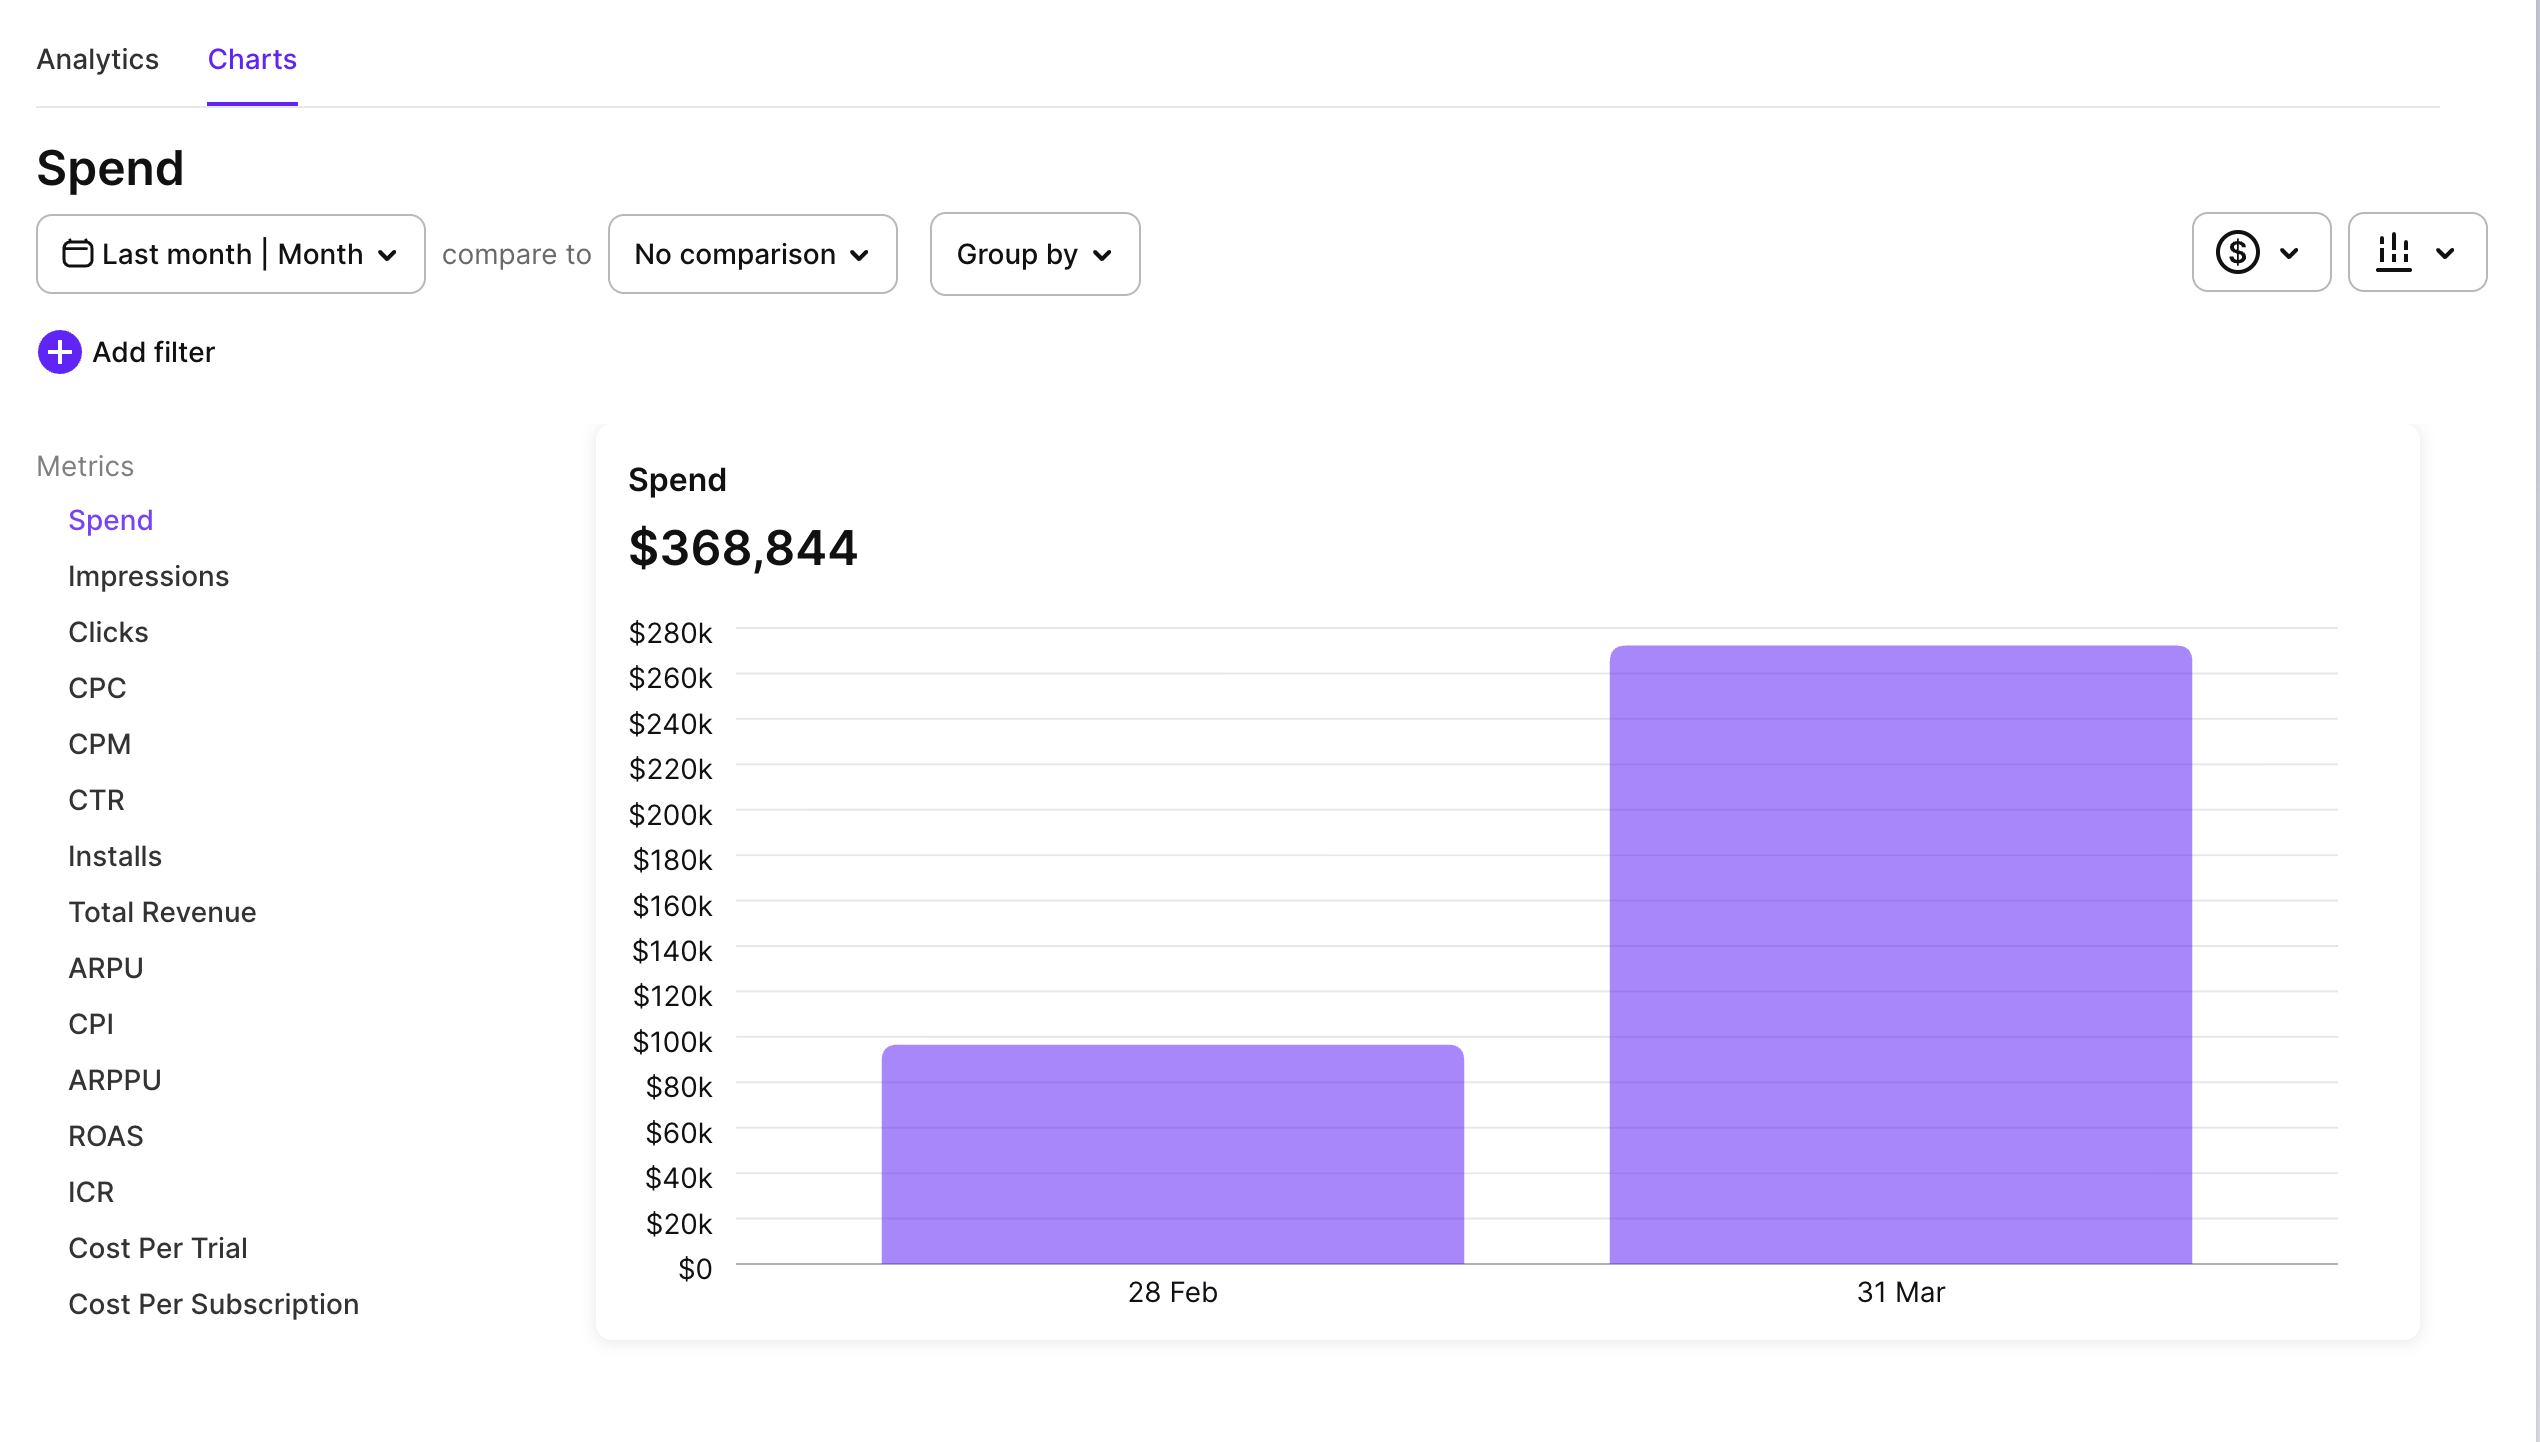
The Charts tab shows a line chart for a single metric over the selected time range. Use the left navigation to switch between metrics.
Available chart metrics:
- Spend
- Impressions
- Clicks
- CPC
- CPM
- CTR
- Installs
- Total Revenue
- ARPU
- CPI
- ARPPU
- ROAS
- ICR
- Cost Per Trial
- Cost Per Subscription
The same time range, group by, filters, and filter sets apply on both the Analytics and Charts tabs.
Export data
To analyze the raw data behind analytics, you can export it in CSV format by clicking the Export button.