Analytics overview page
The Overview page displays combined metrics for all your apps in one place. It’s the dashboard homepage and is also available from the left-side menu. To view data for a single app, open an individual chart instead.
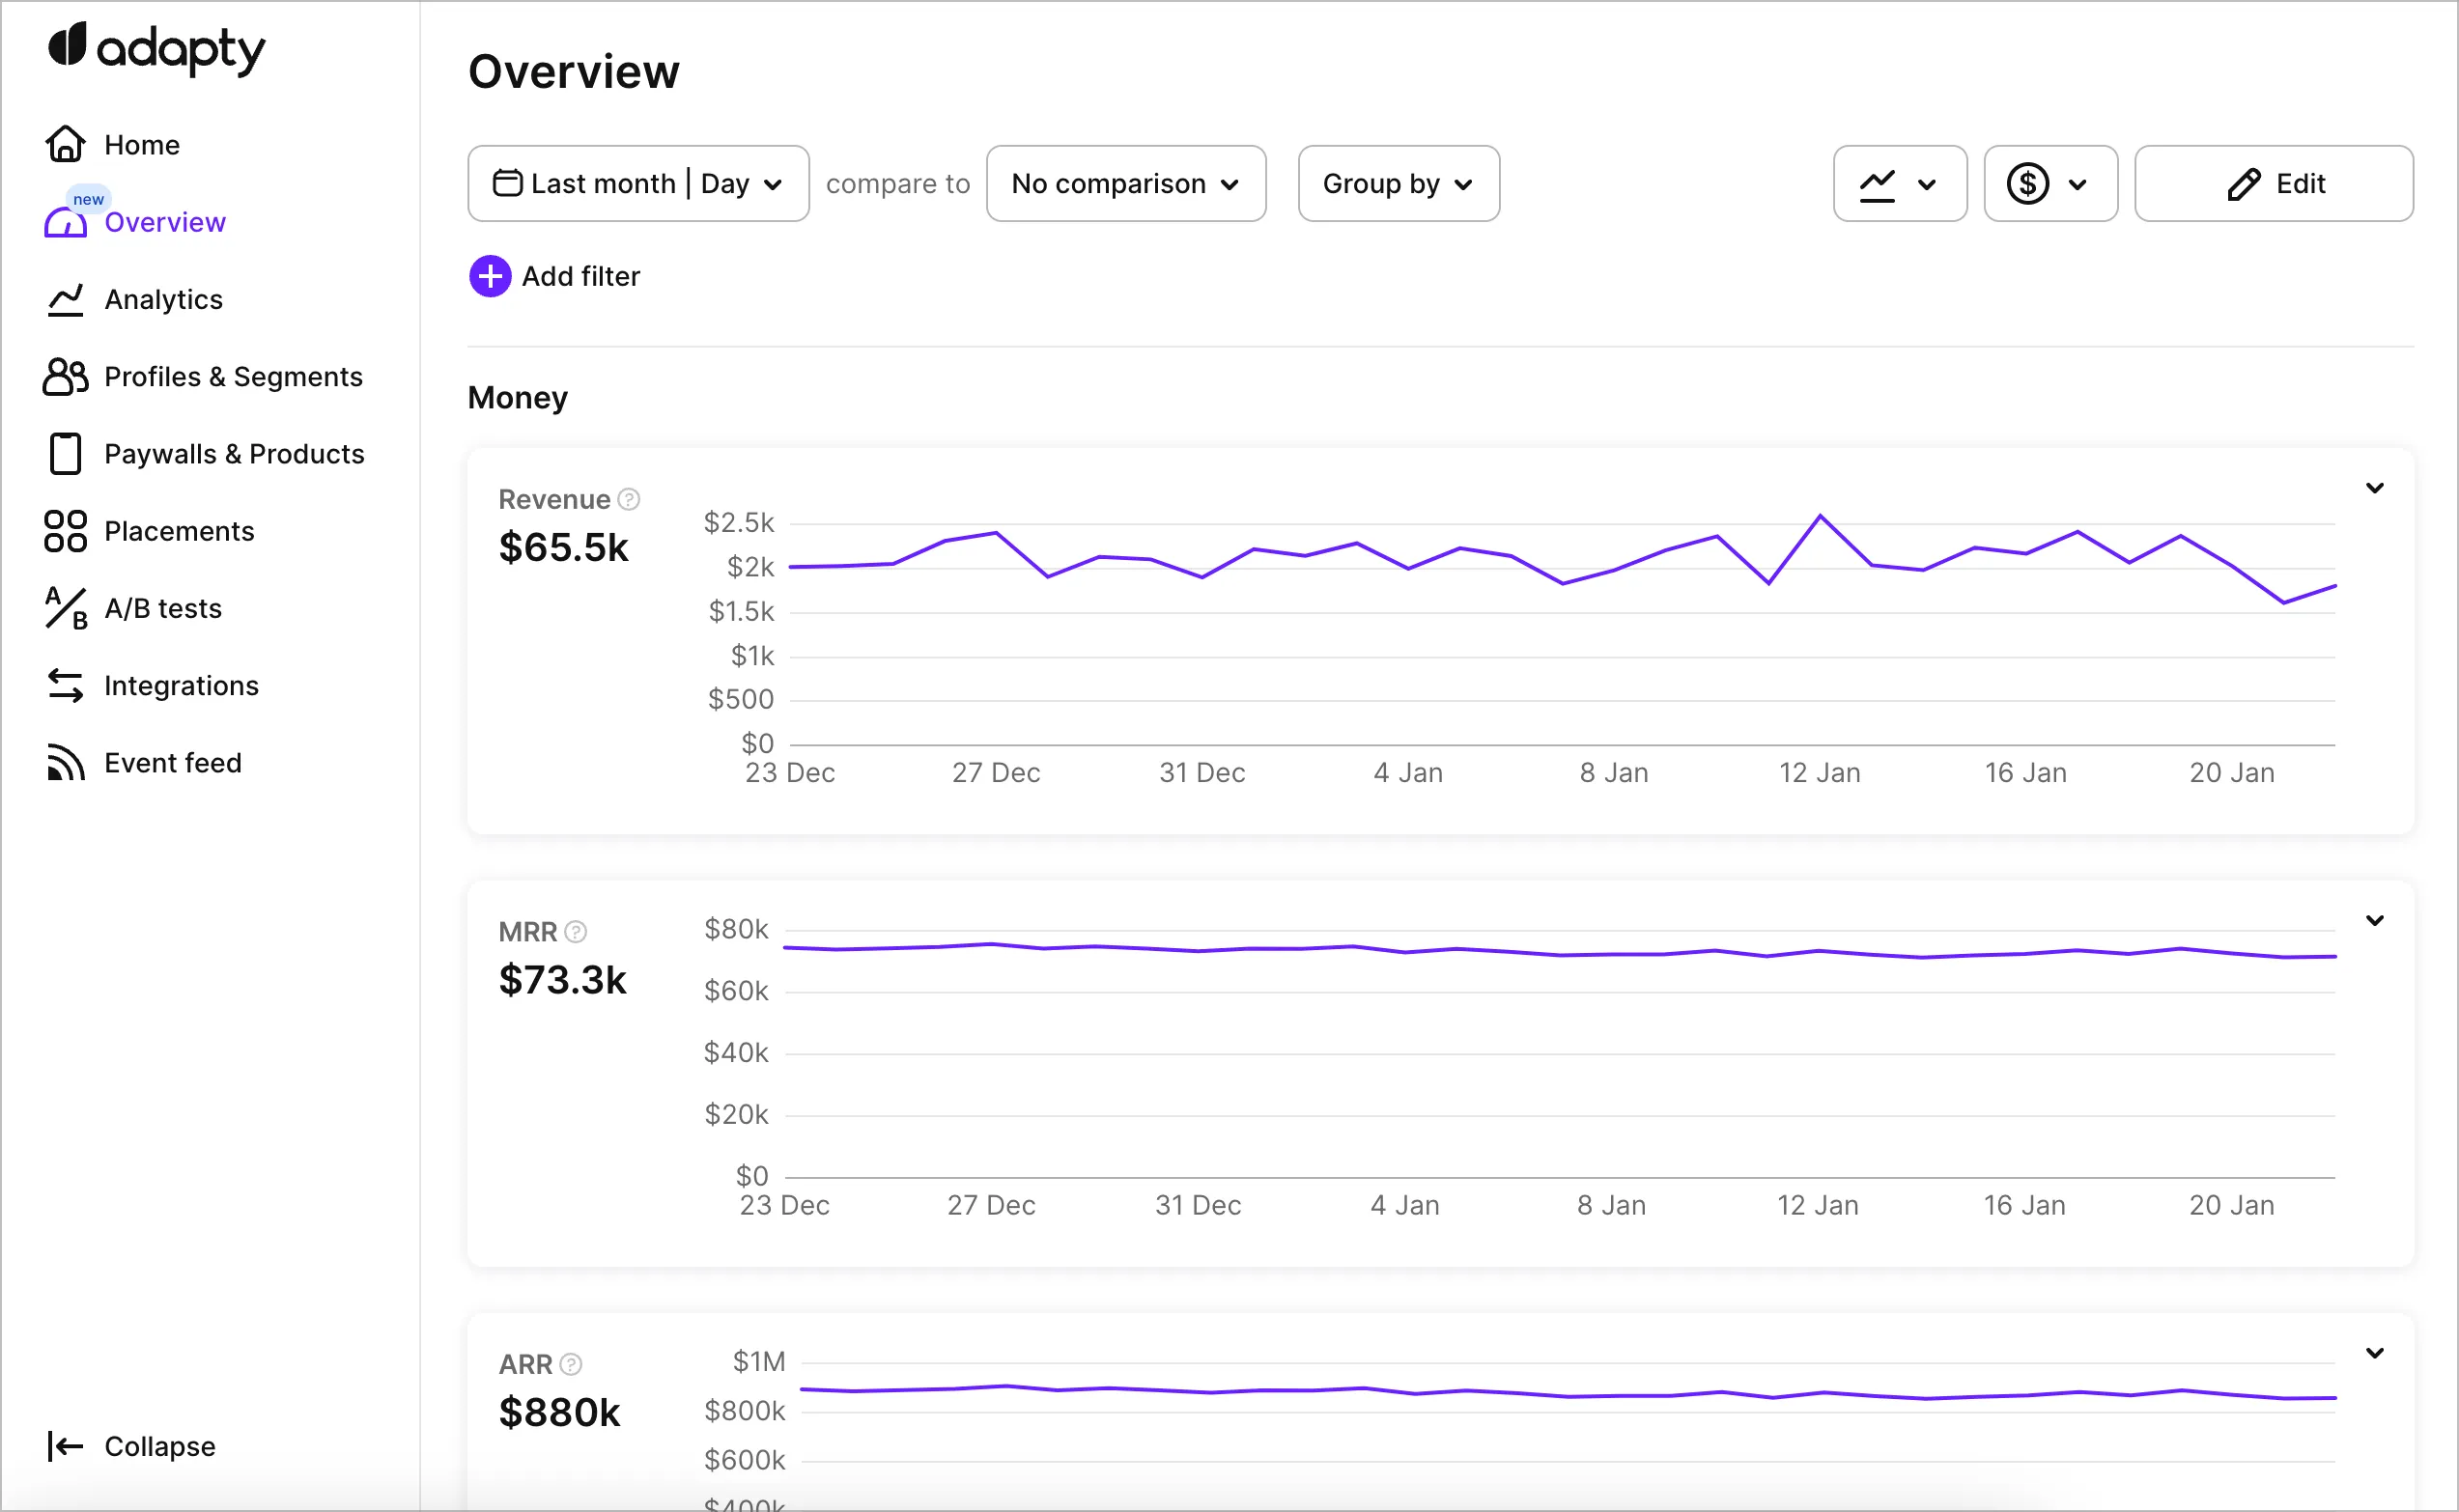
Charts
Overview displays a customizable subset of Adapty’s analytics charts. For descriptions and a side-by-side comparison of every available chart, see the Metric comparison table.
To customize which charts appear and in what order, click Edit in the top-right corner. From there you can remove, add, or reorder charts:
The following charts are available:
- Revenue
- MRR
- ARR
- ARPU
- ARPPU
- ARPAS
- Installs
- New trials
- New subscriptions
- Active trials
- Active subscriptions
- New non-subscriptions
- Refund events
- Refund money
- Subscriptions renewal canceled
- Conversion rate from Install to Trial, Install to Paid, and Trial to Paid
Controls
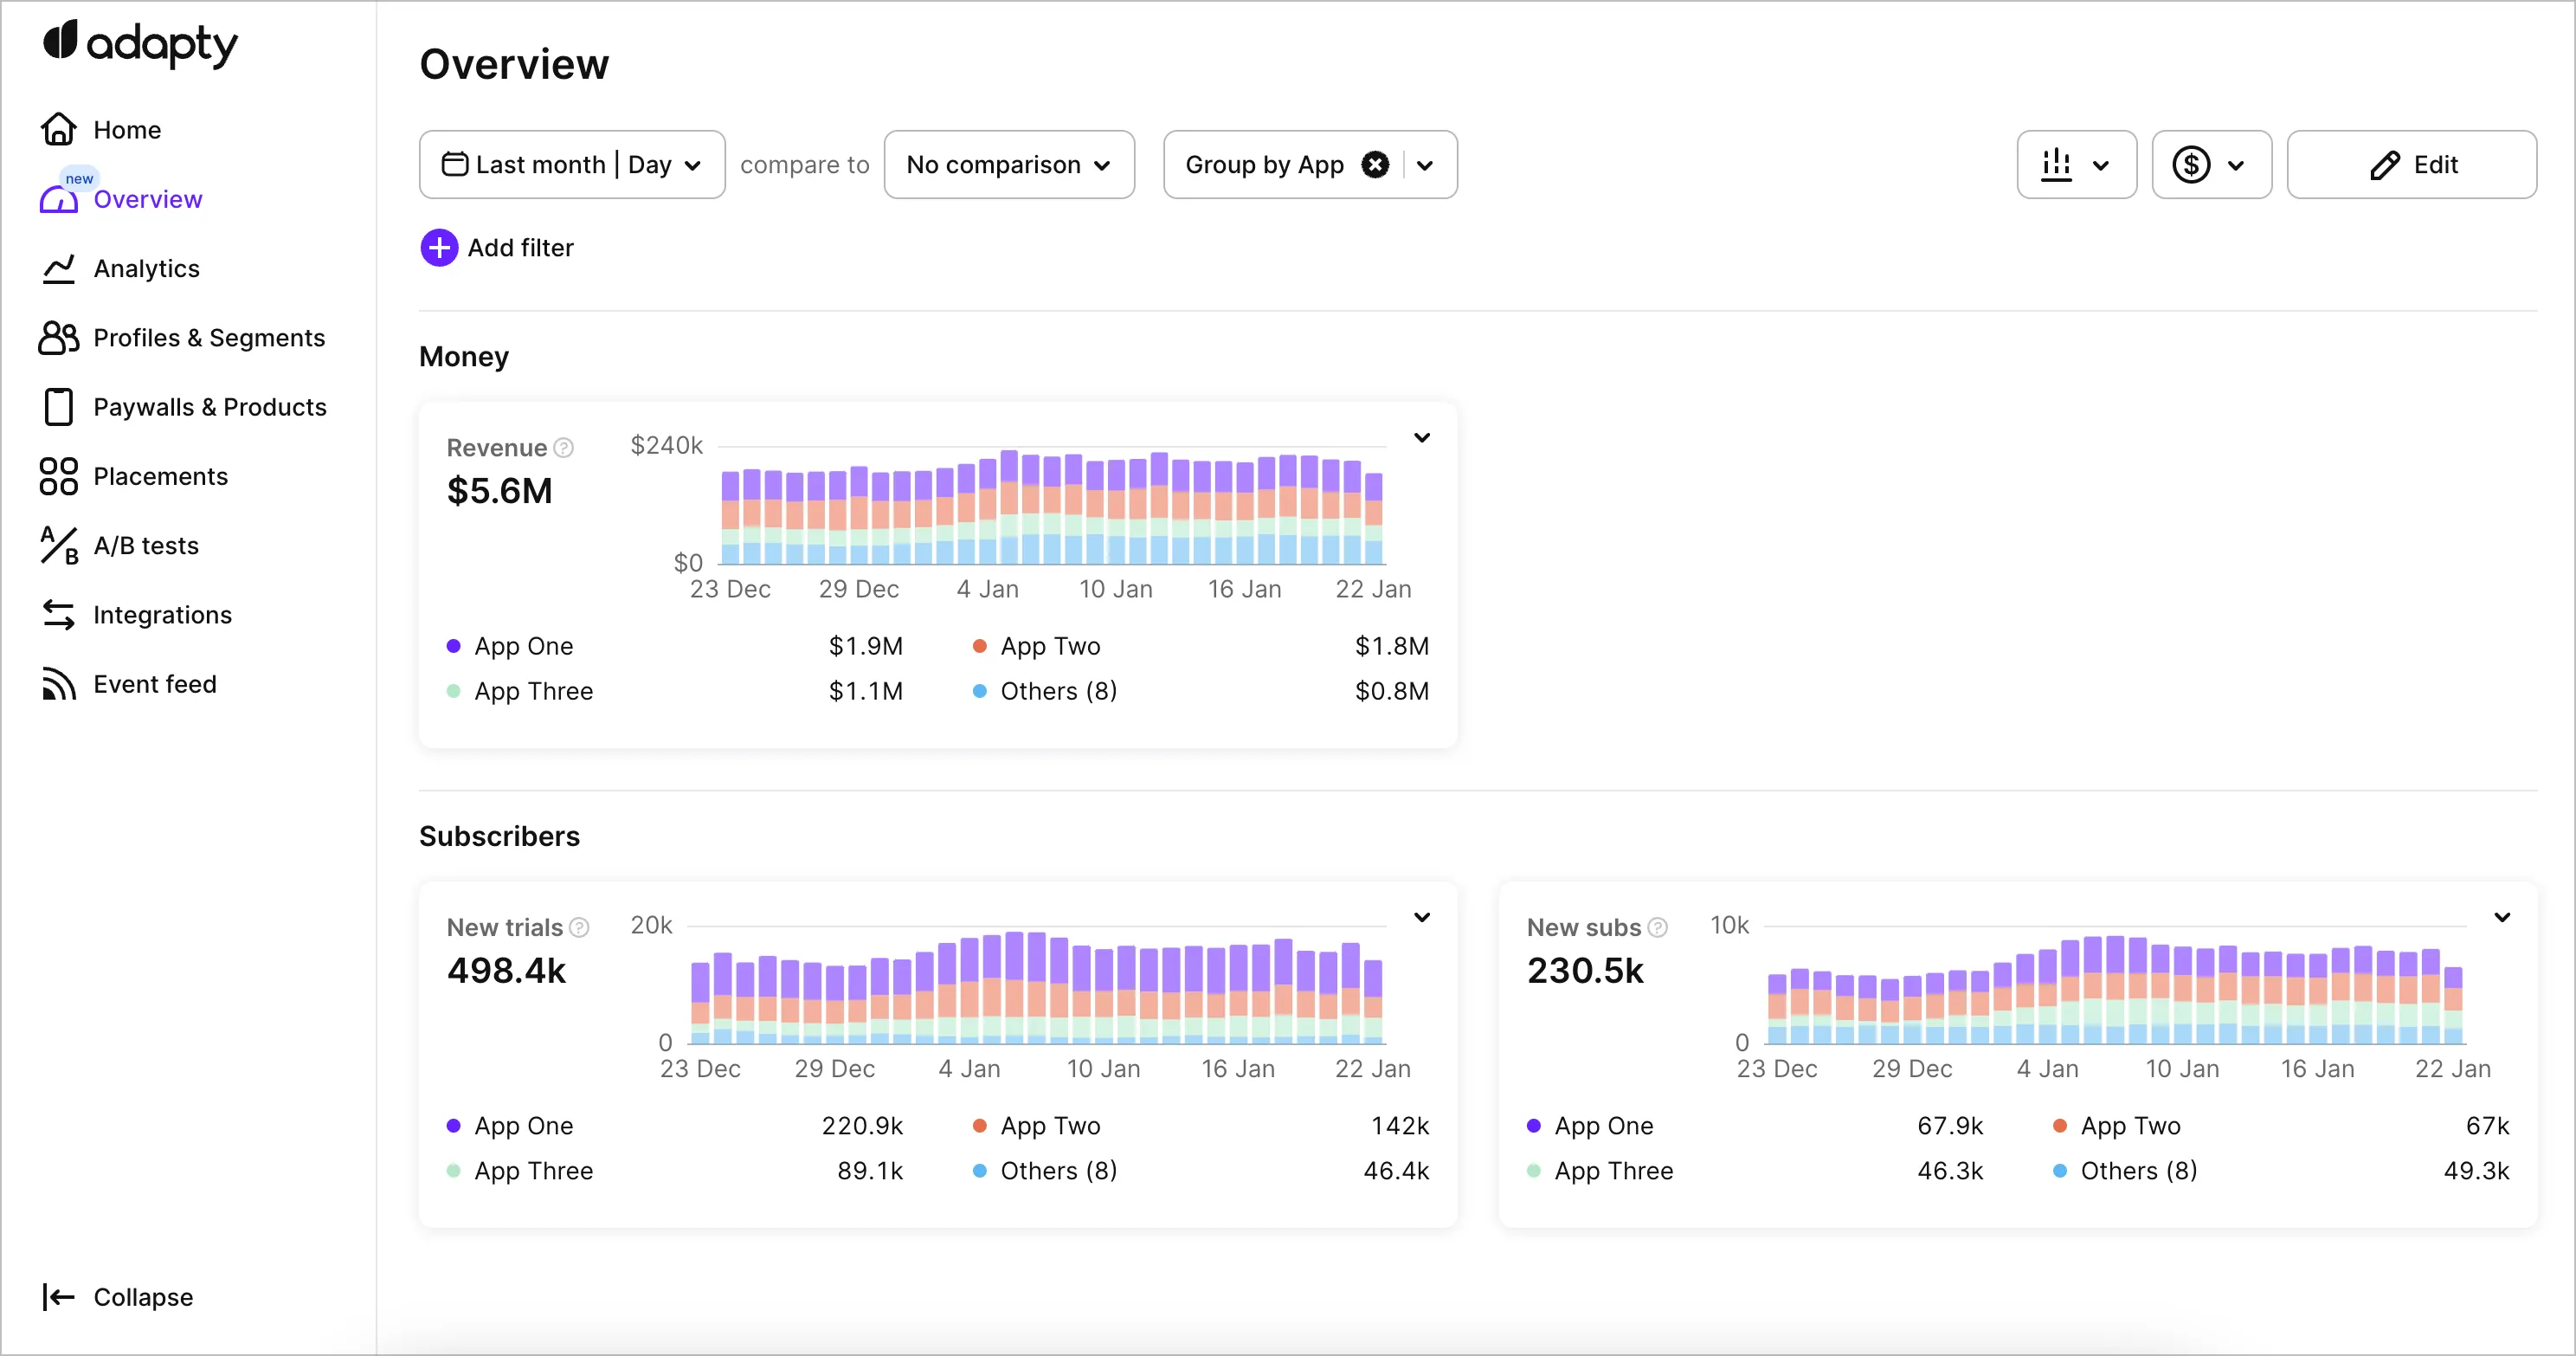
The Overview page supports most analytics controls, including filtering, grouping, and time-period comparison.
The one capability unique to Overview is grouping and filtering by app. Since the page combines data from all your apps, the per-app view shows how each app contributes to your business metrics:
Install count and timezone
Overview combines data from all your apps using its own timezone and install-counting settings — the per-app values don’t apply here.
- Installs: choose how to count installs. By device installations treats each install on a device — including reinstalls — as separate. By unique users counts only the first install per identified user. To change the setting, click Edit Metrics and select a different option from the dropdown.
- Timezone: To change Overview’s timezone, click Edit Metrics, and select a timezone from the dropdown. This is particularly useful if different apps in your account use different timezones.