Lifetime Value (LTV)
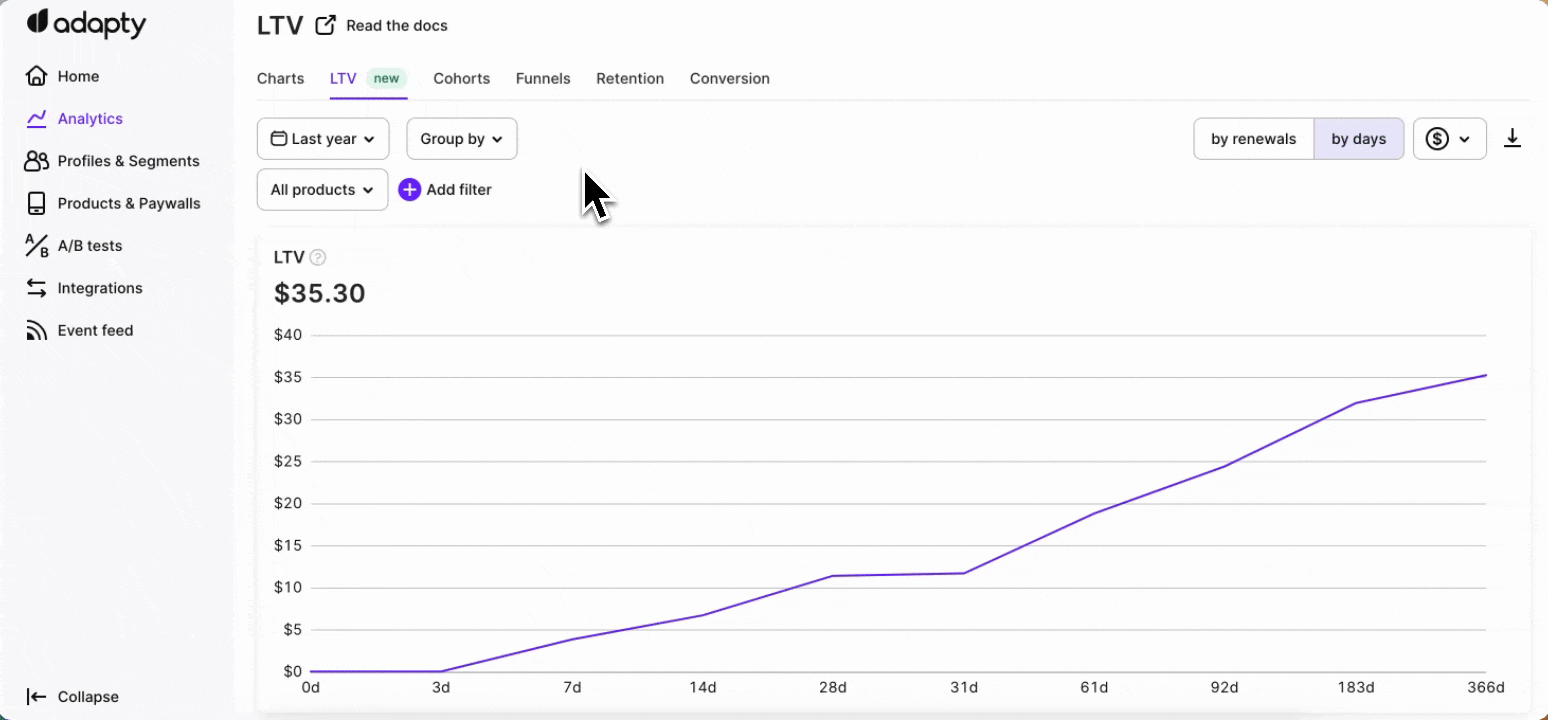
The Realized LTV (Lifetime value) per paying customer displays the revenue that a paying customer cohort actually generated after refunds have been deducted, divided by the number of paying customers in that cohort. Therefore, this chart tells you how much revenue you generate on average from each paying customer.
Adapty designs the LTV chart to answer several important questions about your app’s revenue and customer behavior such as:
- How much money does each cohort bring in over their lifetime with your app?
- At what point in time does a cohort pay off?
- How can you optimize your app’s marketing and acquisition spend to attract valuable, high LTV customers?
- How long does it take to recoup your investment in acquiring new customers?
The LTV chart works with the app data we gather through our SDK and in-app events.
With this information, you will be able to gain insights into how your subscriptions are performing and how much revenue is generated from your subscribers during a given period of time. You can use this information to make informed decisions about your subscription offerings, ad spending, and customer acquisition strategies. Additionally, the filters will allow you to segment the data by country, attribution, and other variables, giving you a more granular understanding of your customer base.
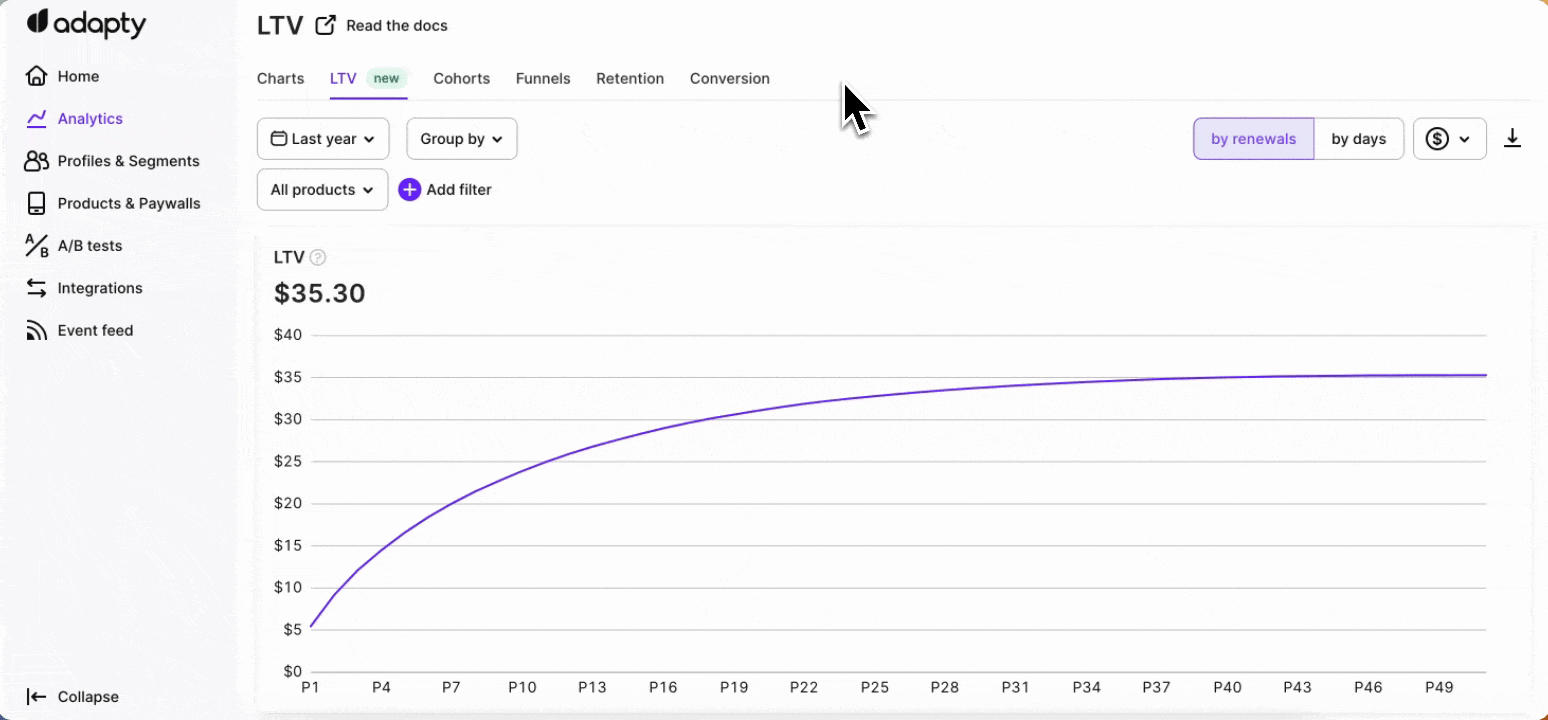
LTV by renewals
The LTV by renewals view presents data pertaining to the subscription period (P), specifically capturing the first instance when a customer makes a payment. In the case of a weekly subscription, this corresponds to the subsequent weekly subscription period.
LTV by days
The LTV by days view organizes and filters data based on daily, weekly, or monthly intervals. It provides insights into the total revenue generated by all users who installed the app on a specific day, week, or month, divided by the number of paying users during that same period. This view offers valuable insights into revenue tracking and enables a comprehensive understanding of user behavior over time.
Cohort length and time frame
Two time settings control what the table shows:
- Time frame — the date range. Set it in the calendar above the table.
- Cohort length — how big each row is: day, week, month, quarter, or year. With a monthly length, each row covers one month of installs.
The two work separately. For example: a 6-month time frame plus a monthly cohort length gives you a table with 6 rows. A 1-year time frame plus a weekly cohort length gives you 52 rows.
Calculation
Realized LTV is calculated using the total revenue generated from each customer cohort, minus refunds.
LTV for the day/week/month = Revenue gained from all the paying users who installed the app on this day/week/month / the number of paying users who installed the app on this day/week/month
The LTV calculation includes upgrades, downgrades, and reactivations, such as when a user changes their subscription plan or pricing. It takes into account the revenue generated from the initial subscription and subsequent renewals based on the updated plan.
Available grouping and filtering
Main article: Analytics controls
Both filters and groupings can be applied to both the renewals and days views of the LTV chart, allowing you to drill down into specific cohorts and understand their behavior over time
- ✅ Filter by: Attribution, Audience, Country, Paywall, A/B tests, Placement, Segment, Store, Product, and Duration.
- ✅ Group by: Product, Country, Store, Duration, Segment, and Cohort (Day, Week, Month, or Year).
The Realized LTV chart in Adapty helps to gain valuable insights into customer behavior, optimize marketing strategies, track revenue performance, and make data-driven decisions to maximize the long-term value of their customers.