Analytics in Adapty Ads Manager
Ads Manager is a section of the Adapty Ads Manager dashboard that lets you see all key metrics in one place and organize them by apps, campaigns, ad groups, keywords, and search terms. You can customize which metrics you see and view data for all your campaigns at once.
Structure overview
In Adapty Ads Manager, you can evaluate how your ads perform on several levels.
Campaigns
On the Campaigns tab, you can see all the metrics grouped by campaigns.
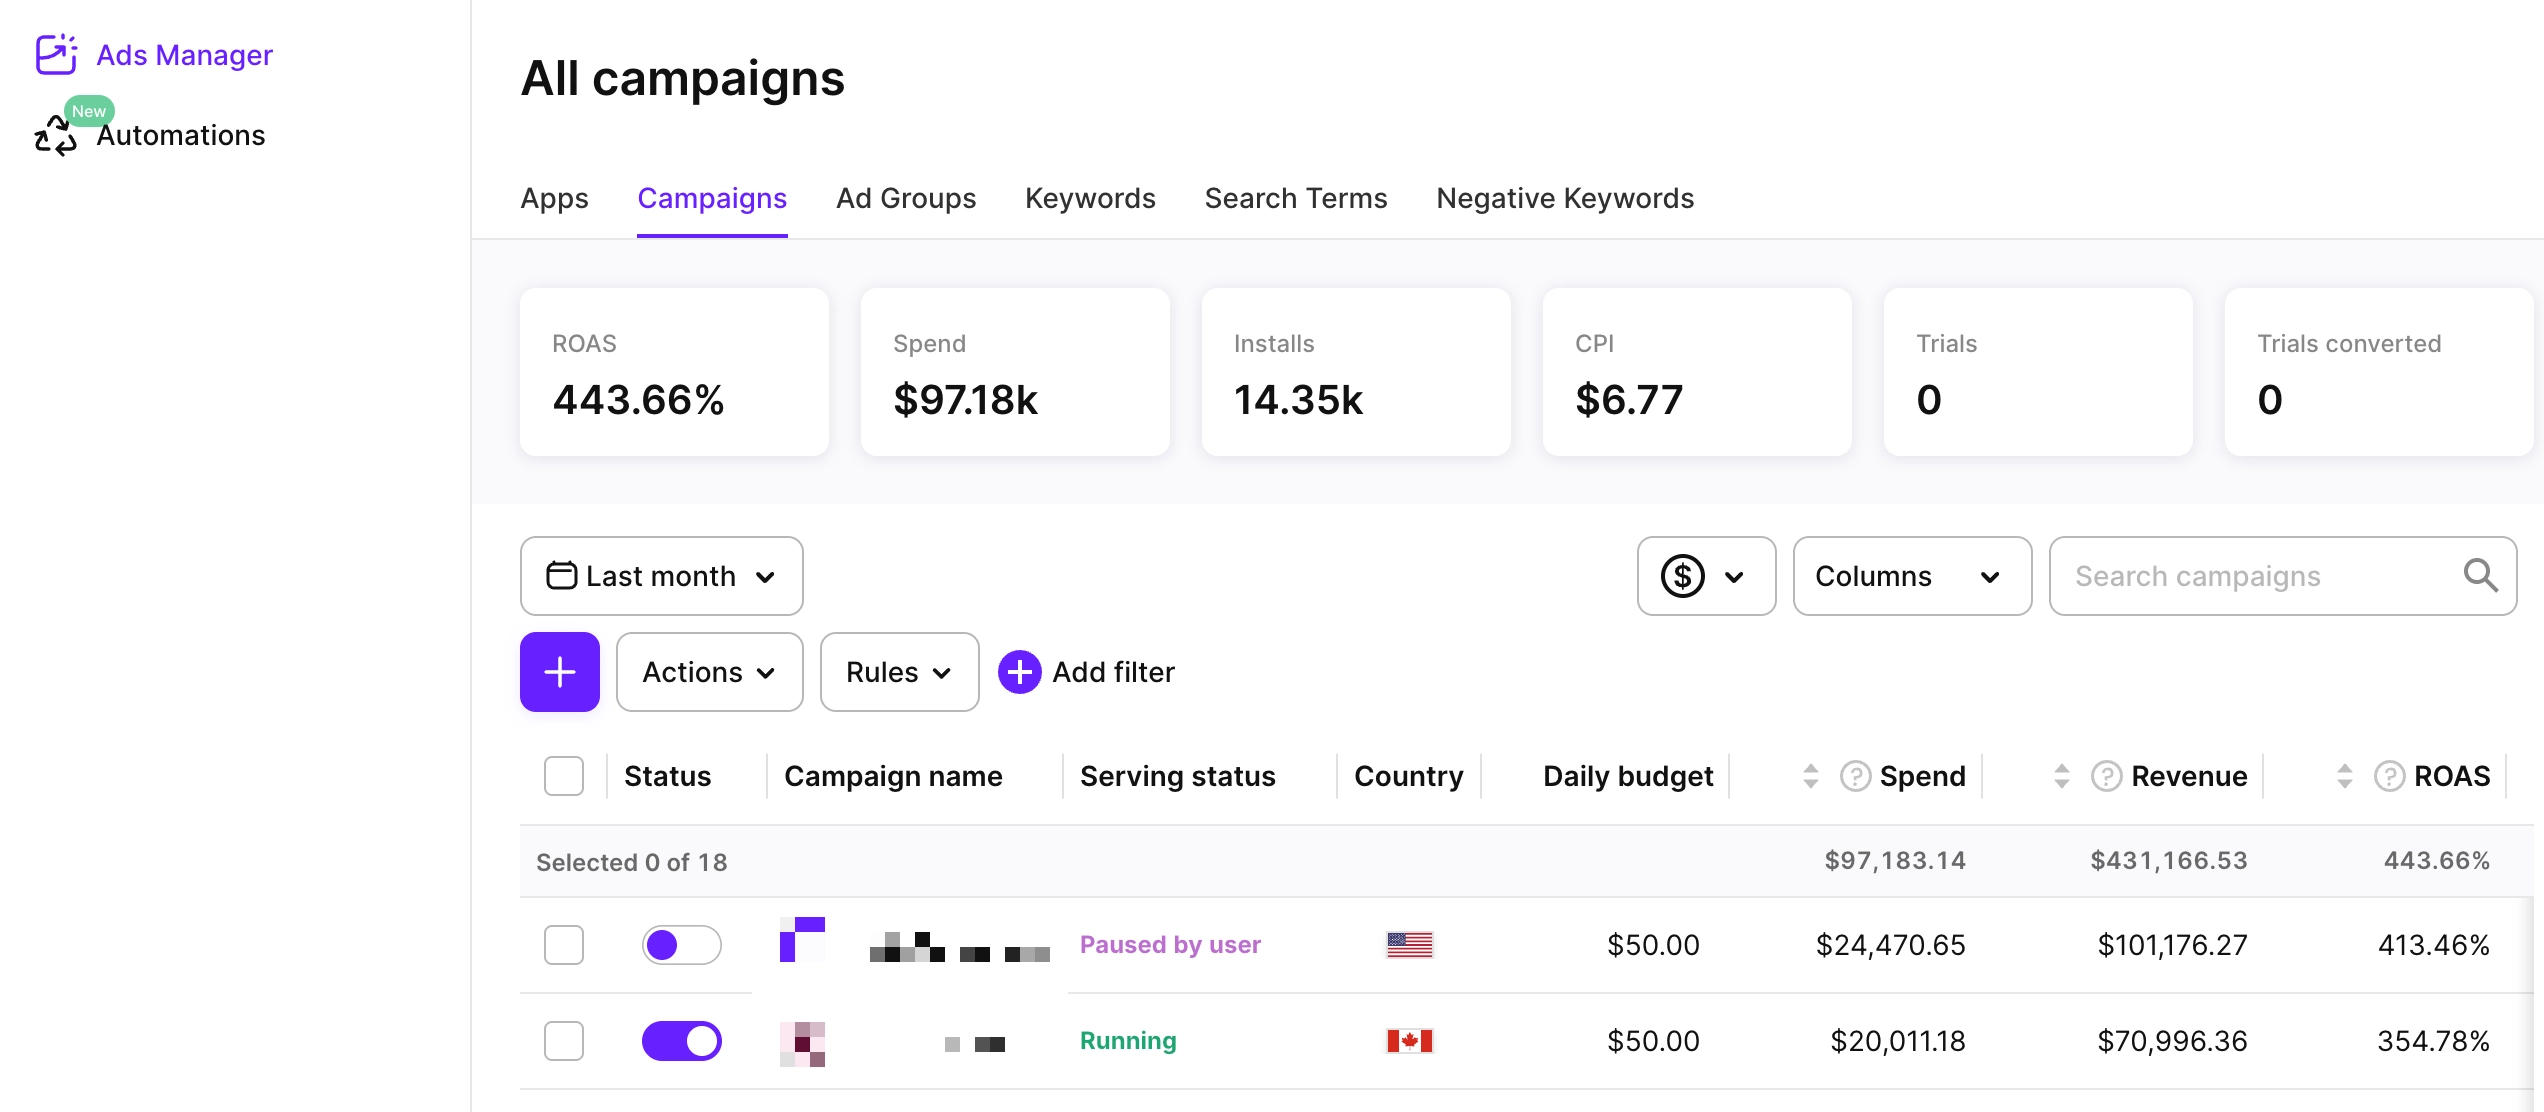
Click a campaign name to dive into its details.
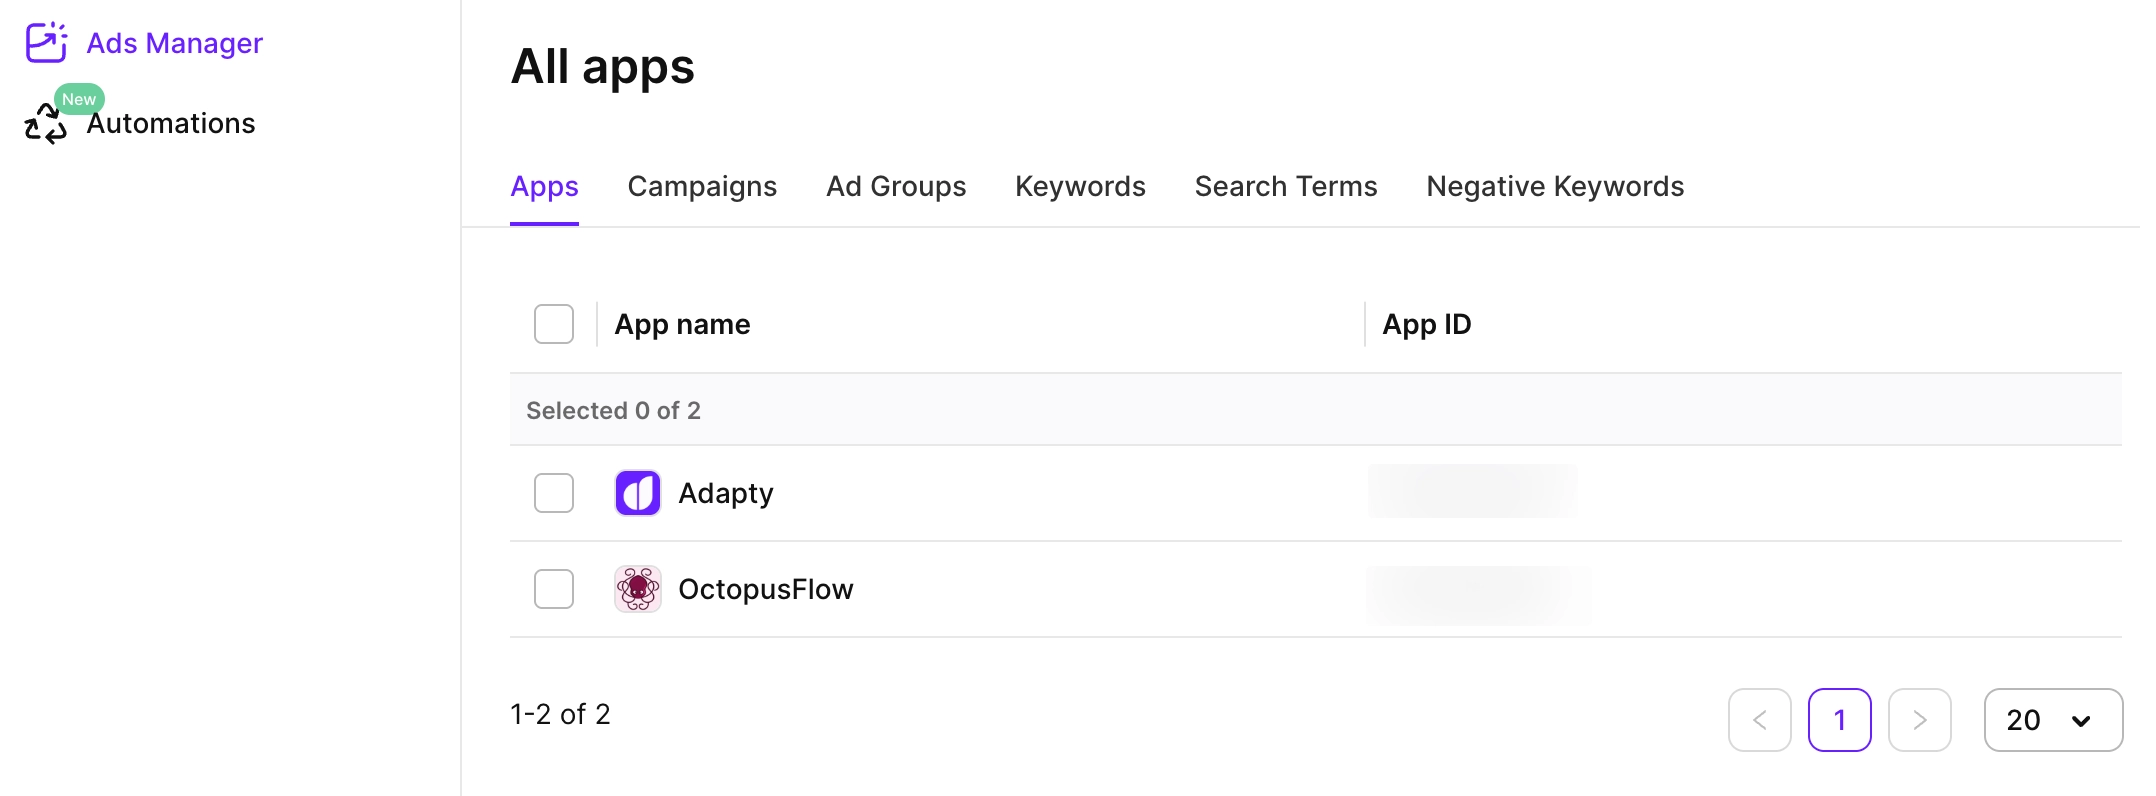
Apps
On the Apps tab, you can see a list of your apps.
Click an app name to see the campaign metrics for this app.
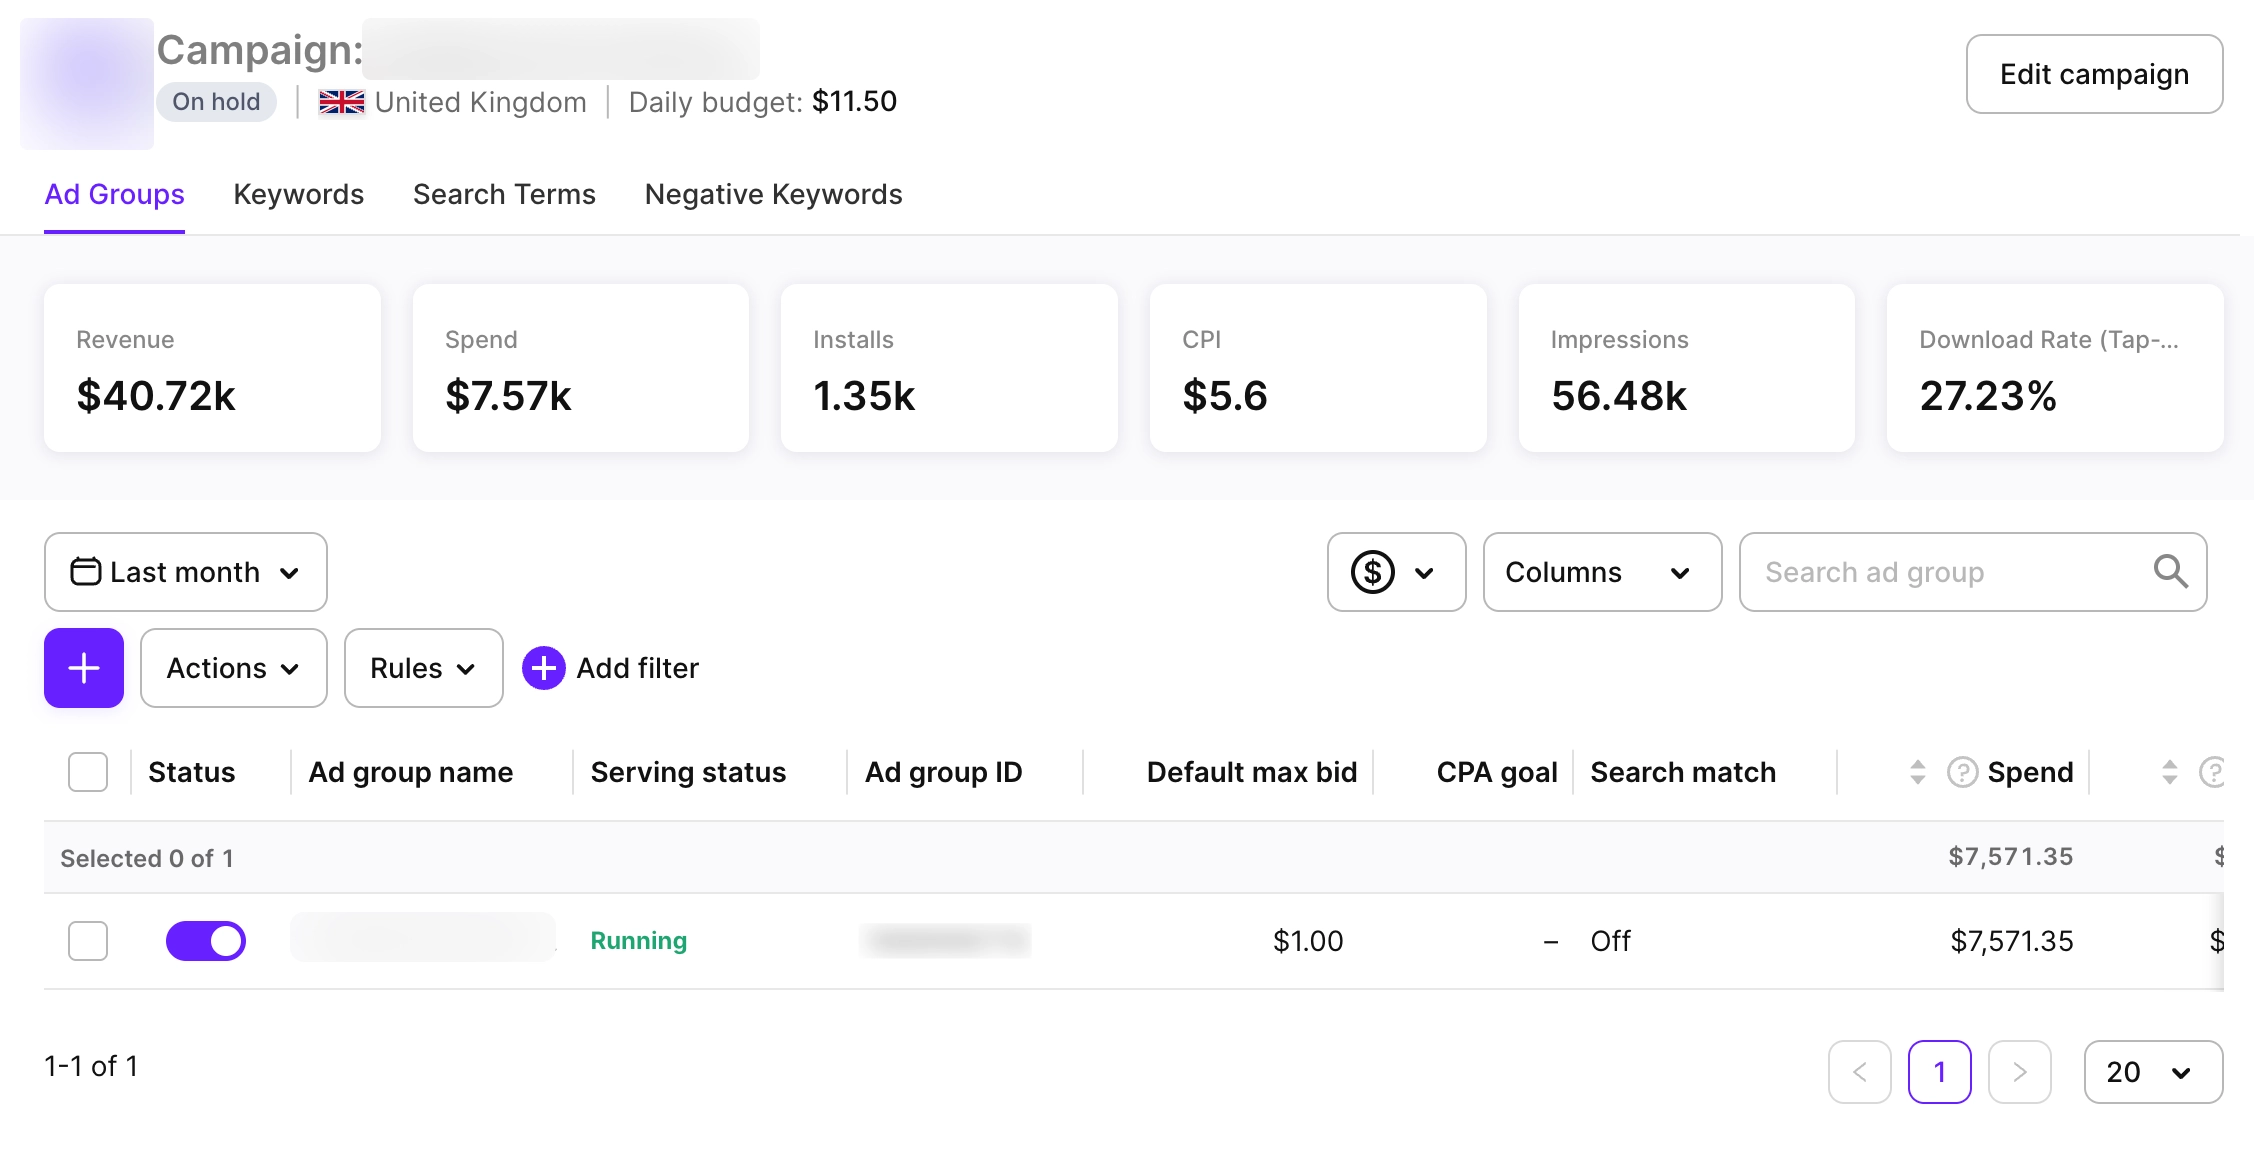
Ad groups
On the Ad groups tab, you can see all the metrics grouped by ad groups.
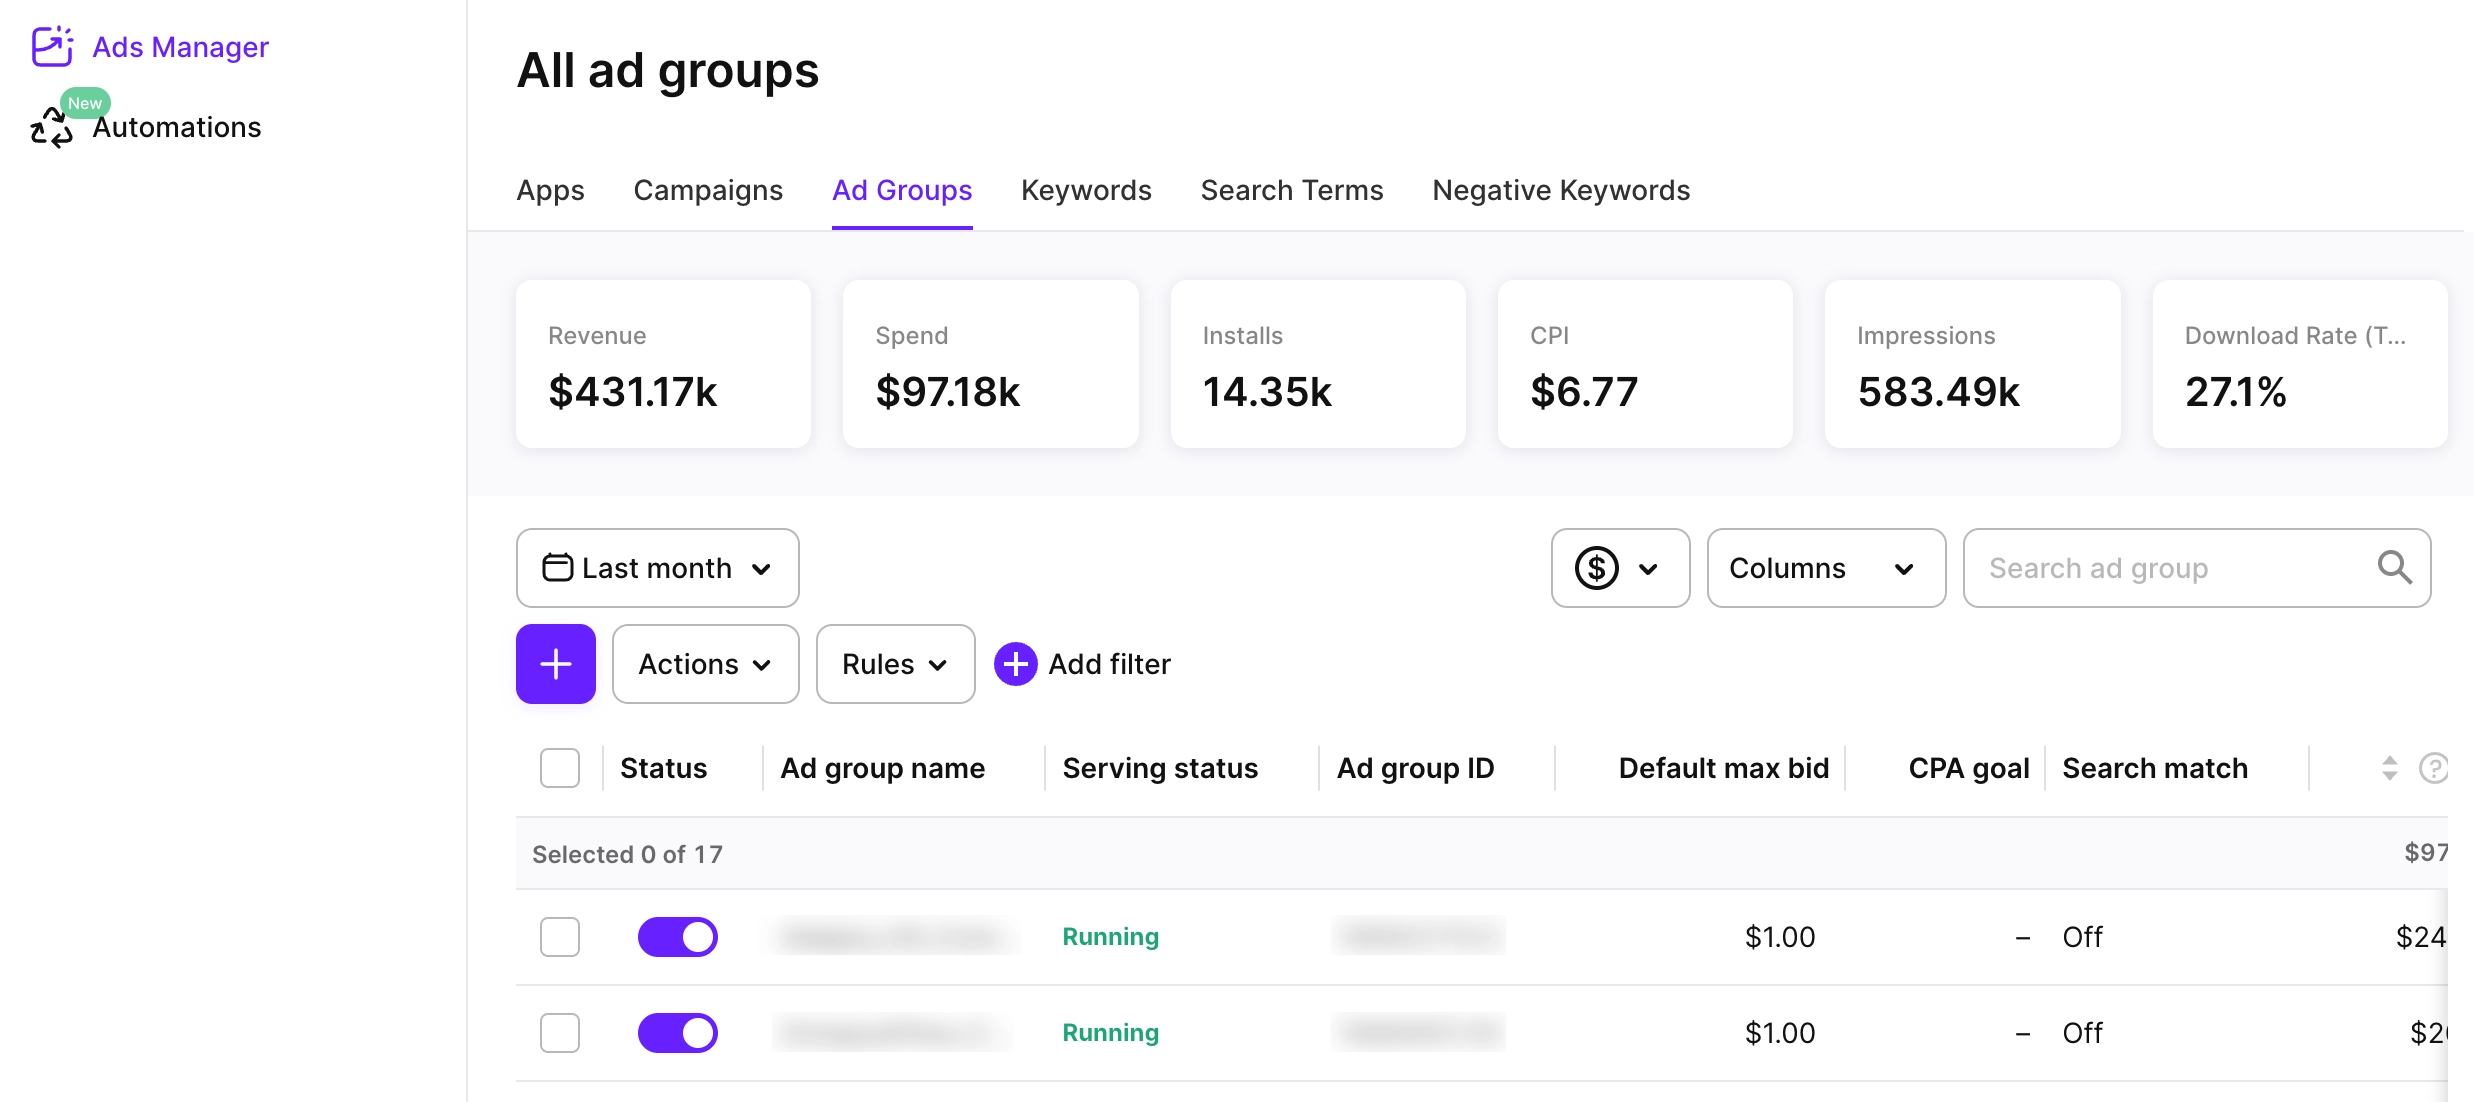
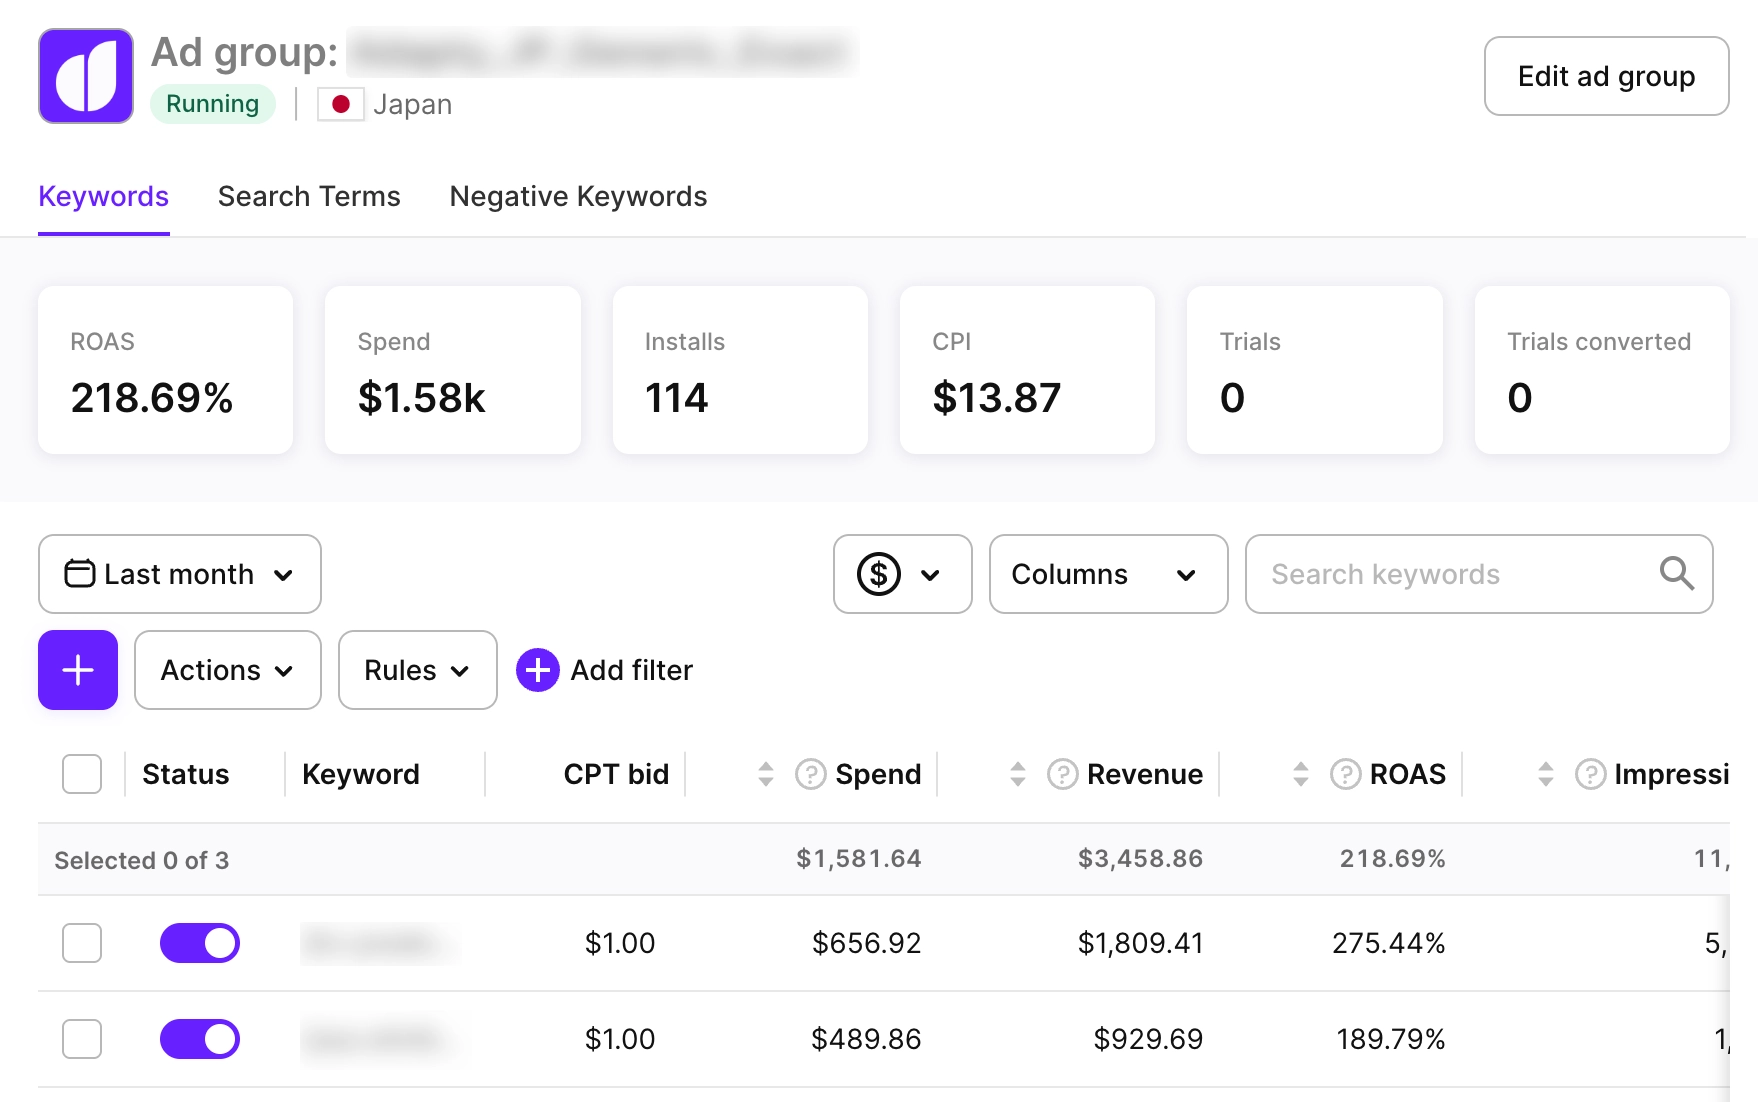
Click an ad group name to dive into its details.
Keywords
On the Keywords tab, you can see all the metrics grouped by keywords.
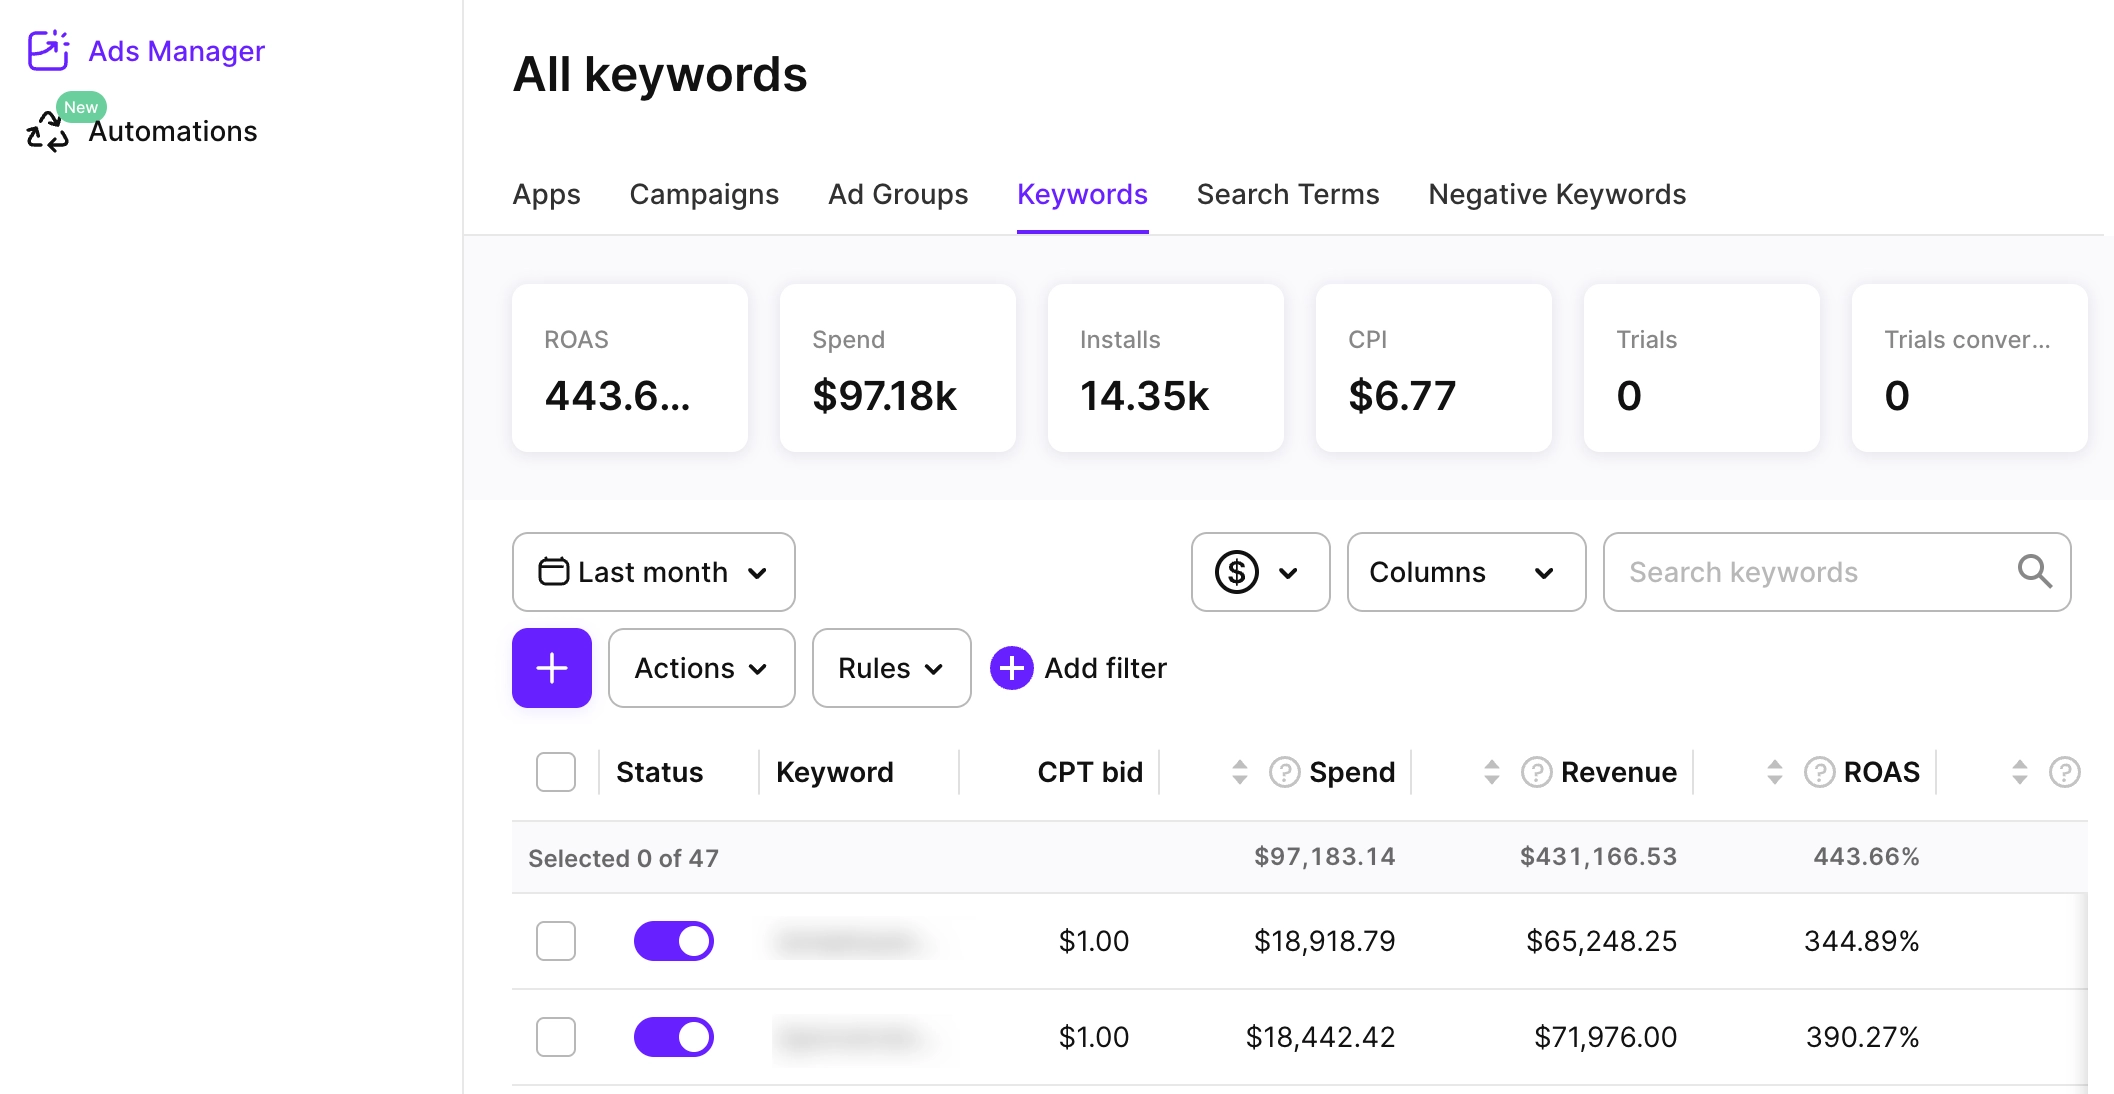
Click a keyword to see the associated search terms.
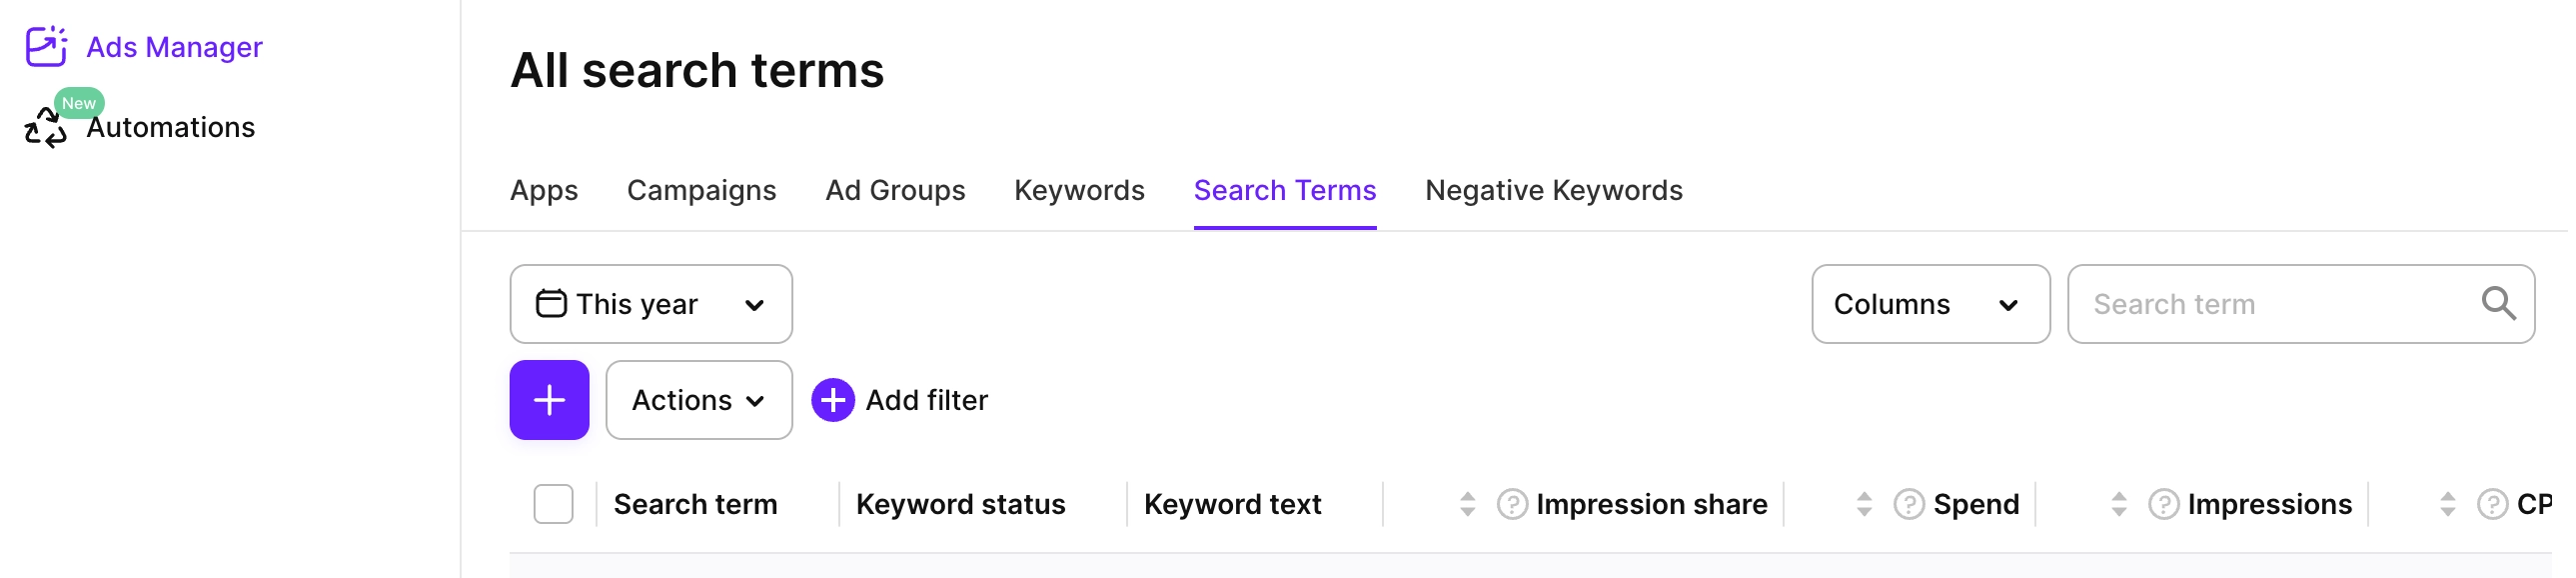
Search terms
On the Search terms tab, you can see all the metrics grouped by search terms and their associated keywords.
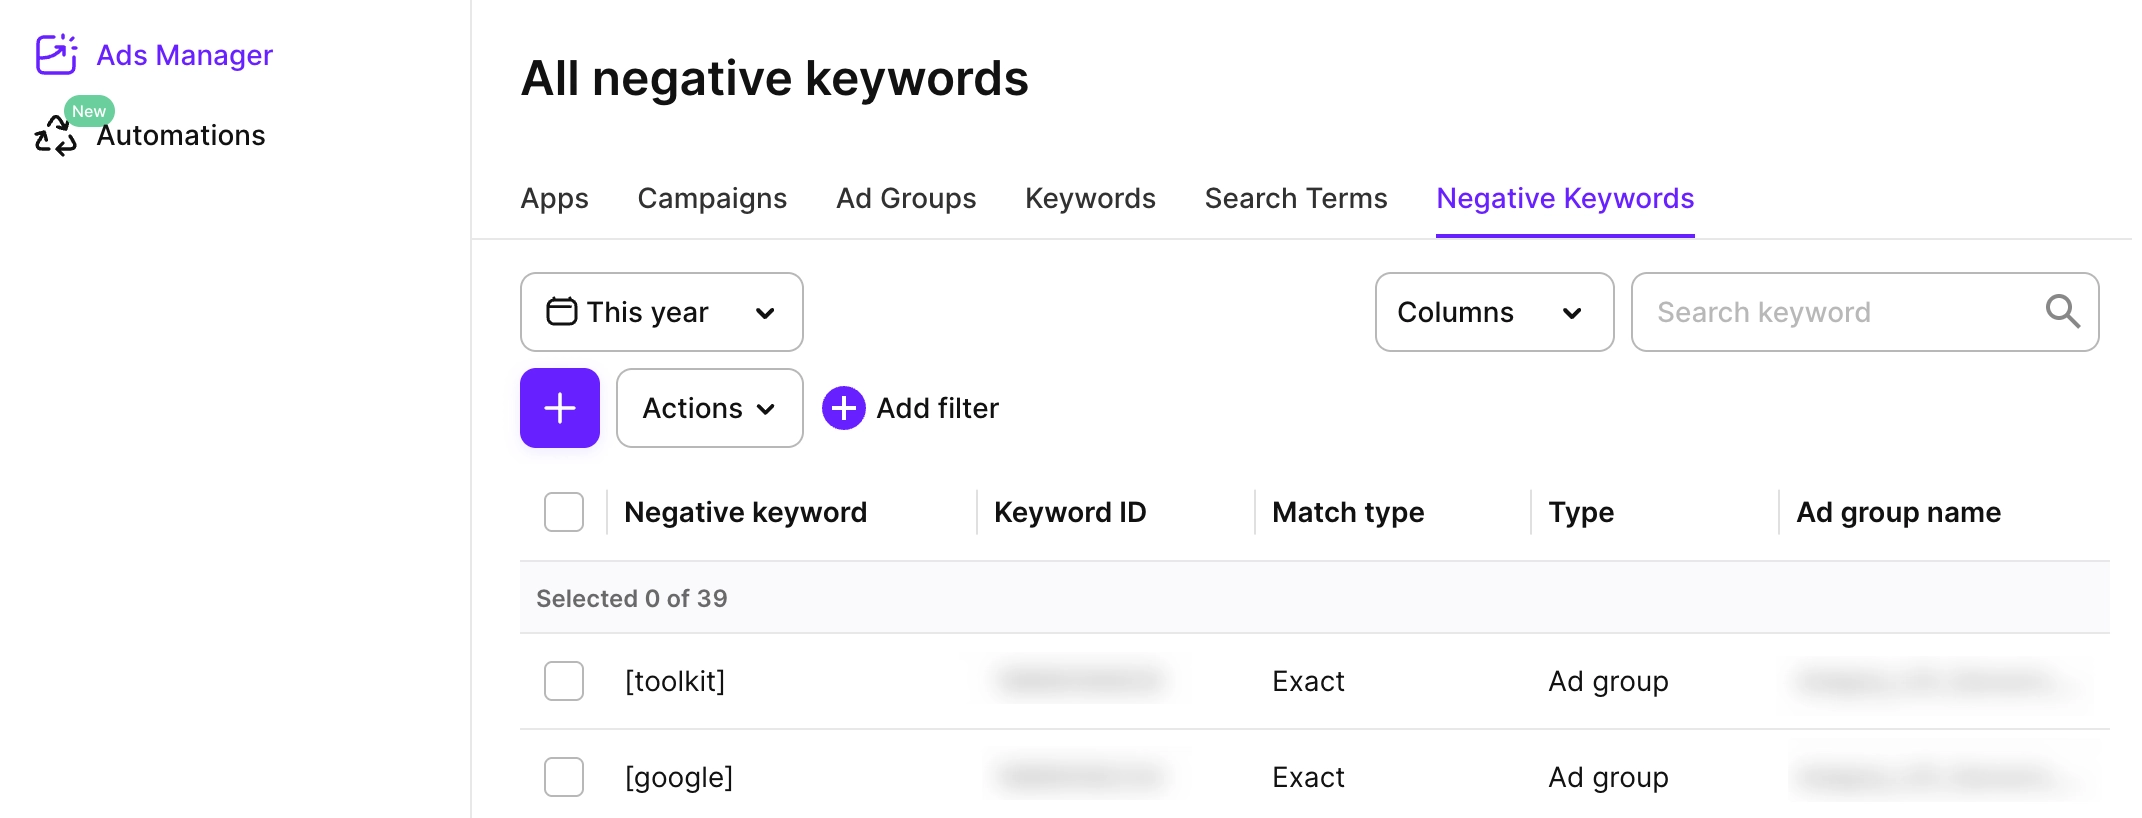
Negative keywords
On the Negative keywords tab, you can see a list of negative keywords and their metrics.
Ads
On the Ads tab, you can see a list of ads and their metrics, so you can see which ad setup is driving results.
Metrics
The columns available for display are grouped into several main categories:
- General: Meta properties of ads and campaigns.
- Performance: Information about the way users respond to your ads.
- Insights (for keywords and search terms only): Impression share and search popularity.
- Advanced downloads: New downloads and redownloads, including Total, View-Through, and Tap-Through values.
- Conversions: Revenue-related metrics linked to ads and campaigns.
- Cohort: Time-based analytics of user groups.
For the complete metric list and description, see the article.
Charts
On each tab, you can see charts showing how different metrics change over time during the selected date range. Adjust the time period using the Date range selector at the top right.
You can display multiple metrics at once to spot correlations and changes over time. Click + to add a new metric.
Click Reset to start anew or simply clear the metric checkboxes to hide them.
On the Keywords tab, you can also explore keyword-level charts.
Customize which metrics to show
On each tab, you can customize which columns to display and in which order. You can also save views to get back to them quickly anytime.
To customize the columns displayed and their order, click Columns > Edit columns on the top right. Then, select columns in the list and arrange them by dragging and dropping. Click Save to apply the changes.
To save a view preset, click the Columns dropdown again and click the Save icon next to Unsaved. Enter the preset name and click Save. Now, you can switch between different views using the Columns dropdown.
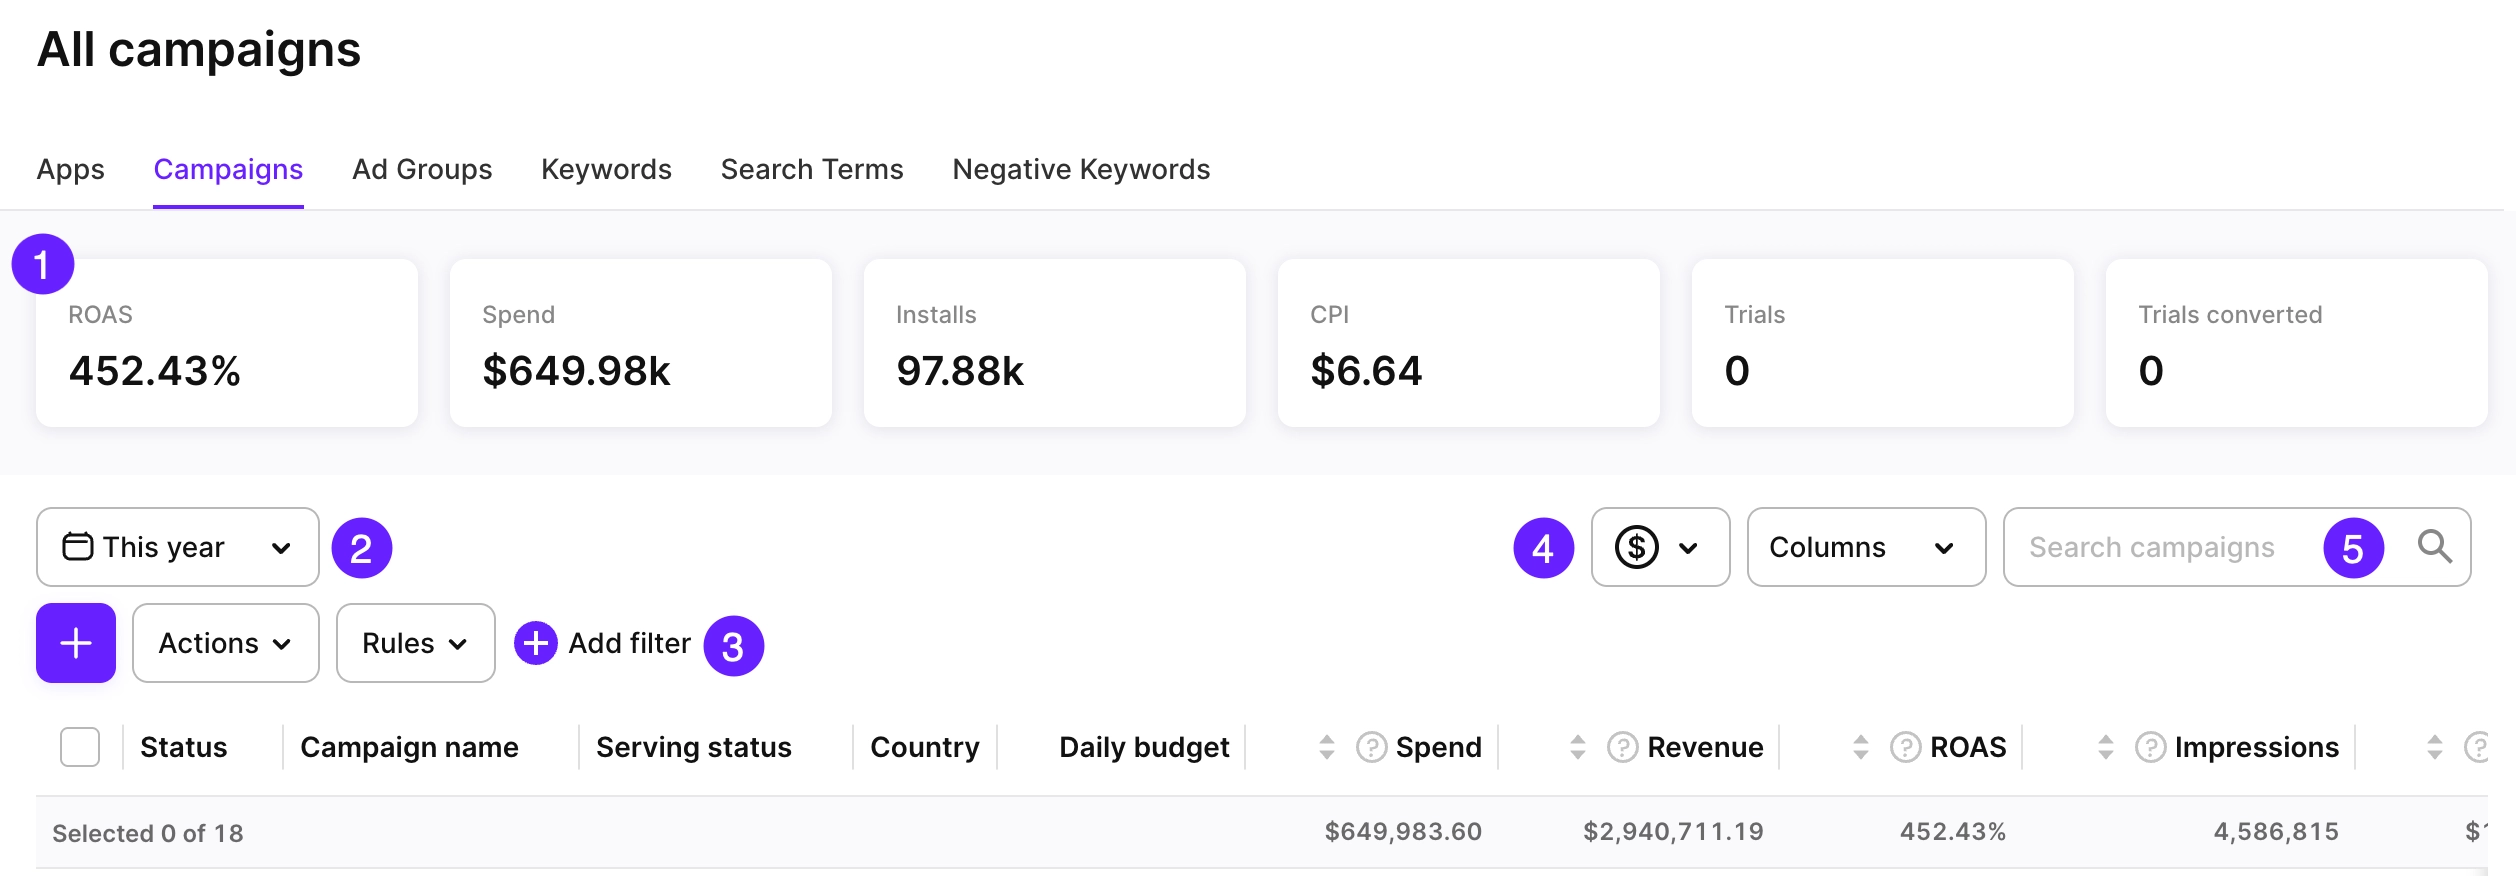
Controls
On the Analytics page, you have five main controls:
- Pinned metrics: Select metrics to pin in the bar above the table view.
- Date ranges: See more.
- Filters: Filter by metric values or campaign properties.
- Store commission and taxes: See more.
- Search: Search by campaign names.