Troubleshoot data discrepancies
Adapty users may encounter discrepancies when comparing similar sets of data from different sources. In particular, this can occur when you compare:
- Adapty charts to store reports
- Adapty charts to third-party charts
- Different charts within Adapty
Troubleshooting algorithm
Most discrepancies between Adapty and other platforms are expected and normal. They occur because different sources process the same data differently.
Other times, they indicate an issue with your Adapty configuration.
If you suspect that your data varies from platform to platform, the best course of action is to export raw data and compare the files.
- Even stores can experience issues related to data processing and presentation. Access the stores’ raw transaction data for the most accurate comparison.
- When comparing Adapty to another analytics platform, use store transaction reports as the source of truth and point of comparison.
- It’s easier to identify inconsistencies with a limited data set. Compare small volumes of data — focus on a specific product and a single day.
- Identify whether your discrepancy stems from a difference in pricing or event number. Pricing issues can be fixed with a product update. Event issues may indicate server-side problems.
- View the event feed to monitor incoming events — you may notice unexpected behavior.
After you identify where the data diverges, you can look into the following common causes:
Issues with server notifications and RTDN
Adapty does not receive the necessary event data if you didn’t correctly configure the store connections. This particularly affects events that occur without direct user involvement — subscription renewals, billing issues, etc.
Complete the server-to-server configuration as soon as you can (App Store | Play Store) and wait for the stores to establish the connection.
You can manually upload the missing App Store Connect data to Adapty.
Missing data
Users with out-of-date app versions
If some of your users run an older version of your app without the Adapty SDK, Adapty does not receive their data. For this reason the numbers of Adapty and other sources will diverge.
Integration issues
Some Adapty integrations (for example, Adjust or AppsFlyer) require additional application code to work. If you configure the Adapty dashboard, but do not update your application, the necessary data won’t show up in Adapty.
Missing historical data
Adapty doesn’t have access to your application’s historical data, unless you manually import it. If a chart’s time range starts before you integrated Adapty, and you didn’t import historical data, its values will differ from other sources.
Data delays
Adapty aims to provide near real-time analysis of your application’s economy. The following limitations and exceptions apply:
- When you first integrate Adapty, the data may not appear immediately.
- When you enable an integration with a third-party platform, there may be a delay before the data is fully synchronized.
- Once Adapty receives store data, it takes another 15-30 minutes for it to be processed and displayed on the Analytics page.
- Data exchange between Adapty and third parties is not always instantaneous due to the number of variables involved.
- Calculations for some advanced metrics (such as cohort predictions) require a certain amount of data. Adapty will only perform these calculations when it gathers enough data.
Time and calendar
Dates and timezones
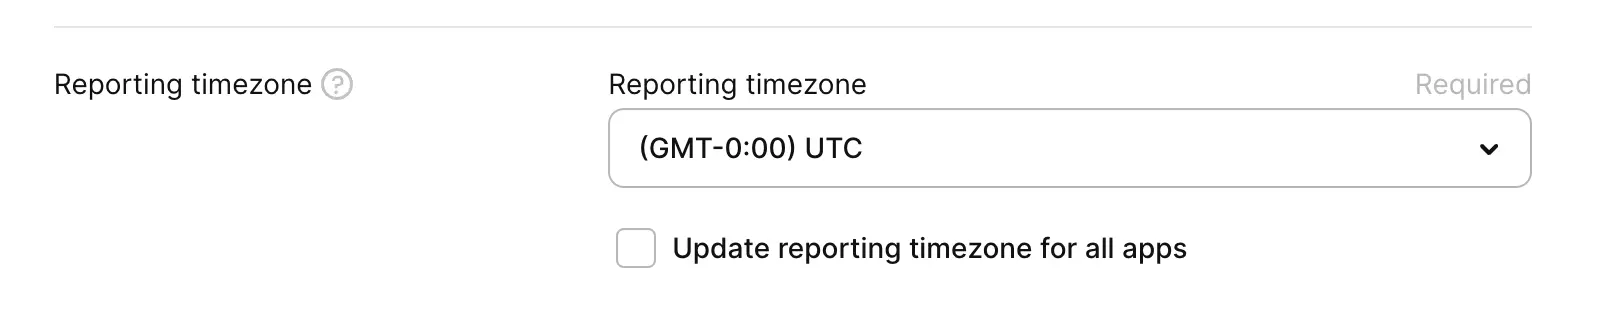
One of the most common reasons for perceived data discrepancies is a difference in timezone settings.
Adapty counts days according to the UTC timezone. If another platform uses a different timezone, the calculations will differ. The difference will decrease as you increase the scale.
You can change the timezone setting for each application.
The Apple fiscal calendar
Apple uses its own accounting calendar to determine sales periods and payout dates.
Each “month” in the calendar consists of 4 or 5 weeks, and may include days from the neighboring calendar months. Payments are typically issued 30–45 days after the sales period ends.
For example, the “January 2026” sales period begins on December 28th, 2025 — 4 days before the start of the calendar month. The estimated payment date for this period is March 5th.
Do not compare data from Apple payout reports to calendar months. Instead, select a custom date range that corresponds to the necessary sales period.
Transaction dates
Some services (for example, AppsFlyer) may apply cohort rules when displaying transactions, and attribute them to the application’s install date, rather than the date the transaction itself occurred.
Revenue calculation
Fees and taxes
Depending on the setting, Adapty charts can display your gross revenue, revenue after store commission, or revenue after store commission and tax.
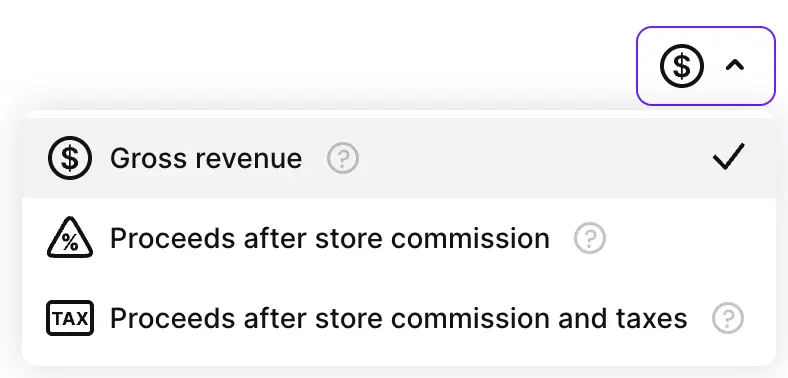
Some stores and third-party platforms may lack the capability to display gross revenue, or automatically deduct taxes. If you see a discrepancy between two different revenue charts, make sure that the comparison is valid.
Cancellations and refunds
Different platforms display refund data differently. Adapty treats refunds as negative revenue. If a user subscribes, and requests a refund the next day, both events will be reflected in Adapty charts — each on its own day. Other platforms may subtract the refund value from the original transaction.
Sandbox purchases
The event feed displays purchases made by sandbox accounts. The analytics charts do not. However, if your historical import data contains sandbox purchases, Adapty won’t be able to tell them apart, and its charts will reflect historical sandbox purchases.
Installs and downloads
Stores (Apple App Store in particular) can track user downloads directly. Their statistics may include cases where the application was installed, but never launched.
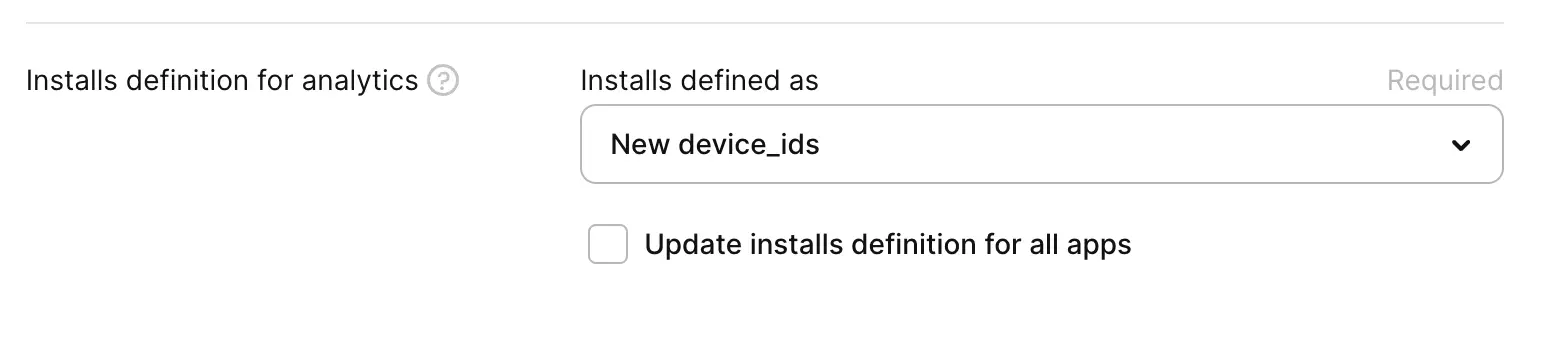
Adapty can only register an installation when a user launches the application, regardless of your install definition.
Country and store
To ensure accurate reporting, Adapty may infer the user’s country from their IP. Stores always attribute downloads and purchases to a specific app store.
If you need to clearly distinguish between the two, you can create a new user segment with the Country by store account attribute, and filter analytics by segment.
Product pricing
If incorrect product pricing causes a revenue discrepancy, changing the price doesn’t fix it retroactively. To change existing transactions’ prices, you need to forcibly override them by importing correct data.
When a user restores an old purchase after a price change, Apple may incorrectly report the purchase’s value. You need to import historical data for Adapty to reflect the correct value.
Attribution conflicts
Adapty can only use a single attribution source for each transaction. You cannot override this data later on.
If your setup includes multiple attribution providers that disagree with one another, the same transaction on two different platforms may appear to have two different traffic sources.
Differences in terminology
Different platforms may have different names for the same concept. Metrics related to revenue vary in name from platform to platform:
| Adapty | App Store Connect | Google Play Console |
|---|---|---|
| Gross revenue | Sales | Gross Revenue |
| Proceeds after store commission | N/A | N/A |
| Proceeds after store commission and taxes | Proceeds | Earnings |
| ARPPU | Proceeds per paying user | ARPPU |
Other metrics may differ in definition, as well:
- Subscriptions:
- Adapty does not count new trials as subscriptions. A new subscription always starts with a financial transaction.
- Other platforms, such as Google Play Console, may count each trial as a new subscription, even before the first payment was made.
- Retention:
- Adapty measures retention based on the number of subscription renewals.
- App Store Connect considers a user retained if they open the application on the specified day. A user without a subscription will count, but the subscribed user who didn’t open the app on that day won’t.
- Google Play Console’s “Retained Installers” metric measures retention based on the number of days the application remains installed on the user’s device. Users that don’t open the application count towards this metric.
New subscriptions metric vs the subscription_started event
The New subscriptions metric and the subscription_started integration event count different things, so their totals don’t match. The metric counts both first purchases made without a trial and trial-to-paid conversions. The subscription_started event fires only for first purchases made without a trial — when a trial converts to paid, Adapty sends trial_converted instead. As a result, the New subscriptions count is higher than the number of subscription_started events whenever your app has trial conversions.