Predicted metrics in Adapty Attribution
This article covers predictions in Adapty Attribution only. For predicted LTV and revenue on the Cohort analysis page, see Predictions in cohorts.
Adapty Attribution projects future revenue and unit economics for each cohort, so you can compare campaigns before they have time to mature. Predictions are produced from the app’s own historical cohort data and update daily. They are most useful for evaluating recent cohorts that have not yet completed long subscription cycles.
Predicted metrics
| Metric | Description |
|---|---|
| pRevenue | Predicted total revenue a cohort is expected to generate by the target horizon. Modeled from the app’s historical cohort retention. |
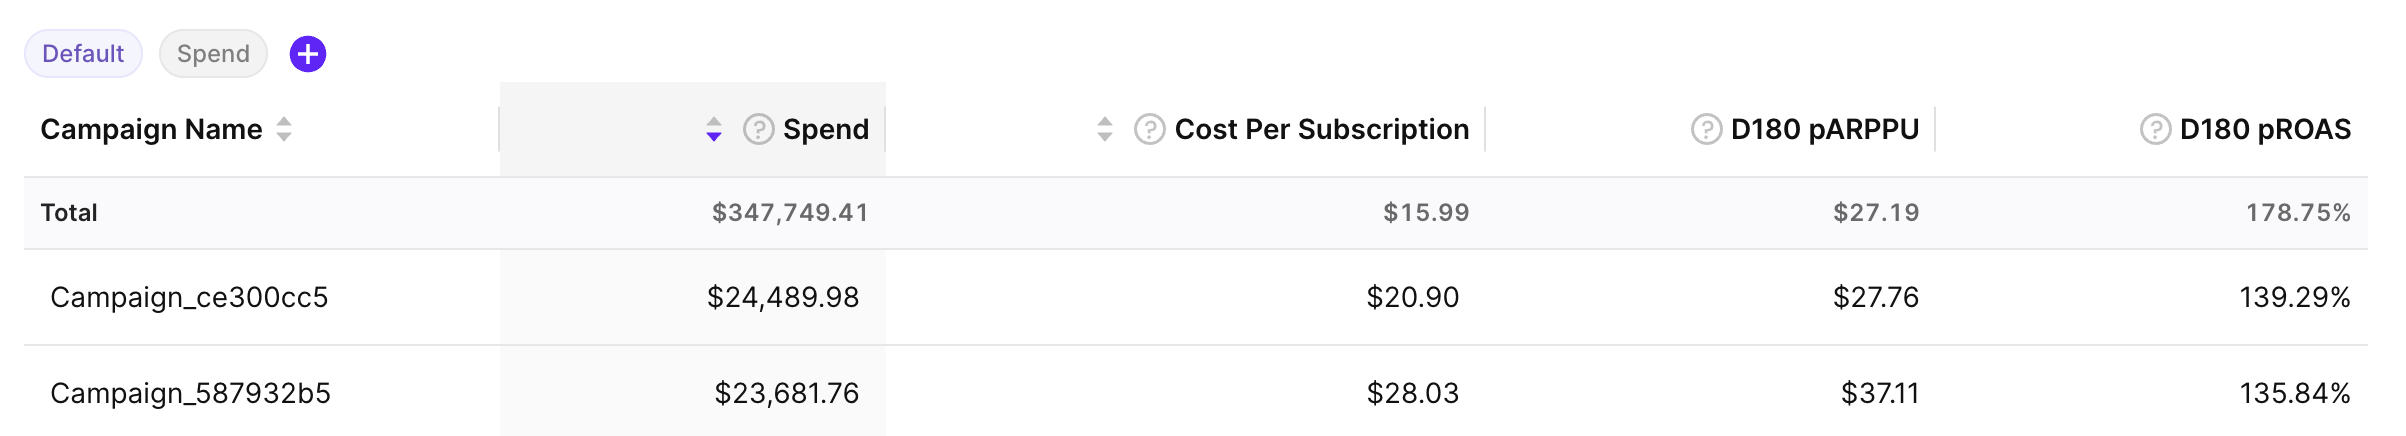
| pROAS | Predicted return on ad spend over the same horizon. Formula: (pRevenue / Spend) × 100% |
| pAdProfit | Predicted revenue net of ad spend over the horizon. Formula: pRevenue − Spend |
| pARPU | Predicted average revenue per install over the horizon (predicted LTV). Formula: pRevenue / Installs |
| pARPPU | Predicted average revenue per paying user over the horizon. Formula: pRevenue / paying users at d{N}, where d{N} matches the selected horizon. |
pRevenue is the base value. The four other metrics are derived from it using observed cohort data — spend, installs, and paying users — not by running the model separately.
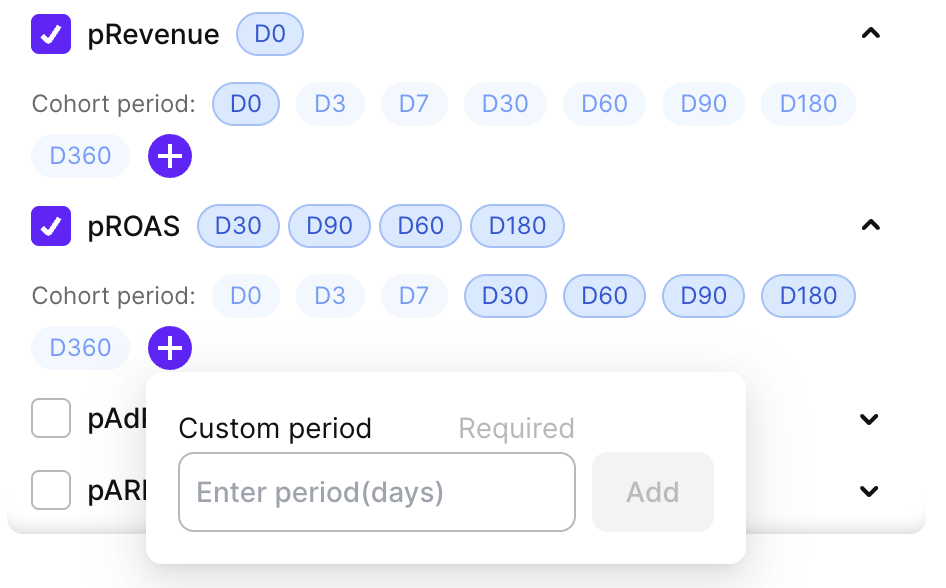
Each predicted metric is available at multiple cohort periods: D0, D3, D7, D30, D60, D90, D180, and D360. You can also add a custom period in days. The period defines how far into the future the value is projected from the cohort’s install date.
How predictions are calculated
Predictions are built from each app’s own historical cohorts. The model measures how revenue from past cohorts grew after their baseline day, then projects the current cohort forward using the same trajectory.
Baseline day
Predictions become available only after the cohort reaches its baseline day. The baseline day is the first day on which 90% of a cohort’s initial revenue has typically been received. Initial revenue counts subscription starts, trial conversions, and non-subscription purchases; renewals are not counted toward this threshold.
The baseline depends on the app’s trial length and product mix:
- Apps without trials: The baseline day usually falls within the first few days after install.
- Apps with short trials: The baseline typically lands shortly after the trial converts.
- Apps with longer trials: The baseline can sit a week or more after install, since most initial revenue only materializes once the trial completes.
Projection by subscription type
At the baseline day, the cohort’s initial revenue is split into five categories — monthly, yearly, weekly, and quarterly subscriptions, plus non-subscription purchases. Each category is projected forward independently using a trajectory measured from the app’s past cohorts.
The model gives more weight to recent cohorts and to cohorts with comparable economics, such as similar revenue per transaction and a similar product mix. A prediction therefore reflects how the most recent and most similar cohorts in the app have actually performed.
When predictions are available
A prediction is shown only if the cohort has enough data to support it. When a value cannot be produced, the column shows an em-dash (—) instead.
Common reasons a prediction is unavailable:
- Cohort has not reached its baseline day: The model needs the cohort’s initial revenue to stabilize before it can project forward.
- Insufficient historical data for the app: If the app does not have enough past cohorts of the relevant subscription type, the model cannot fit reliable retention rates.
Predictions are recomputed daily with the latest transactional data, so values for the same cohort can shift as more revenue is observed.