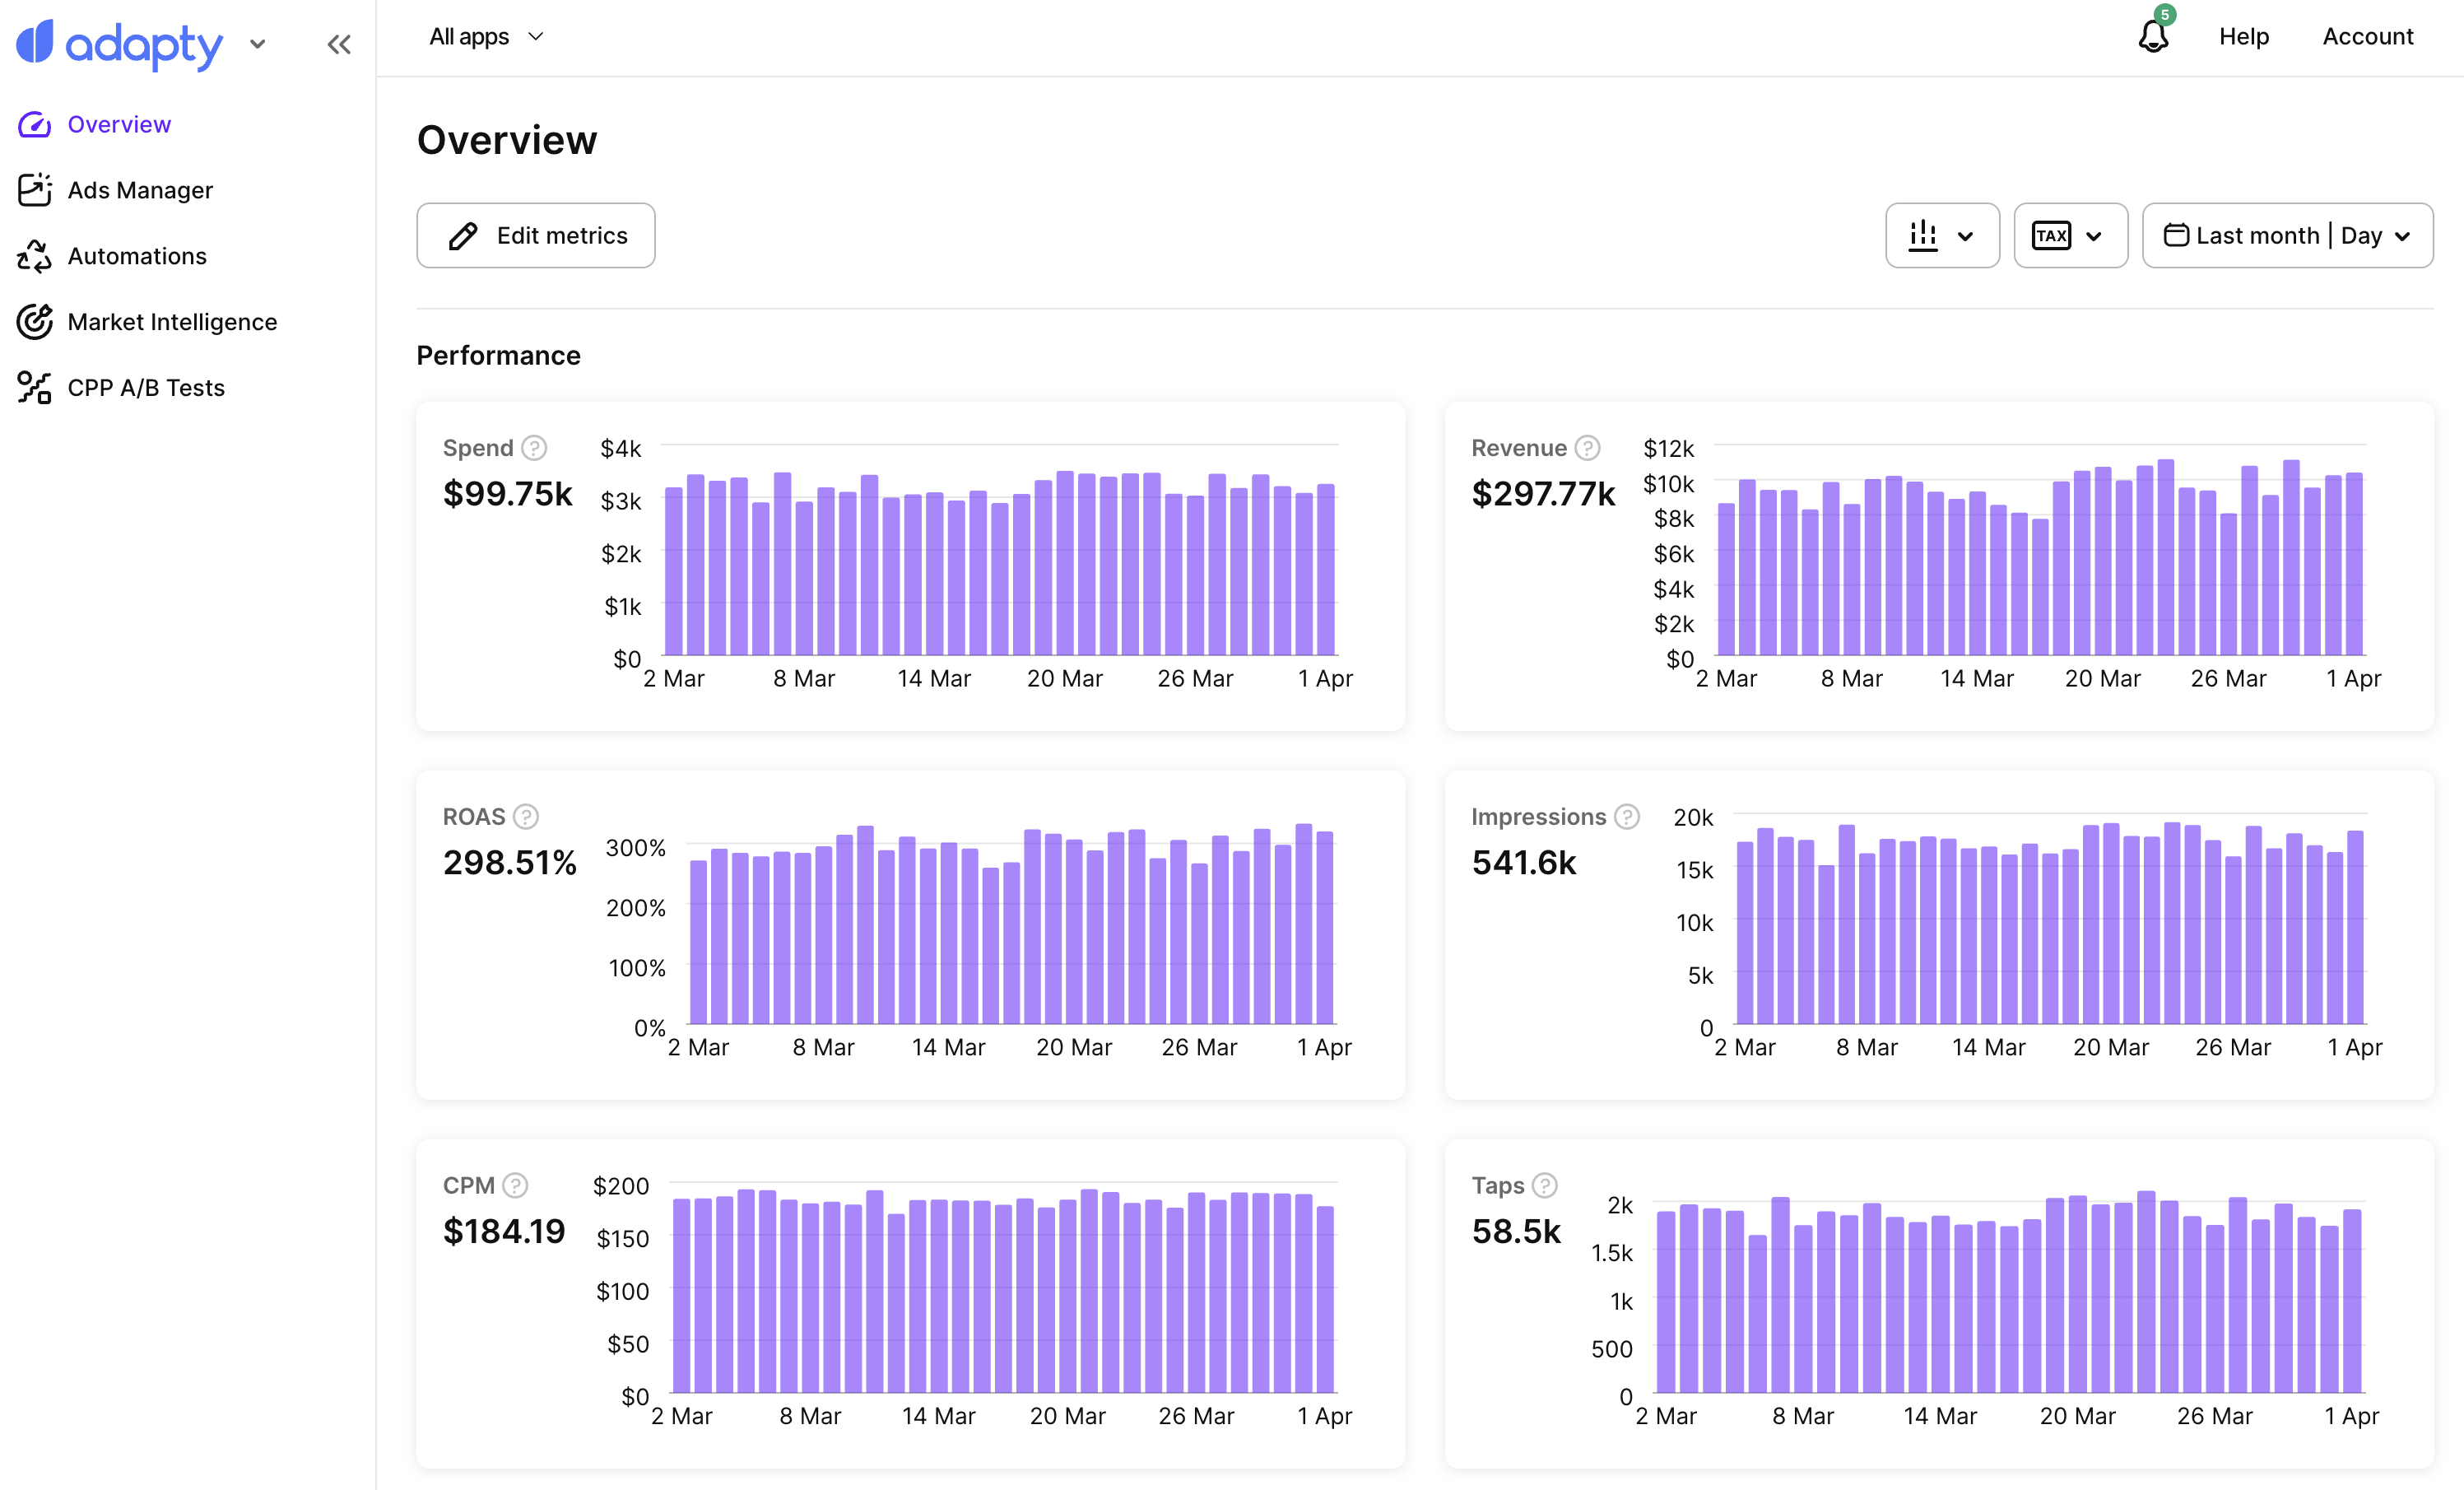
Overview in Adapty Ads Manager
The Overview page shows all key Apple Ads metrics in one place, each with a trend chart.
By default, it shows data for all your connected apps. To view a single app, select it from the app dropdown in the header.
To open it, go to Overview in the left sidebar of Adapty Ads Manager.
To get a summary of what needs your attention instead of scanning the metrics, ask the AI Agent.
Metrics
Each metric appears as a card with a trend chart for the selected time range. For metric definitions and formulas, see Metrics in Adapty Ads Manager.
Configure displayed metrics
To change which metrics appear on the Overview page, click Edit metrics. From there, you can:
- Add a metric: Click Add metric and select the checkboxes for the metrics you want.
- Remove a metric: Clear its checkbox in the Add metric panel, or click × next to it.
Controls
Use the controls at the top to adjust what the Overview page shows:
- Date range: Choose a preset period (Last 7 days, Last 30 days, Last 90 days) or enter a custom range. All charts and summary values update to reflect the selected period.
- Chart type: Switch between stacked column, line, and pie chart views.
- Revenue display: Choose how revenue metrics are calculated:
- Gross revenue: Total revenue before any deductions.
- Proceeds after store commission: Revenue after Apple’s commission is deducted.
- Proceeds after store commissions and taxes: Net revenue after both Apple’s commission and applicable taxes are deducted.