What Google Play's new billing rules mean for subscriptions
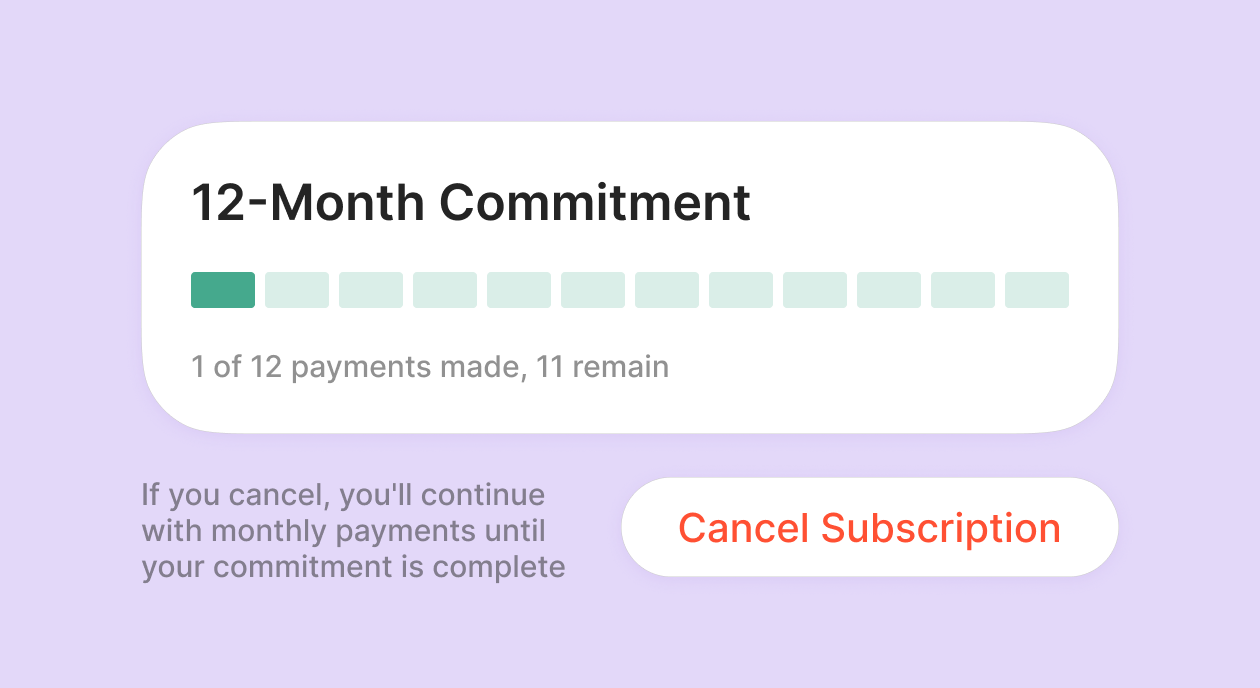
Google Play split its fees and opened up billing on Android. What changed for subscription apps, and where the 2026 data says Android pays off.

Google Play split its fees and opened up billing on Android. What changed for subscription apps, and where the 2026 data says Android pays off.

Siri AI, Retention Messaging out of beta, new subscription types, App Store visual placements. Everything from WWDC26 that matters for subscription apps.

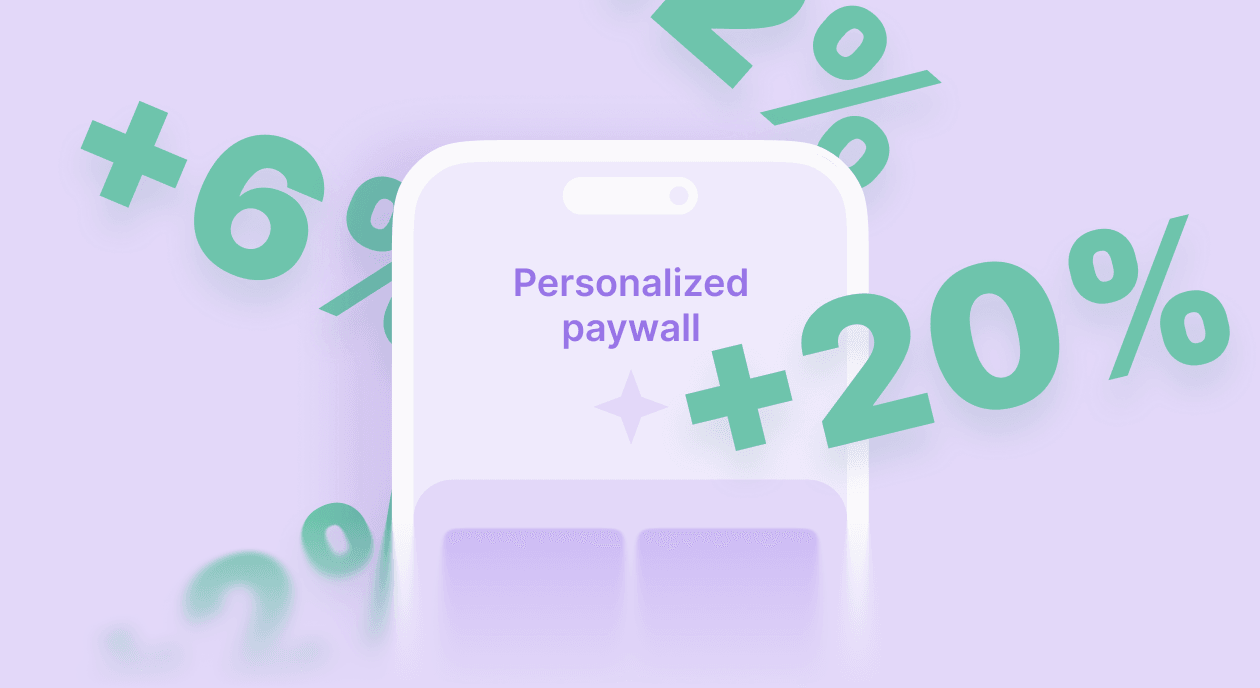
Paywall personalization lifts Apple Ads ROAS by 82% by day 92. Check the data from 8K apps on what works, when it doesn't, and how to set it up.

12 answers to the most asked questions about iOS 17 App Clips — what's new, how to discover and use them, plus implications for subscription apps.

Lifestyle has the highest revenue concentration of any App Store category. Here's what data says about LTV, pricing, trials, and paywalls for Lifestyle apps.

LTV, pricing, trial conversion, and retention benchmarks for Education apps — drawn from Adapty's SOIS 2026 report covering $3B in subscription revenue across 16,000+ apps.
The subscription growth newsletter

What Google Play's new billing rules mean for subscriptions

WWDC26 for subscription apps: What’s new

Does paywall personalization work for Apple Ads? Real data from 1M+ ad groups

12 Questions About iOS 17 App Clips, Answered
The subscription growth newsletter
Monthly tactics, benchmarks and paywall insights — straight to your inbox
Your monthly payout summary
Security alert digest

Entertainment apps average $0.59 install LTV and 19.1% trial-to-paid conversion — the lowest of any category. Here's what the data says about pricing, trials, and Android.

Productivity apps leads all categories at $46.97 average LTV — but direct buyers outperform trial users by $7.82. 2026 benchmarks for pricing, conversion, and retention from $3B in subscription revenue.

Health & Fitness apps leads all categories with $1.21 install LTV. 2026 benchmarks on pricing, trials, conversion, and plan mix — based on $3B in subscription revenue.

Your churn rate changes based on plan type, trial vs. direct, and category. Data from 16,000+ apps shows how to read each dimension correctly.

Weekly subscription plans now generate 55.5% of all app revenue. But the right subscription plan type depends on your category. Data from 16,000+ apps.

95% of subscription revenue goes to the top 10% of apps. Data from 16,000+ apps reveals the 3 myths holding most subscription apps back in 2026.