In-app subscription benchmarks for Lifestyle apps

TL;DR:
- Lifestyle is the most concentrated category in the App Store: the top 10% capture 97.9% of all revenue
- Trials actively hurt you here. Lifestyle is the only category where trial users end up 21.2% less valuable than direct buyers
- Monthly plans are the strongest per-subscriber LTV play in Lifestyle at $42.8 — but direct buyers are who you want to acquire
- Install-to-paid (direct) conversion reaches 18-38% in Lifestyle — high by market standards, but only if your paywall is positioned correctly
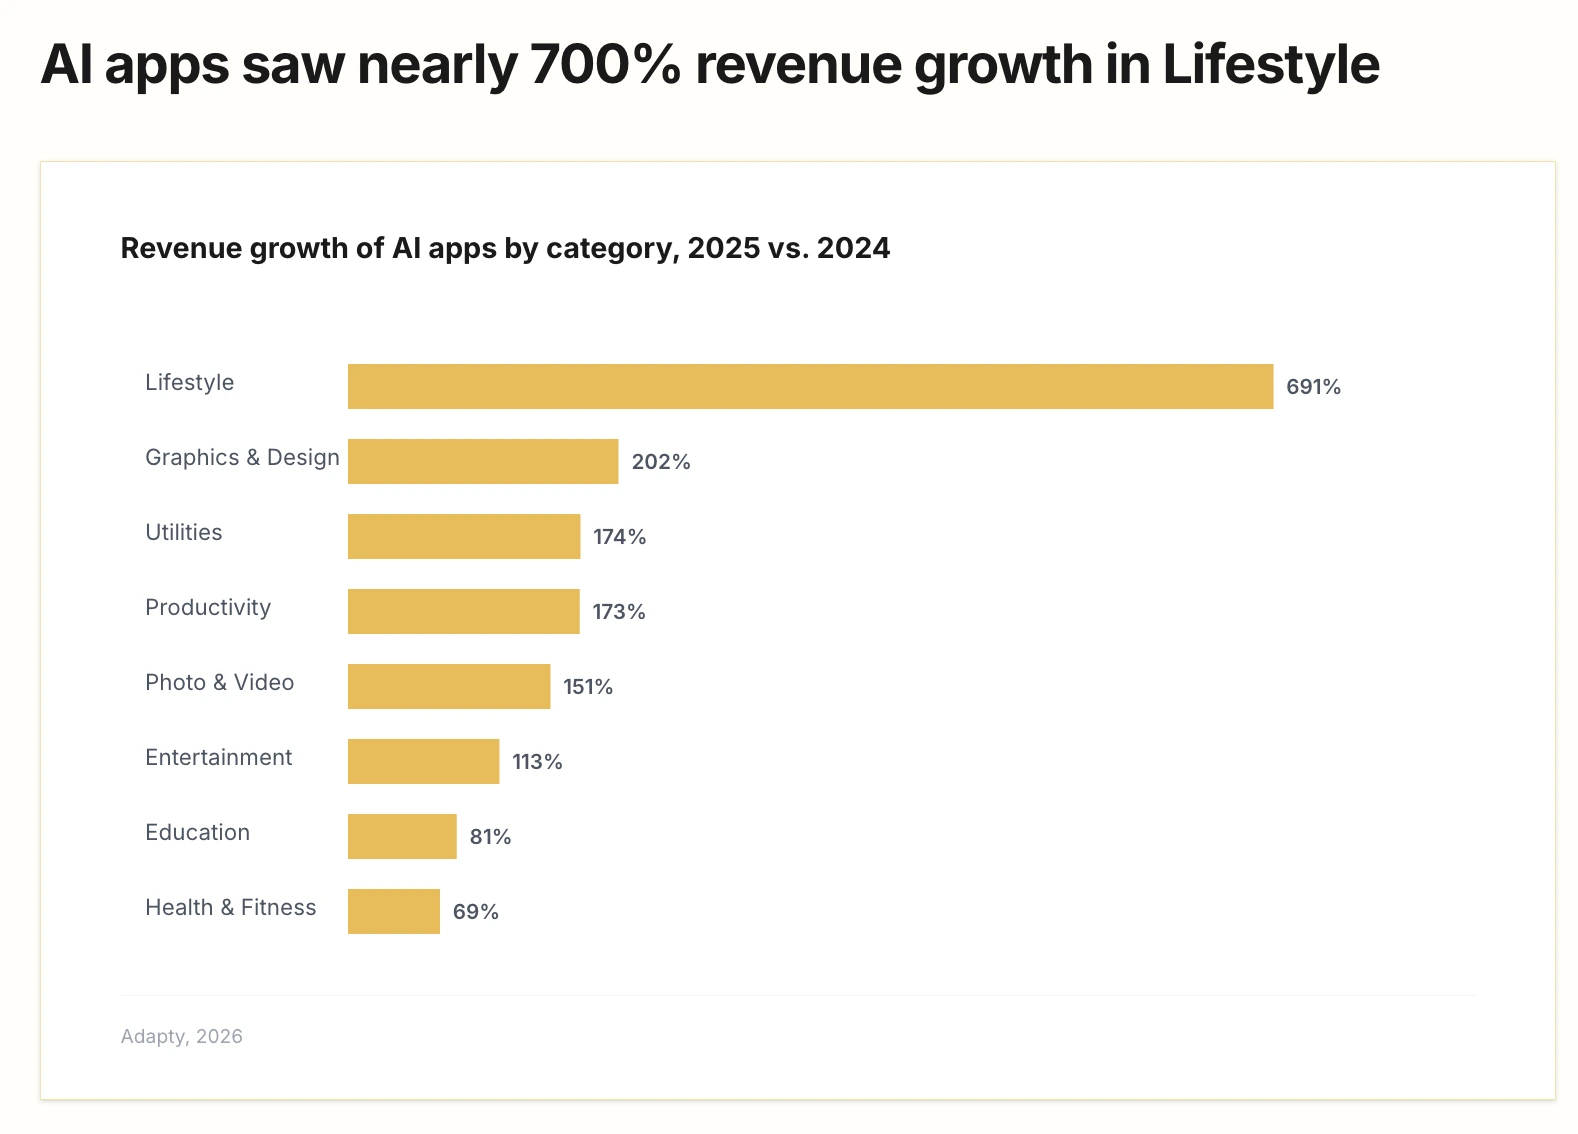
- AI Lifestyle apps grew 691% year-over-year in 2025 — by far the fastest growth of any AI subcategory in the App Store
Lifestyle is one of the most popular app categories in the App Store. It's also one of the least forgiving places to build a subscription business.
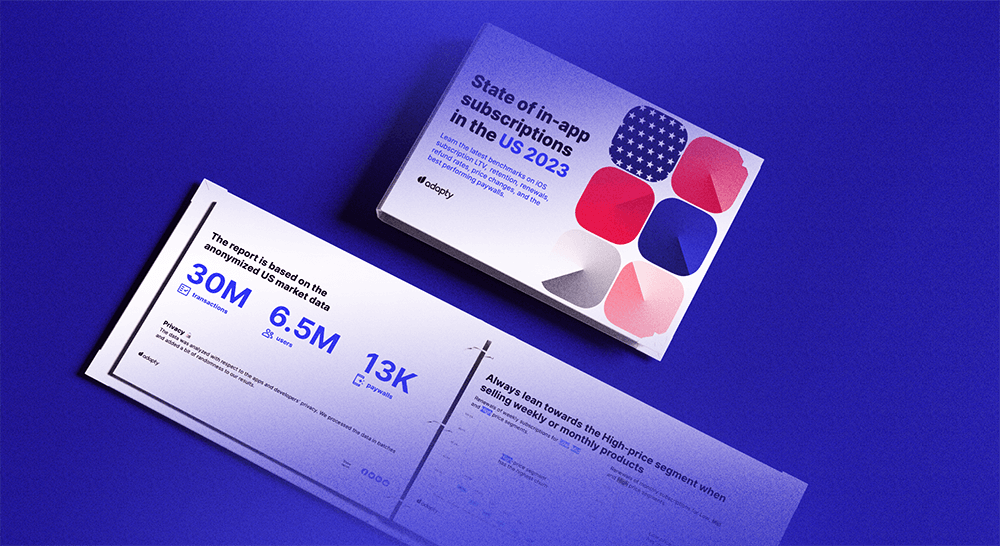
The top 10% of Lifestyle apps capture 97.9% of all category revenue — the highest concentration figure of any segment in Adapty's State of in-app subscriptions 2026, which covers $3B in subscription revenue across 16,000+ apps. The standard monetization playbook — add a free trial, optimize the paywall, run some A/B tests — works differently here. In some cases, it works in reverse.
This article pulls the Lifestyle-specific data from the SOIS 2026 report: pricing, LTV, conversion, retention, and paywall strategy. Use it to benchmark your app against the market and find where your monetization assumptions need updating.
Lifestyle is the hardest App Store category to build a subscription business in
The numbers in Lifestyle benchmarks don't land the way they do in other categories. Revenue concentration sits at 97.9% for the top 10% — nearly three points above the all-category average of 94.5%, and the highest of any segment in the SOIS 2026 dataset. That leaves 2.1% of all Lifestyle subscription revenue for the remaining 90% of apps.
For context, Health & Fitness — often cited as a tough, crowded market — has 92.6% concentration. Education sits at 96.0%. Lifestyle is in a category of its own.
| Category | Revenue share, top 10% of apps |
| Lifestyle | 97.9% |
| Education | 96.0% |
| Productivity | 95.6% |
| Photo & Video | 94.6% |
| All categories | 94.5% |
| Entertainment | 94.0% |
| Health & Fitness | 92.6% |
| Utilities | 92.6% |
The practical implication: if you're entering Lifestyle without meaningful product differentiation, the revenue ceiling is effectively zero. This is the only category in the report where the structural odds against a new entrant are this extreme.
The apps in the top 10% built habits users rely on — paywall tricks don't explain the gap. Journaling, meditation, wellness routines — the value is user-generated, which means an app that doesn't create genuine behavior change has no retention floor to stand on.
What does subscriber LTV look like in Lifestyle?
Lifestyle doesn't lead any category in raw subscriber LTV — but it holds its own on monthly plans, where 12-month LTV reaches $42.8. That puts Lifestyle ahead of most categories for the monthly billing cycle, behind Health & Fitness annual plans ($46.1) and Productivity ($46.97 across all plans), but ahead of Entertainment and Graphics & Design.
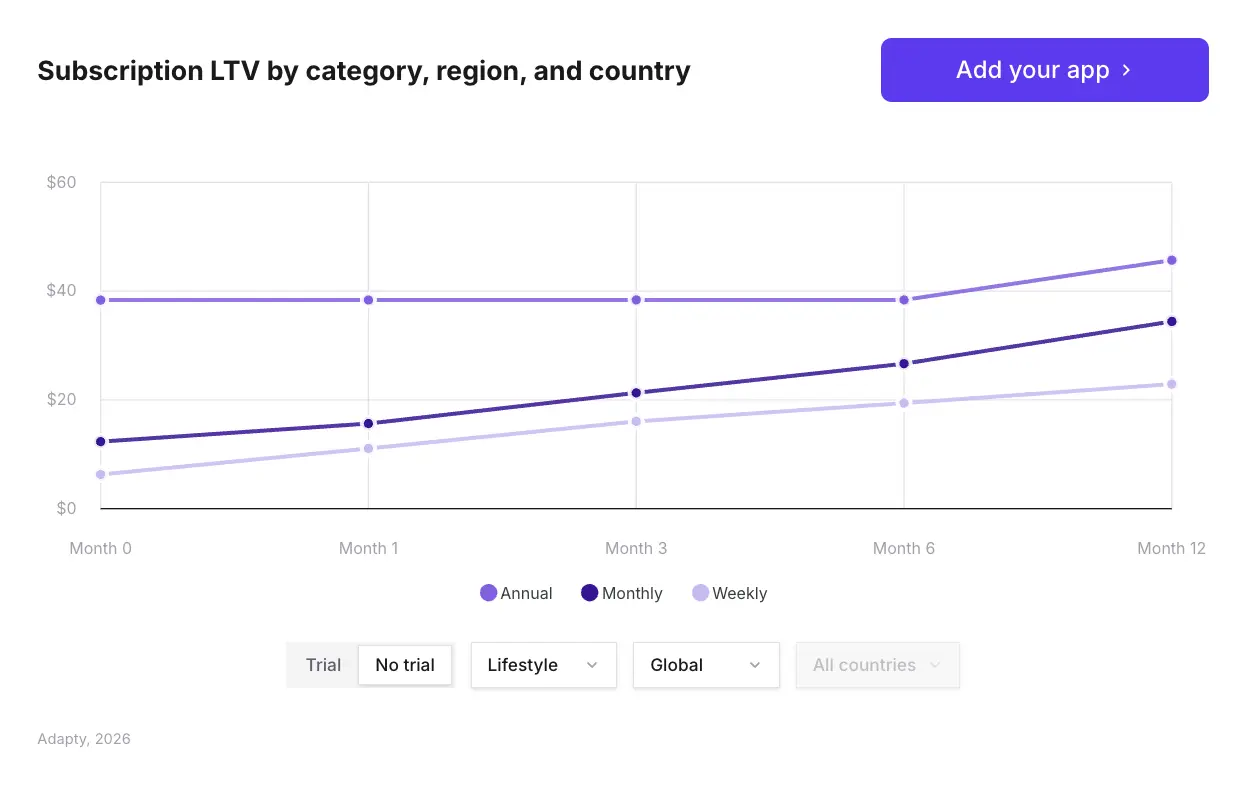
The nuance is in how you get there. Monthly plans in Lifestyle perform better than you'd expect, given how poorly the category retains — because the users who do stay on monthly have already filtered themselves through higher purchase intent. They paid upfront, with no trial as a safety net.
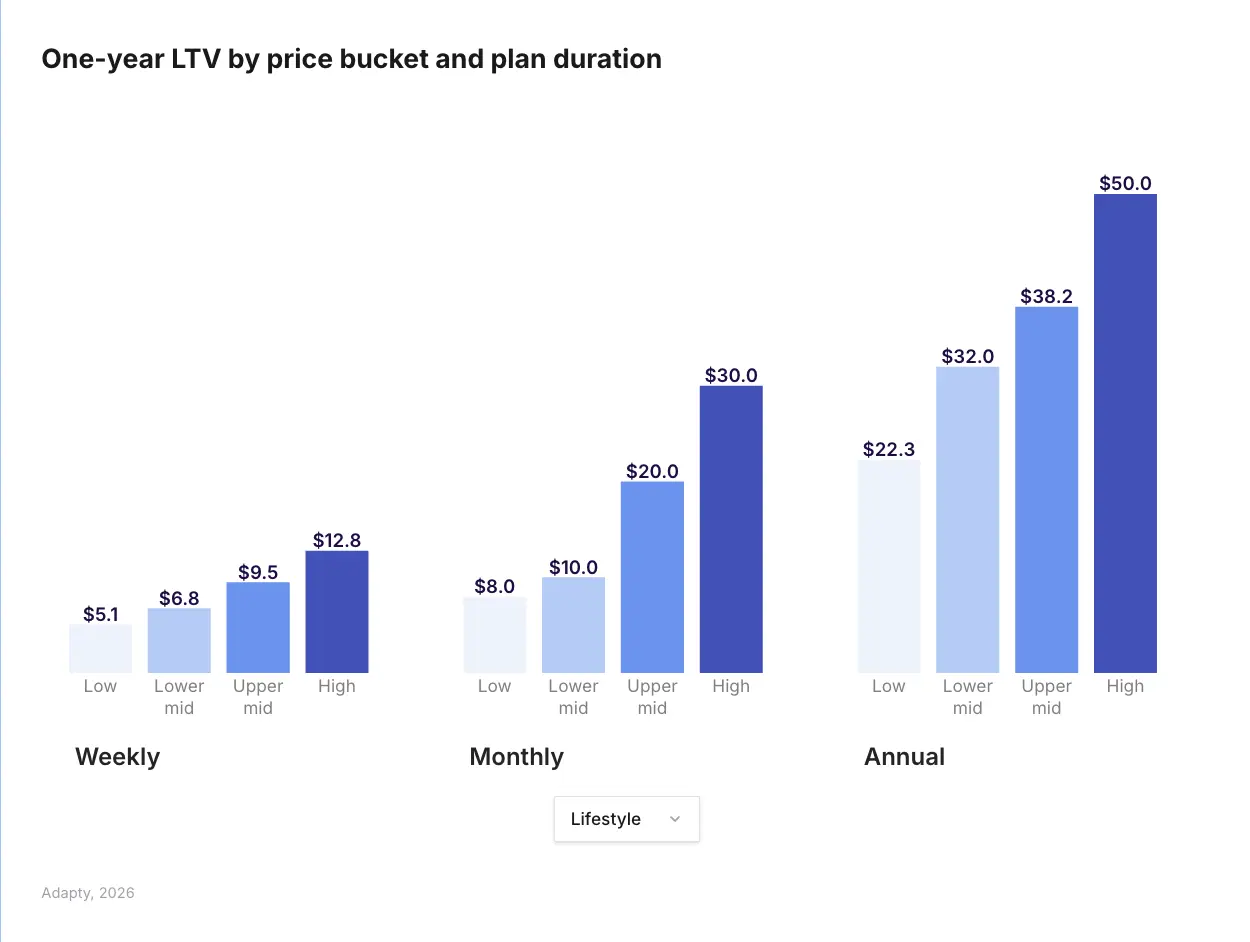
Per-subscriber LTV varies significantly by pricing tier. Across categories, high-priced apps generate 3x the LTV of low-priced ones. Lifestyle follows this pattern. If you're pricing in the bottom quartile of your niche, you're pulling in lower-intent users who inflate your churn numbers.
Install LTV: the metric that tells the full acquisition story
Install LTV measures how much revenue a new install generates over 12 months, accounting for conversion rates and per-user value. Health & Fitness leads all categories at $1.21 per install globally; Productivity and Utilities follow. Lifestyle's install LTV sits lower because conversion rates in the category are dragged down by the trial problem covered below.
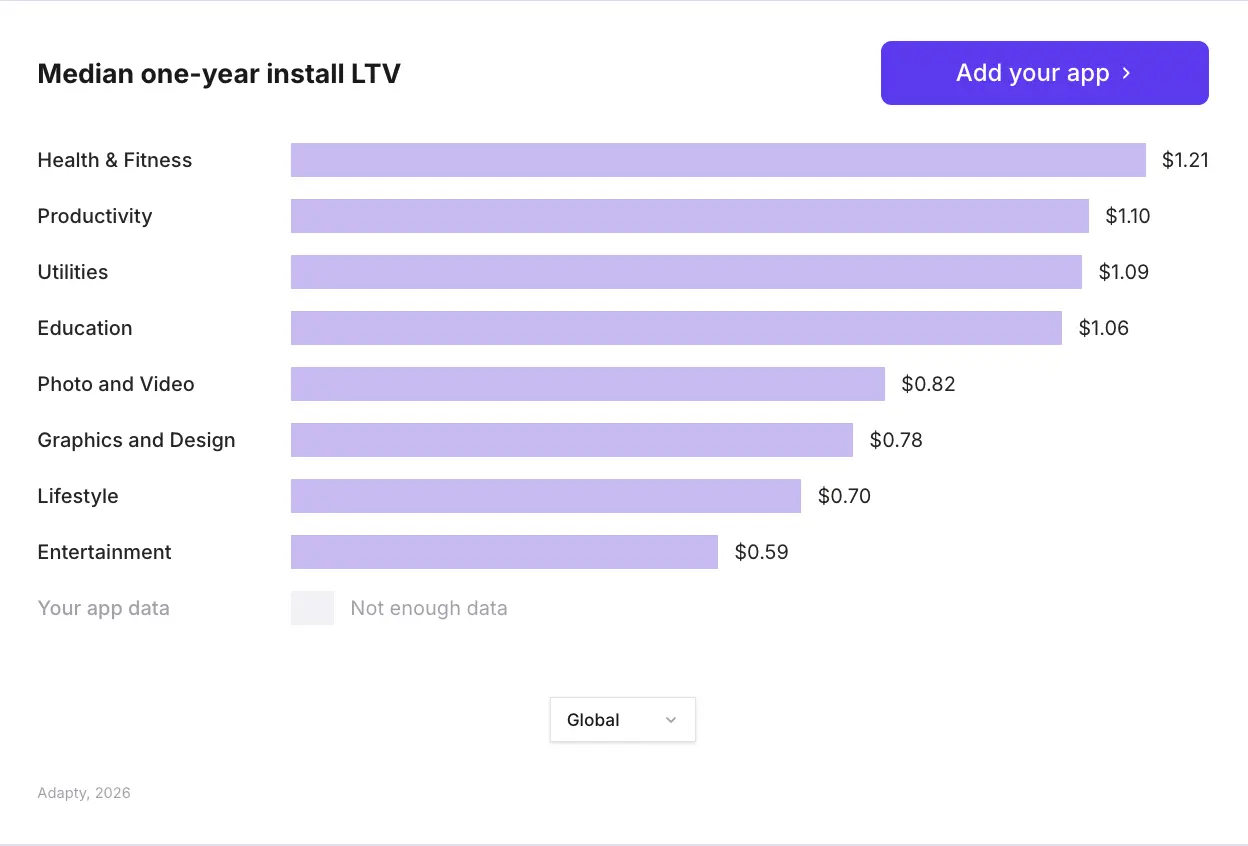
In North America, install LTV runs roughly 2x the global average across most categories. If your Lifestyle app skews US-heavy, your actual install LTV should sit above global benchmarks — but the trial dynamics still apply regardless of region.
Should Lifestyle apps offer free trials?
The data gives an unambiguous answer: trials reduce LTV in Lifestyle by 21.2% — the only category in the SOIS 2026 report where this happens. Direct buyers end the year with more value in every other Lifestyle cohort comparison.
The mechanism is straightforward. Lifestyle apps — journaling tools, habit trackers, meditation platforms, wellness routines — depend on the user generating their own value through consistent behavior. A trial user in this context is disproportionately an experimenter: someone hoping motivation will arrive if they give the app a shot. It doesn't. They churn.
Your direct buyer is different. They've already decided. That self-selection is why their 12-month LTV runs 21% higher than the trial cohort.
| Category | Trial LTV vs. direct buyer LTV |
| Utilities | +85.1% (trials win) |
| Health & Fitness | +63.6% (trials win) |
| Education | +50.4% (trials win) |
| Productivity | -13.7% (direct wins) |
| Lifestyle | -21.2% (direct wins — the largest gap) |
Compare this to Utilities, where the trial LTV premium runs +85.1%. The same product mechanic w orks in opposite directions depending on the category. In Utilities, a trial lets users verify that the app solves a concrete, recurring problem — they experience real value, commit, and stay. In Lifestyle, the value only materializes if the user builds a habit — and trial users rarely do.
What this means for your paywall setup
Hard paywall, direct purchase, no trial is the configuration worth testing in Lifestyle. The SOIS 2026 data also shows that hard paywalls produce 21% higher LTV than soft paywalls across all categories — and in Lifestyle, where you want to filter for committed buyers, the selection effect runs even stronger.
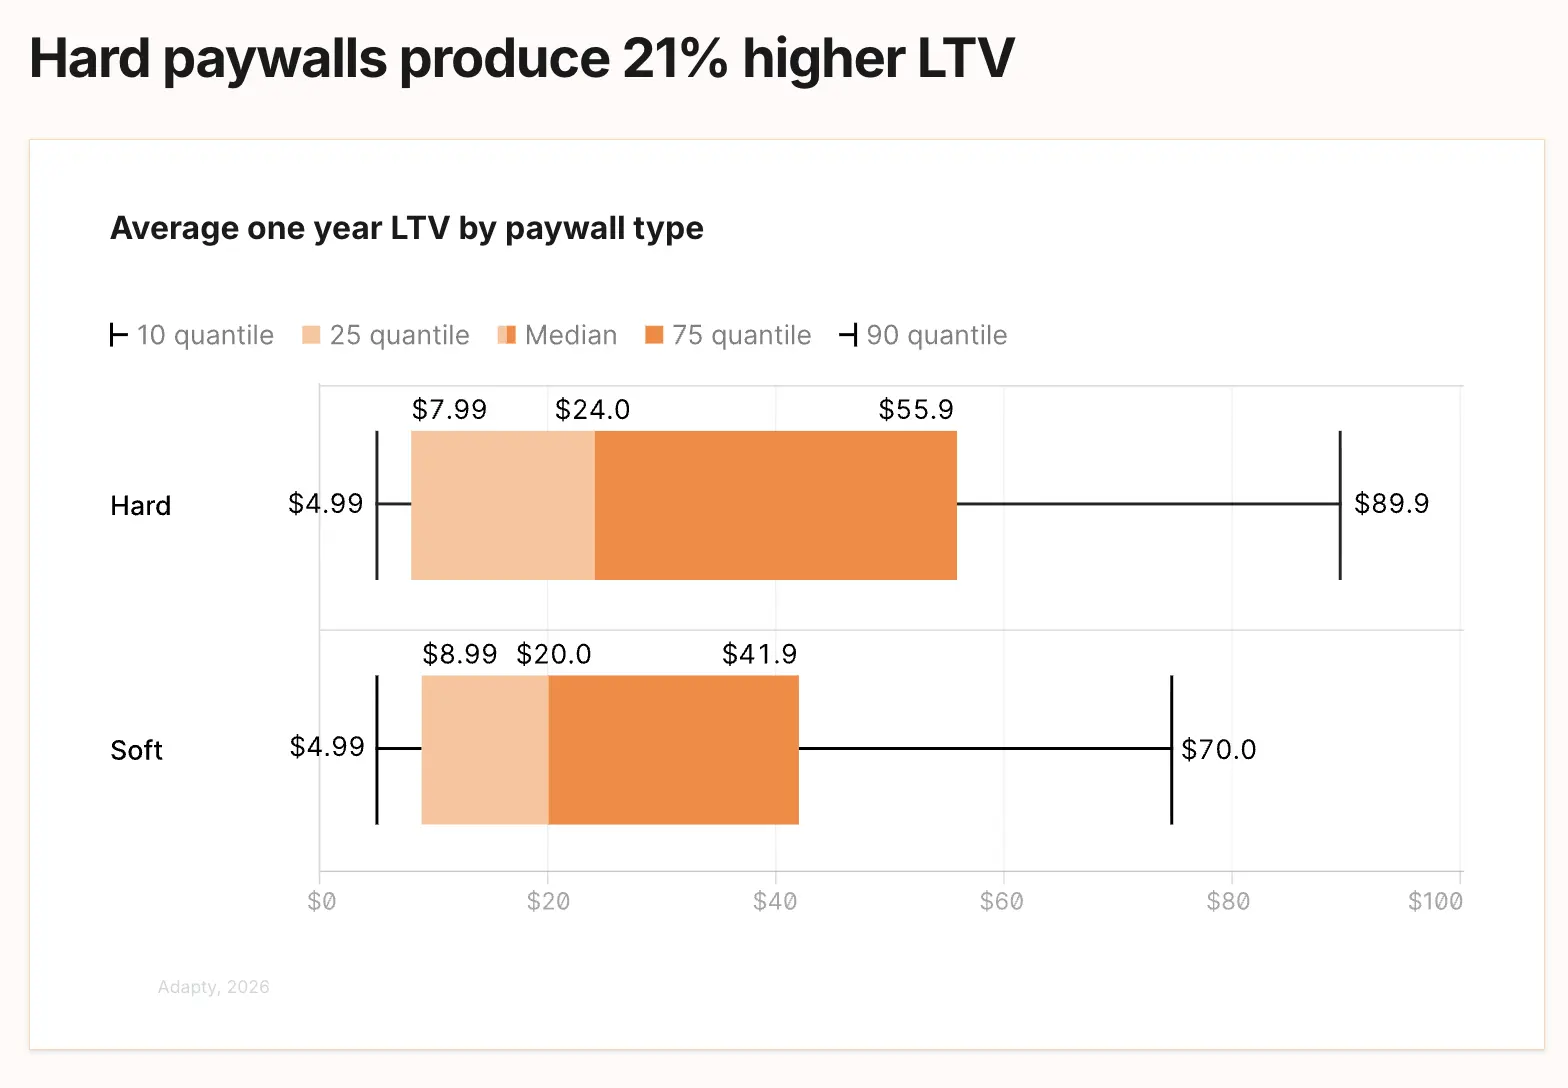
Soft paywalls convert nearly 50% better on the raw conversion rate. But conversion rate is the wrong metric to optimize for in a category where your worst users are the ones most likely to start a free trial. Higher Day 0 conversion from a soft paywall doesn't offset a 21% LTV haircut on every trial subscriber you acquire.
How should Lifestyle apps price their subscriptions?
Global median prices in 2025 across all categories sit at $7.48/week, $12.99/month, and $38.42/year. Lifestyle pricing tends to cluster near these midpoints, but the distribution within the category is wide.
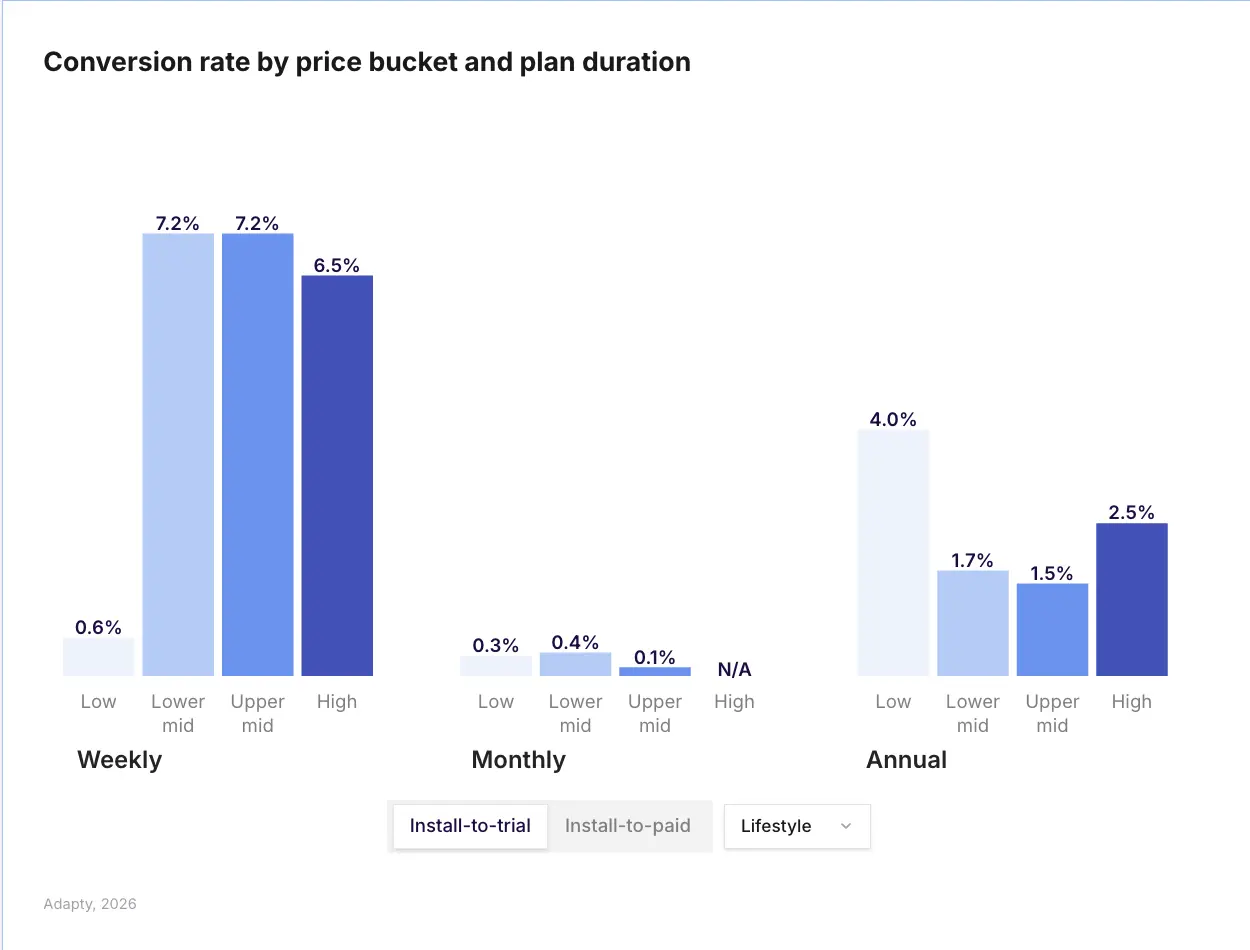
Higher prices don't hurt conversion the way most teams assume. Across the full dataset, high-tier weekly plans generate 5.2x more revenue per install than low-tier ones. The users who convert at a premium price point are higher-intent buyers — and in Lifestyle, where you're already filtering for committed users, price acts as an additional quality screen.
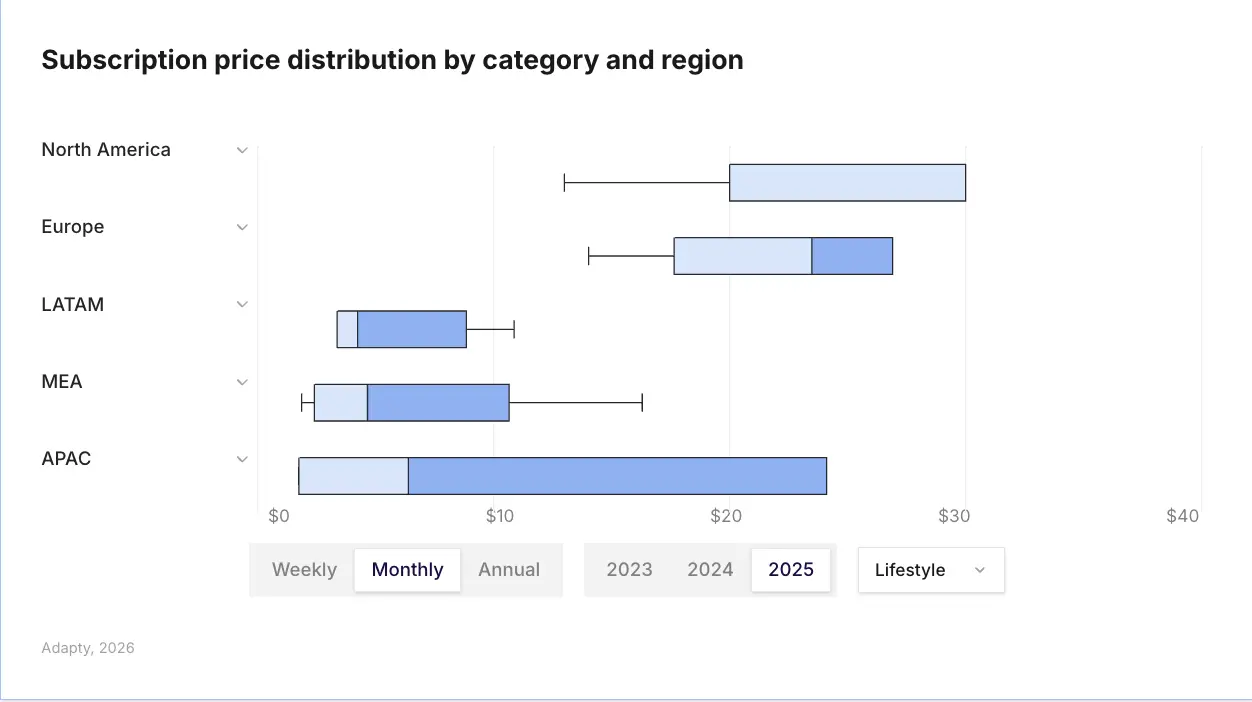
Regional pricing gaps you're probably ignoring
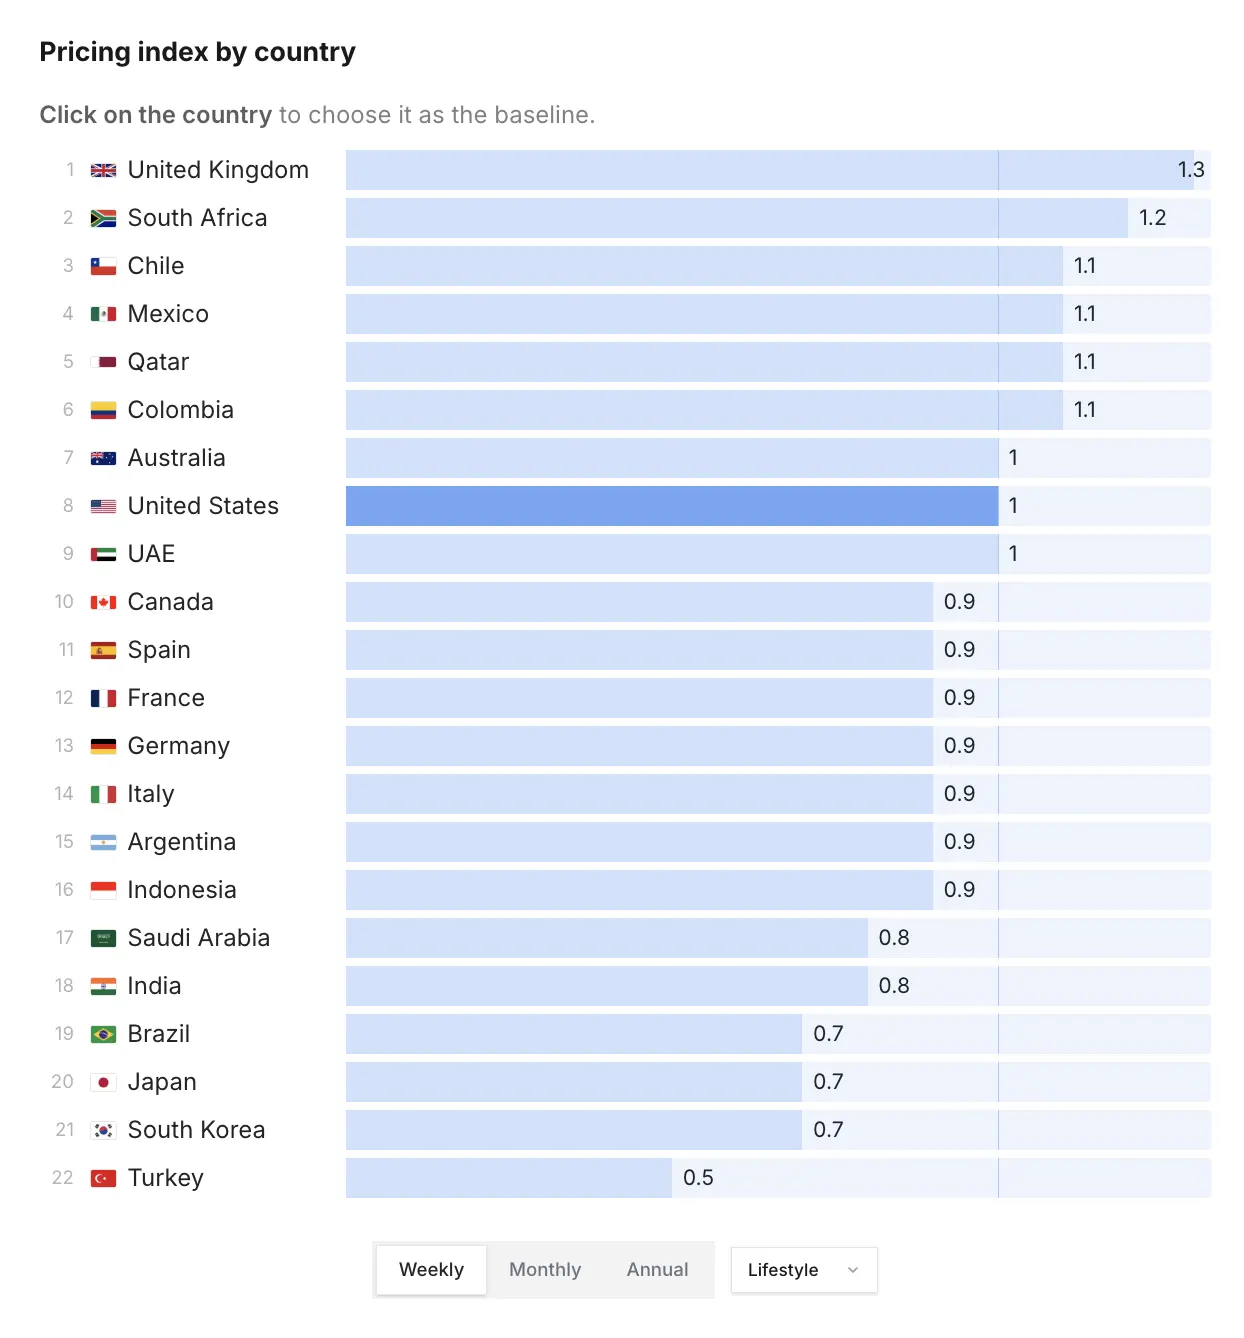
European apps charge 29-39% more than North American ones for equivalent subscriptions. Within Europe, the gap between high-willingness-to-pay markets (Germany, UK, France) and lower ones is substantial. Japan and Switzerland index high globally. Turkey, India, and Indonesia sit far below global medians.
Localization tests have the highest LTV win rate of any experiment type in the dataset: 62.3% of localization tests produce LTV uplift. If you're running a single global price, you're underpricing your best markets and pricing out users in emerging ones simultaneously.
The practical move: run localized pricing before you test anything else. It's lower-risk, faster to validate, and has the best hit rate in the data. A Lifestyle app with strong US and European distribution has a meaningful revenue gap to close just by pricing Germany and the UK correctly.
Which subscription plan type works best in Lifestyle?
Weekly plans now generate 55.5% of all subscription revenue across the App Store — up from 43.3% in 2023. Monthly plans lost nearly half their revenue share in the same period. Annual dropped too. Weekly didn't just grow; it cannibalized both simultaneously.
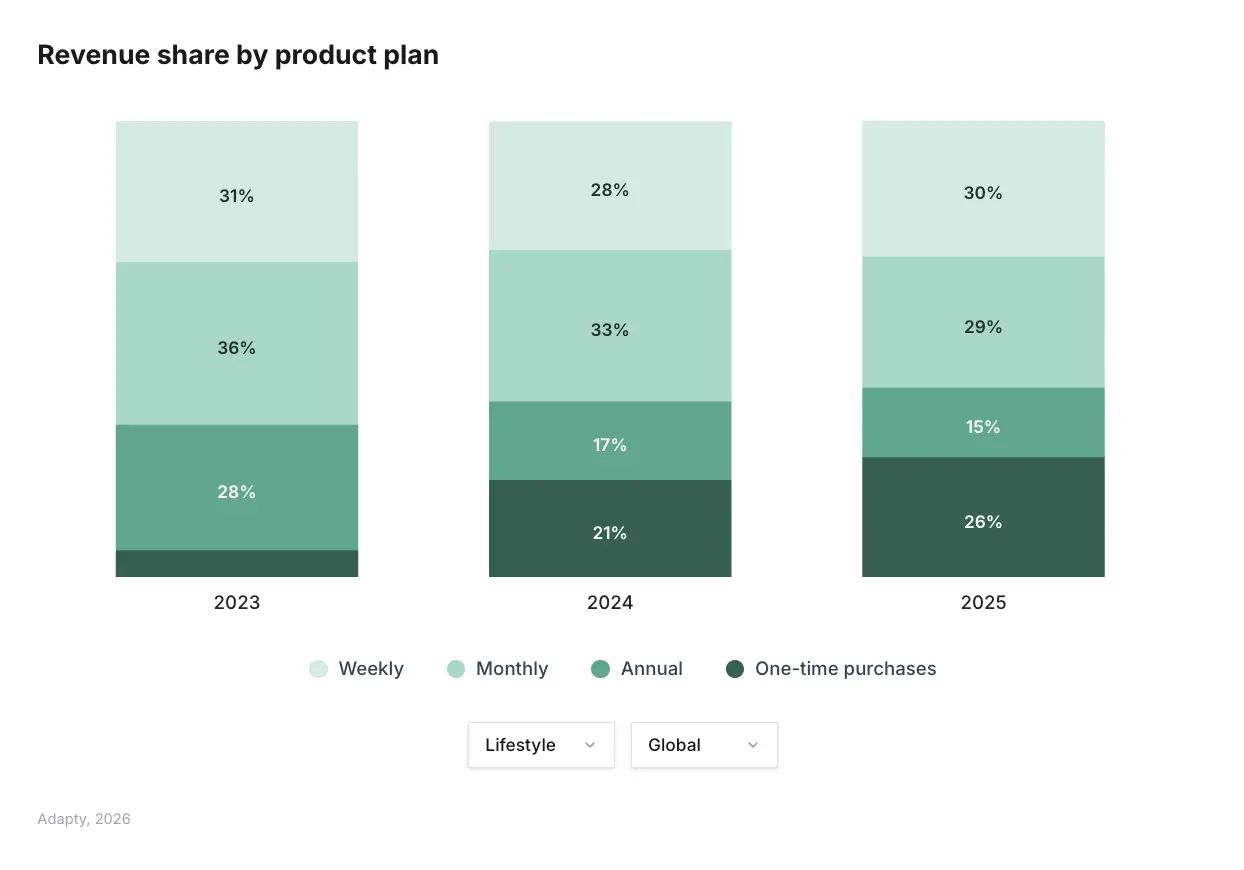
Lifestyle tells a more fragmented story. In 2025, weekly led at 31% of category revenue, but one-time purchases reached 26% — up from a smaller base in 2023, while monthly slid from 36% to 29%. That one-time purchase figure is worth sitting with. It fits the direct buyer thesis: Lifestyle users who commit do so decisively, and for a meaningful share of them, removing the recurring billing friction entirely is what gets them over the line.
Monthly still holds the strongest per-subscriber LTV in the category at $42.8 over 12 months — but its revenue share trend is moving in the wrong direction. The users who stick with monthly have already filtered themselves through purchase intent. The problem is that there are fewer of them each year.
Weekly plans with a trial generate the highest 12-month LTV of any paywall configuration. In Lifestyle, this combination runs backwards. A weekly trial in a habit-dependent app is low commitment layered on top of low commitment. The users most likely to start a weekly trial are the ones least likely to build the habit that justifies renewal.
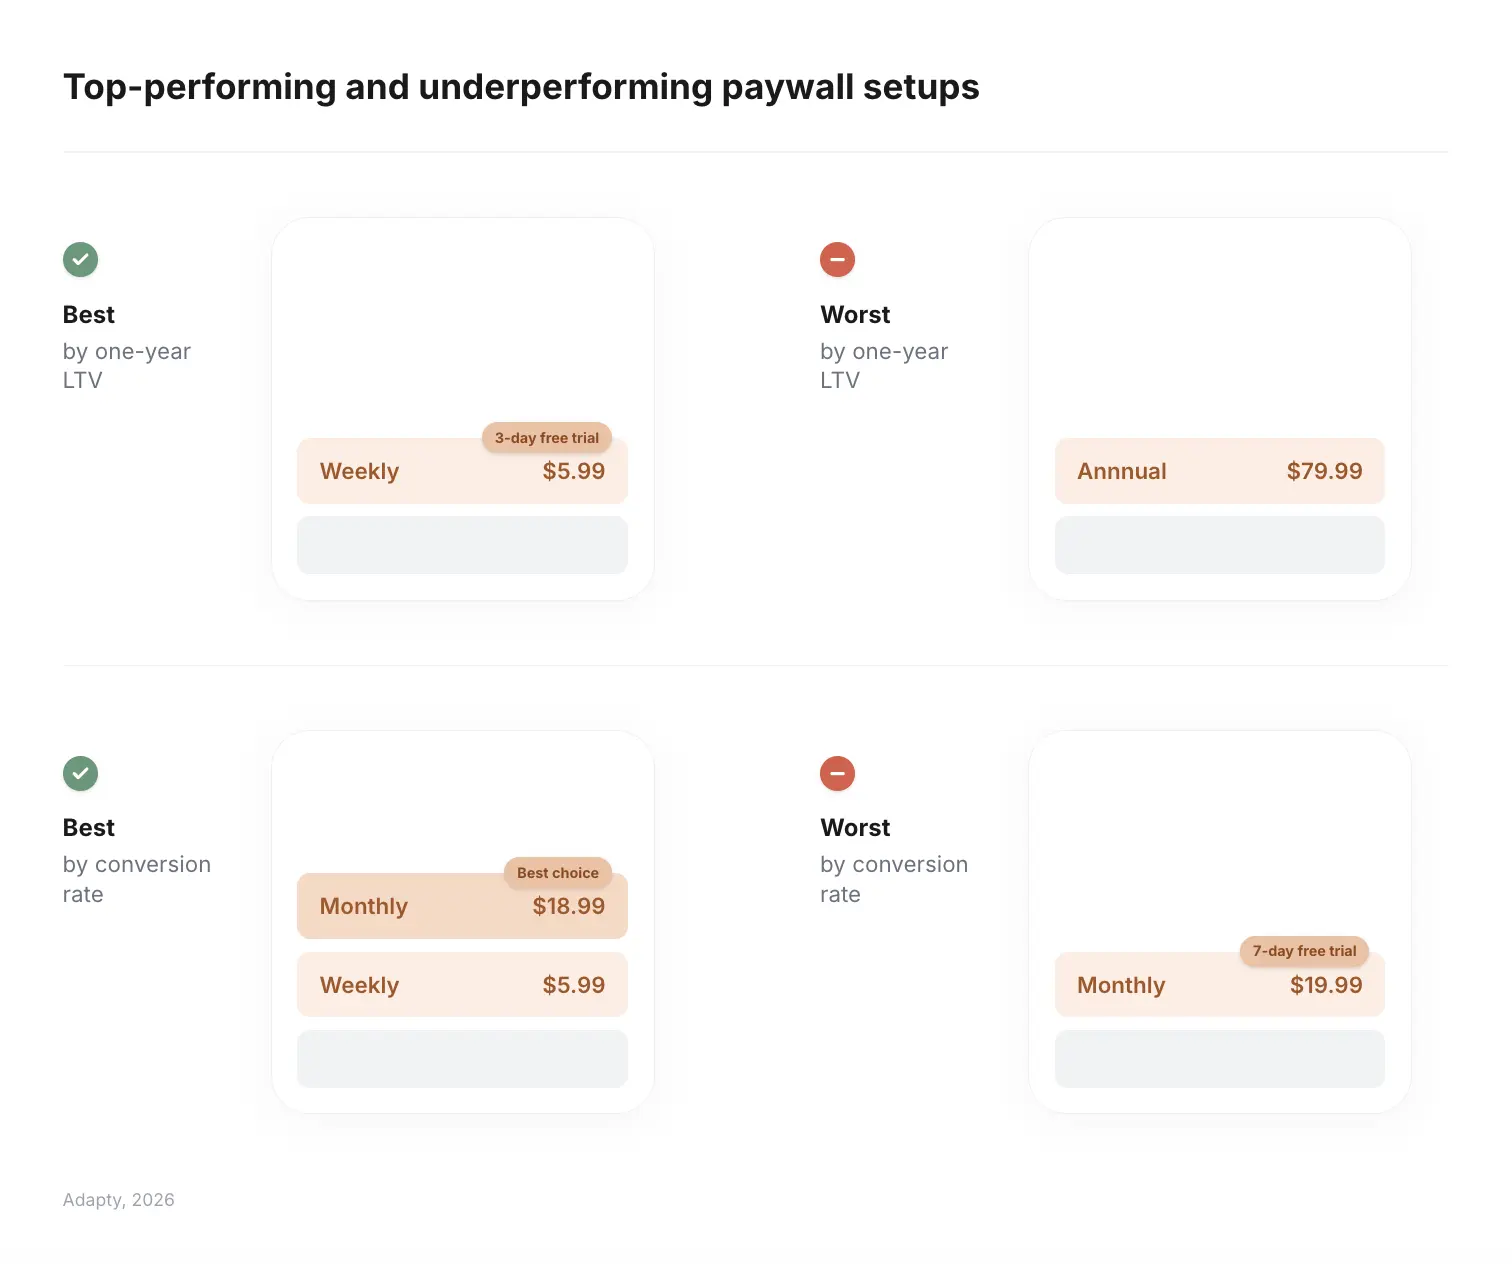
One nuance the data surfaces: the report's top-performing Lifestyle paywall by one-year LTV is a weekly plan with a 3-day free trial — not a no-trial setup. That sounds like a contradiction, but it isn't. A 3-day trial functions more like a low-friction direct purchase than a traditional trial. The commitment window is short enough that only users who are already motivated will start it, and the price is low enough to convert on intent rather than experimentation.
The trial users dragging down Lifestyle LTV by 21.2% are disproportionately coming from longer trials on higher-commitment plans — 7-day monthly trials, for instance, which the same data flags as the worst-performing setup by conversion rate. The bottom line: if you test a trial in Lifestyle, keep it short, keep the price low, and measure 12-month LTV — not Day 0 conversion.
Conversion benchmarks for Lifestyle apps
Install-to-paid (direct purchase, no trial) reaches 18-38% in Lifestyle and Productivity — among the highest direct conversion rates in the App Store. This is the metric to track if you're running a hard paywall setup, not install-to-trial.
The gap between Lifestyle's direct conversion ceiling and its trial conversion is meaningful. Install-to-trial rates stay below 12% in most categories, and converting trial users in Lifestyle requires building the habit that most trial users don't build. The 18-38% direct figure assumes a well-placed paywall and a clear value proposition in onboarding — it's not a baseline you can count on without work.
Day 0 is everything
Across all categories, 89.4% of trial starts happen in the first session. For direct purchases, the same first-session dominance applies. Users decide on Day 0 or not at all. Days 1-3 account for 2.0% of trial starts across the dataset — a rounding error.
For Lifestyle apps running a direct purchase setup, this means onboarding is your monetization strategy. The paywall needs to land in the first session, after the user has experienced enough of the core value proposition to commit. A well-timed in-onboarding paywall with a clear, direct purchase offer is the setup that the data supports.
| Benchmark | Figure |
| Install-to-paid (direct), Lifestyle | 18-38% |
| Install-to-trial (all categories) | <12% in most cases |
| Trial starts on Day 0 (all categories) | 89.4% |
| North America install-to-trial | 14.5% |
| Global median install-to-trial | 11.2% |
| Hard paywall LTV vs. soft paywall | +21% for hard paywall |
What does retention look like in Lifestyle?
Retention in Lifestyle follows the same structural logic as everything else in the category: users who committed upfront stay longer than users who didn't. The data shows trial subscribers retain 1.4-1.7x better than direct buyers at first renewal across all categories — but in Lifestyle, where your trial cohort is lower-quality by definition, this retention advantage shrinks or disappears.
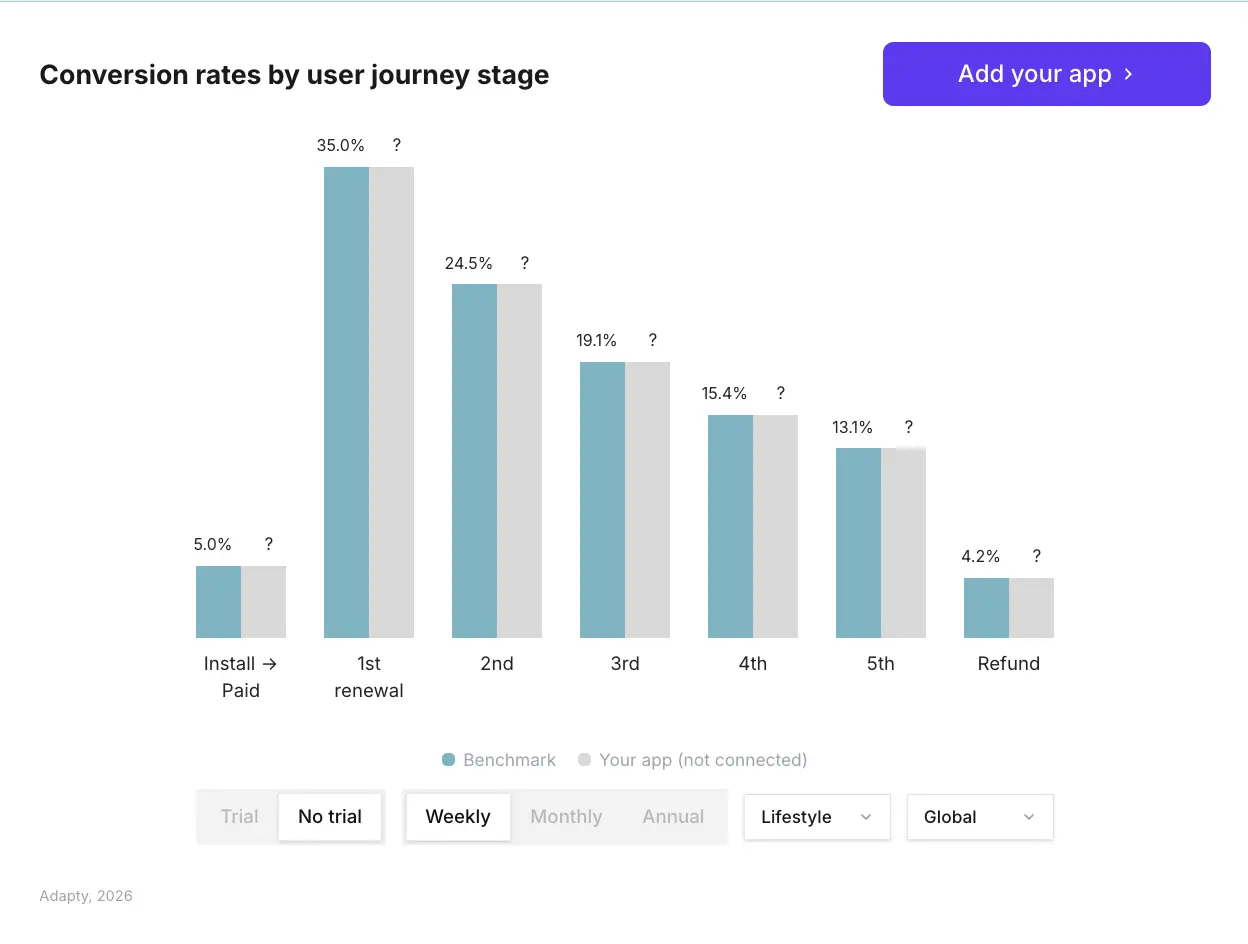
The broader renewal curve across all categories shows the steepest churn happening at first renewal. In Lifestyle, getting a subscriber past that first renewal is the critical threshold — and the users most likely to make it are your direct buyers.
| Renewal event | Global average retention (all categories) |
| 1st renewal | 59.2% |
| 2nd renewal | 45.1% |
| 3rd renewal | 37.1% |
| 4th renewal | 31.6% |
| 5th renewal | 27.6% |
Plan type is the biggest driver of retention variance — region matters far less. The gap between best and worst region (4.1 percentage points) is dwarfed by the plan-type gap (15+ percentage points). Annual subscribers retain at 19.9% at Day 380; weekly subscribers at 5.5%. Monthly sits at 14.2% at the same point.
For Lifestyle apps, where habit formation determines whether a user sticks, annual plans have a structural advantage: users who commit to a year are already past the motivation-testing phase. The challenge is getting them there in the first place — which is why pricing, framing, and onboarding matter more in Lifestyle than in most categories.
AI Lifestyle apps are the fastest-growing subcategory in the App Store
Lifestyle AI apps grew 691% year-over-year in 2025 — the highest growth figure of any AI subcategory in the SOIS 2026 data, ahead of Graphics & Design AI (202%) and Utilities AI (174%).
The AI dynamic changes some of the Lifestyle-specific rules. AI-powered apps convert into trial at roughly half the rate of average apps — 5.31% install-to-trial versus 10.92% for the broader market, but they get 14% more direct purchases. Users approaching an AI app arrive with higher intent. They're more likely to pay outright, which aligns with the direct purchase setup that already makes sense in Lifestyle.
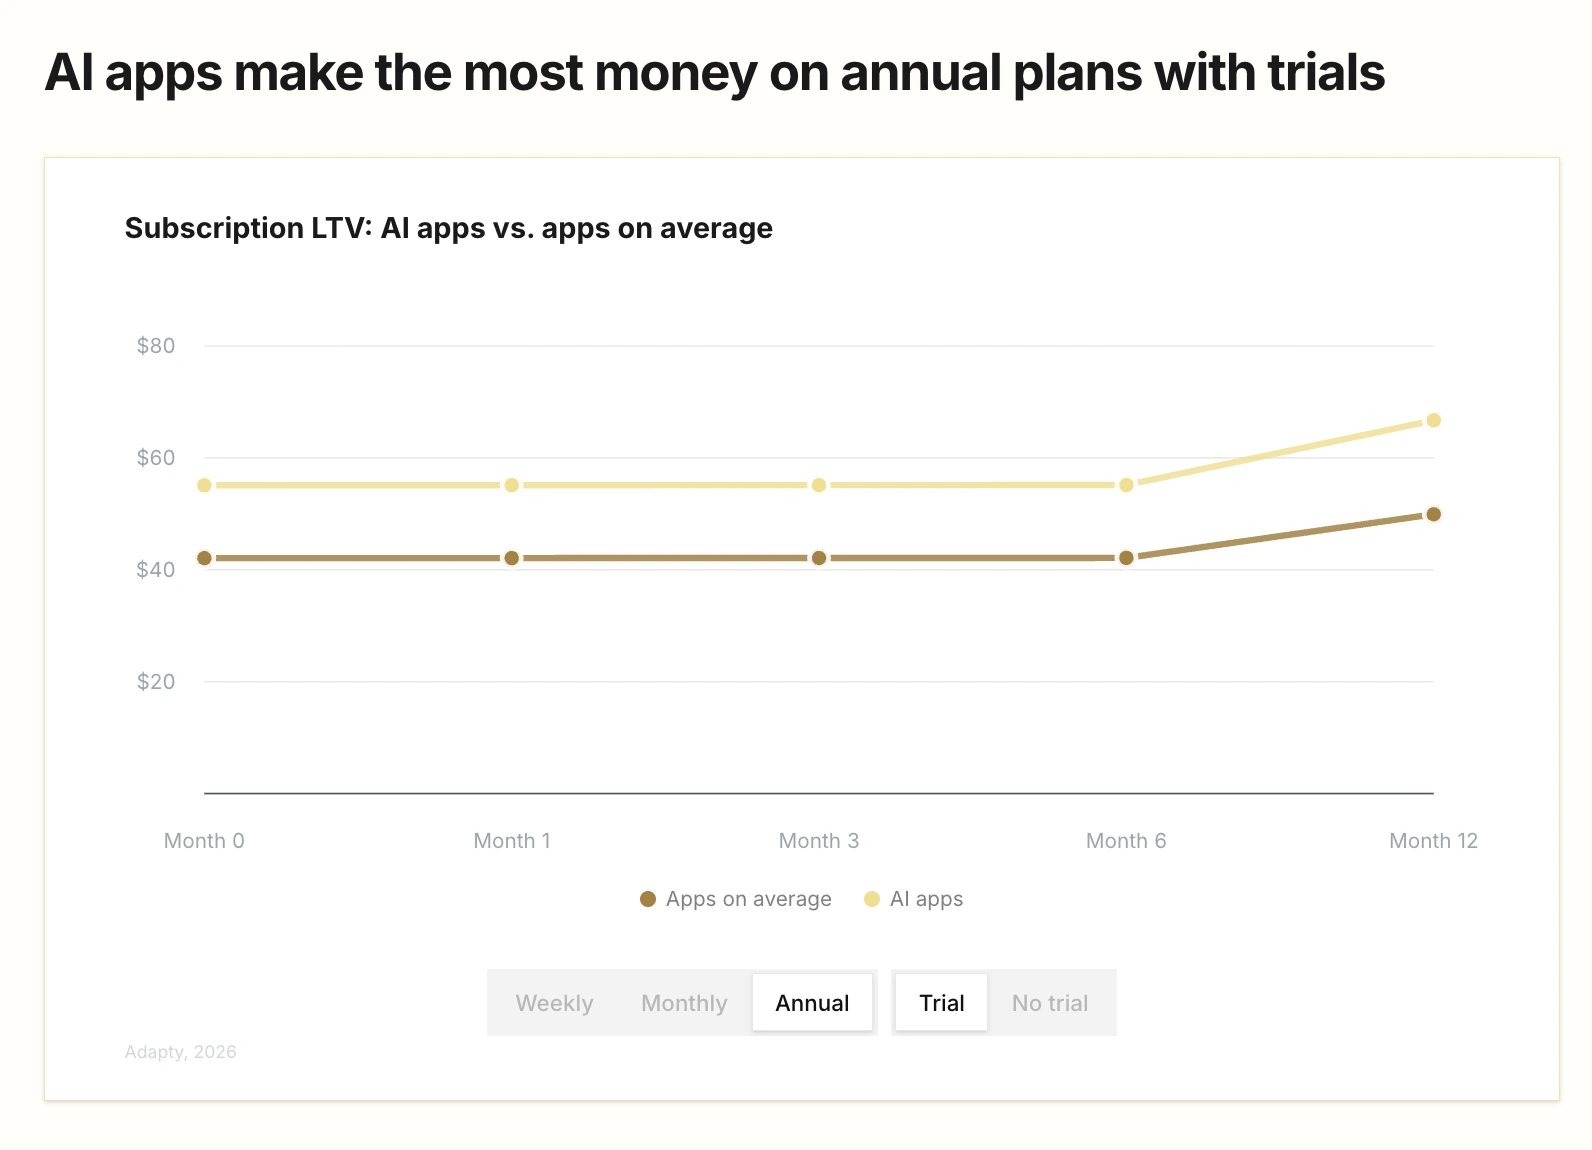
Where AI apps pull ahead is on LTV. Annual plans with trials generate $66.70 in one-year LTV for AI apps versus $49.92 for average apps across all categories. AI apps charge more, retain differently, and outperform on the 12-month number. If you're building an AI-powered Lifestyle app, the standard Lifestyle benchmarks are a floor, not a ceiling.
The supply-side caveat applies. AI lowered the cost of building apps dramatically, which means new entrants flooded Lifestyle AI faster than demand expanded. The concentration dynamic in Lifestyle — already extreme — is likely tightening further in the AI subcategory. Extraordinary growth at the top, more competition everywhere else.
The experimentation gap separating top Lifestyle apps from everyone else
Apps running 50+ experiments earn 18.7x more than apps running just one. The average experiment count among top-performing apps is 14.7 per year. These aren't teams running more clever tests — they've built the infrastructure to iterate fast without app store reviews slowing them down.
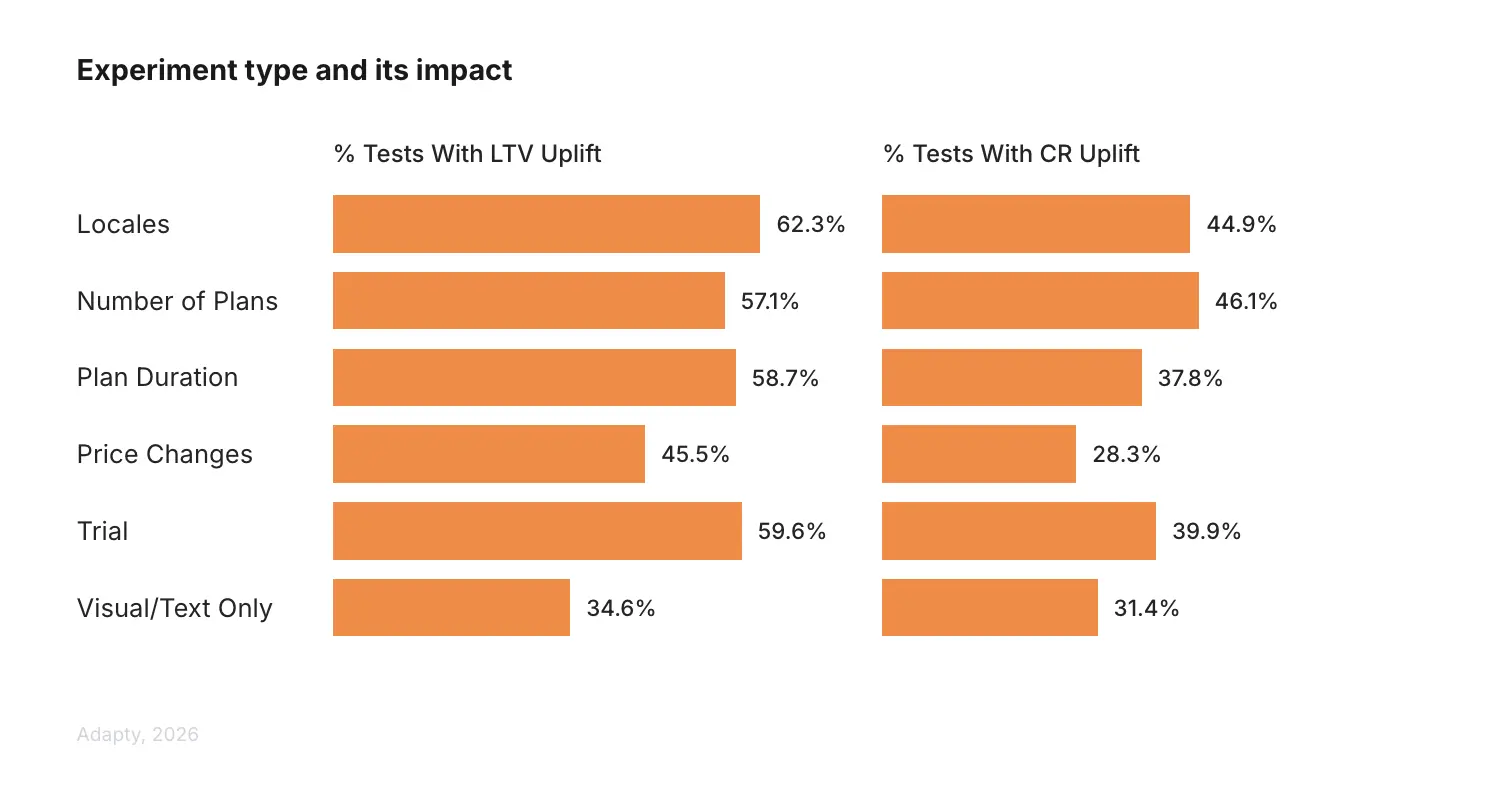
Experiment win rates by type across all categories: localization (62.3% LTV win rate), trial changes (59.6%), plan duration (58.7%), number of plans (57.1%), price changes (45.5%), visual/copy only (34.6%). For Lifestyle, localization, and plan structure tests should take priority. Visual and copy tests have the lowest win rate of any experiment type.
The experimentation velocity gap is the most actionable finding in the concentration data. The top 10% aren't just better at picking experiments — they're running more of them, faster. If you're shipping fewer than one test per month, you're not operating at a pace that compounds.
Which regions should Lifestyle apps prioritize?
North America remains the highest-value region for subscription revenue, with install LTV running roughly 2x the global average. For Lifestyle specifically, the US user base skews toward apps with strong habit-formation mechanics — meditation, journaling, wellness planning — where the category's top performers are concentrated.
Europe held steady in revenue share while North America dropped 3 percentage points since 2023. European apps charge 29-39% more than North American apps — and the top three European countries outperform the US in median LTV. If you're building a Lifestyle app with global ambitions, Europe deserves localized pricing and targeted acquisition, not a one-size-fits-all strategy.
Japan, Mexico, and Turkey are among the fastest-growing app markets in 2025. For Lifestyle categories tied to wellness culture — mindfulness, digital detox, nutrition — Japan in particular represents an underserved market with high willingness to pay relative to market penetration.
MEA top countries lead across all regions in average LTV, though the market is smaller. LATAM top countries see 35% lower LTV than European ones — a meaningful gap that warrants a distinct regional pricing and acquisition strategy rather than applying European benchmarks.
In the broader market context, Lifestyle apps are entering
31% more subscription apps were launched in 2025 than in 2024. The median monthly revenue per new app dropped 22% year-over-year, from $627 to $492. 57.7% of new subscription apps never cross $1,000 in total revenue.
In Lifestyle, these figures are worse than average because concentration is more extreme. The 2.1% of revenue available to the bottom 90% of Lifestyle apps gets divided among more entrants every year.
Below $100K in annual subscription revenue, most challenges in this category aren't pricing or paywall problems — they're product-market fit problems. No paywall optimization rescues an app that doesn't build genuine habits. The data doesn't care how well-designed your direct purchase flow is if users aren't finding the core product compelling enough to stay.
Above $100K, the monetization levers start to matter: localization tests, plan structure, paywall placement, experimentation velocity. That's when the benchmarks in this article become operational, not directional.
Get your benchmarks
The benchmarks in this article give you the category baseline. The SOIS 2026 report lets you go further — filter by region, plan type, and country to see exactly where your app sits relative to the market.