

Renight

AI Video
Highlights
- US ROAS was nearly 4x higher on 32% less spend
- Cost per paid user dropped 73%
- Active markets scaled from 11 to 34 in the first month
- Payback window collapsed from 2-3 months to break-even inside Week 1
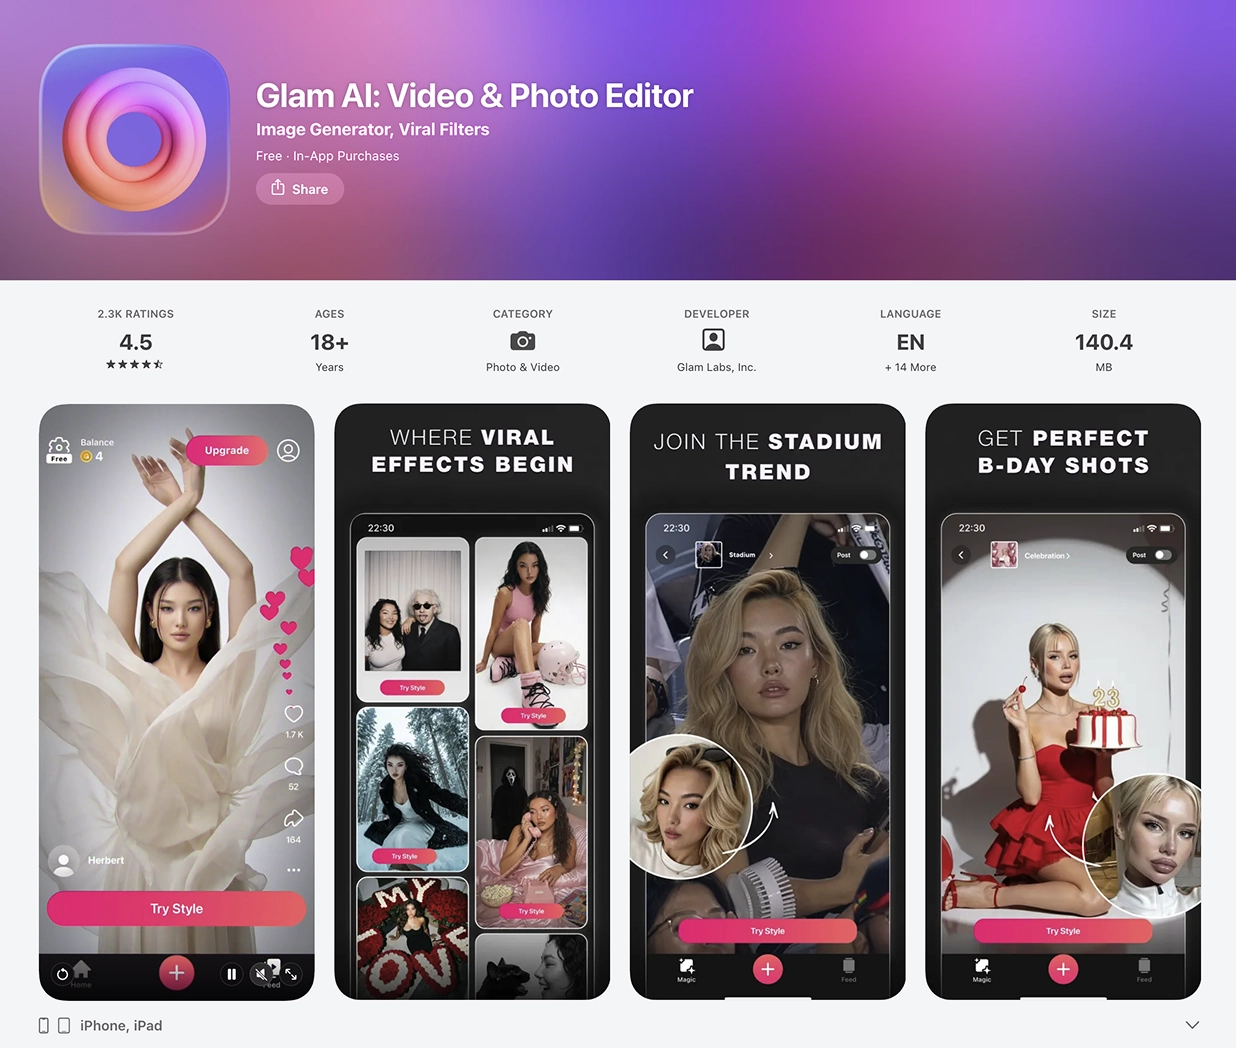
Glam AI is a top 5 App Store photo and video editor app with 2M+ monthly active users and $55M projected ARR in 2025. The team operates a multi-surface growth engine: Web-to-web funnels account for a significant share of revenue, while App Store distribution carries the other half. The App Store channel was running at $80K/month by mid-2025.
Why Ads Manager at $80K/month is a different job than Ads Manager at $6K/month
Glam AI scaled Apple Ads spend 13x in 2025. The team built the channel from the ground up while shipping products, expanding markets, and growing the broader business. By mid-2025, install volume looked healthy, and the campaign portfolio was running across 11 markets.
Net revenue stopped scaling at the same rate. On install day, every dollar spent came back as $0.46. Breakeven didn’t happen until Day 61-92, two to three months of negative cash flow on every dollar invested before seeing any return.
Teams running Apple Ads at this spend tier hit the same patterns. The setup that gets you from $6K to $30K in monthly spend stops scaling cleanly past a certain point: broad match keywords reach competitor audiences, brand searches go uncaptured in some countries, and bid decisions run on install-level metrics instead of subscription revenue.


The audit: Where the budget was going
Before the engagement started, Ads Manager for Apple Ads surfaced three structural patterns in the account.
Pattern 1: Broad match absorbing competitor traffic
The non-brand search cluster absorbed nearly half the monthly budget, the highest-impact area for redistribution. The keyword ‘glam ai video photo editor’ in the US accounted for around $11K of monthly spend, much of it surfacing on adjacent search intent rather than direct intent for Glam AI. At the keyword level, this kind of pattern is straightforward to redirect — it just isn’t visible in Apple’s aggregate view.
Pattern 2: Strong markets underinvested, weak markets oversubsidized
In several markets, Apple Ads accounted for only 3-7% of revenue despite strong overall ROAS — a sign the channel was underinvested where it was already working. Brand coverage ran through a single multi-storefront campaign with a limited daily budget, while competitors bid on Glam AI’s brand terms across those same markets.
Pattern 3: No keyword-level revenue signal
Bid decisions ran on Apple’s native dashboard with its multi-day reporting lag and install-level metrics. At $80K/month, optimizing toward installs means subscription revenue stays invisible until it’s too late to act on.
The rebuild: What changed in the first 30 days
Glam AI brought in Adapty for Apple Ads management — combining the Ads Manager for Apple Ads tool with a dedicated managed service. Adapty launched the engagement within days of signing.
The first priority was to spend efficiently. Negative keyword lists went live on day one through Apple Ads Manager’s rule-based automation. Broad match terms were restructured, redirecting roughly $16K/month toward higher-performing segments.
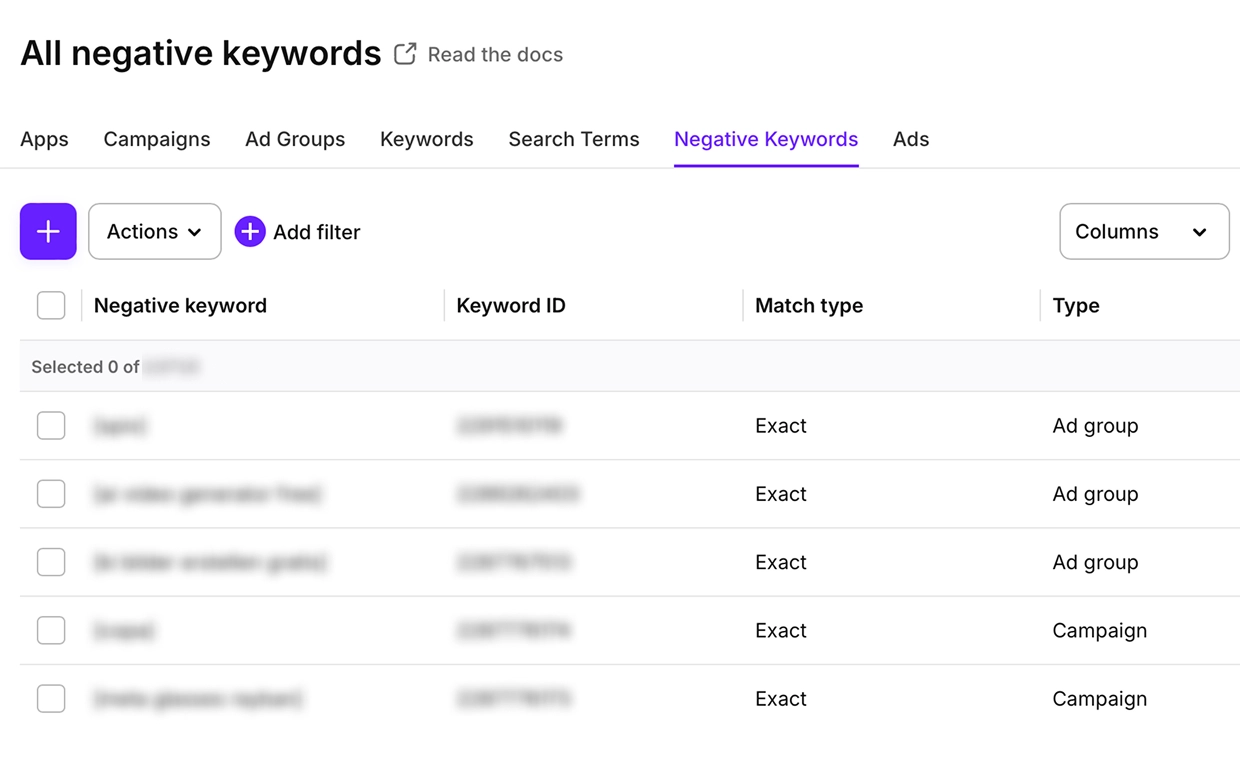
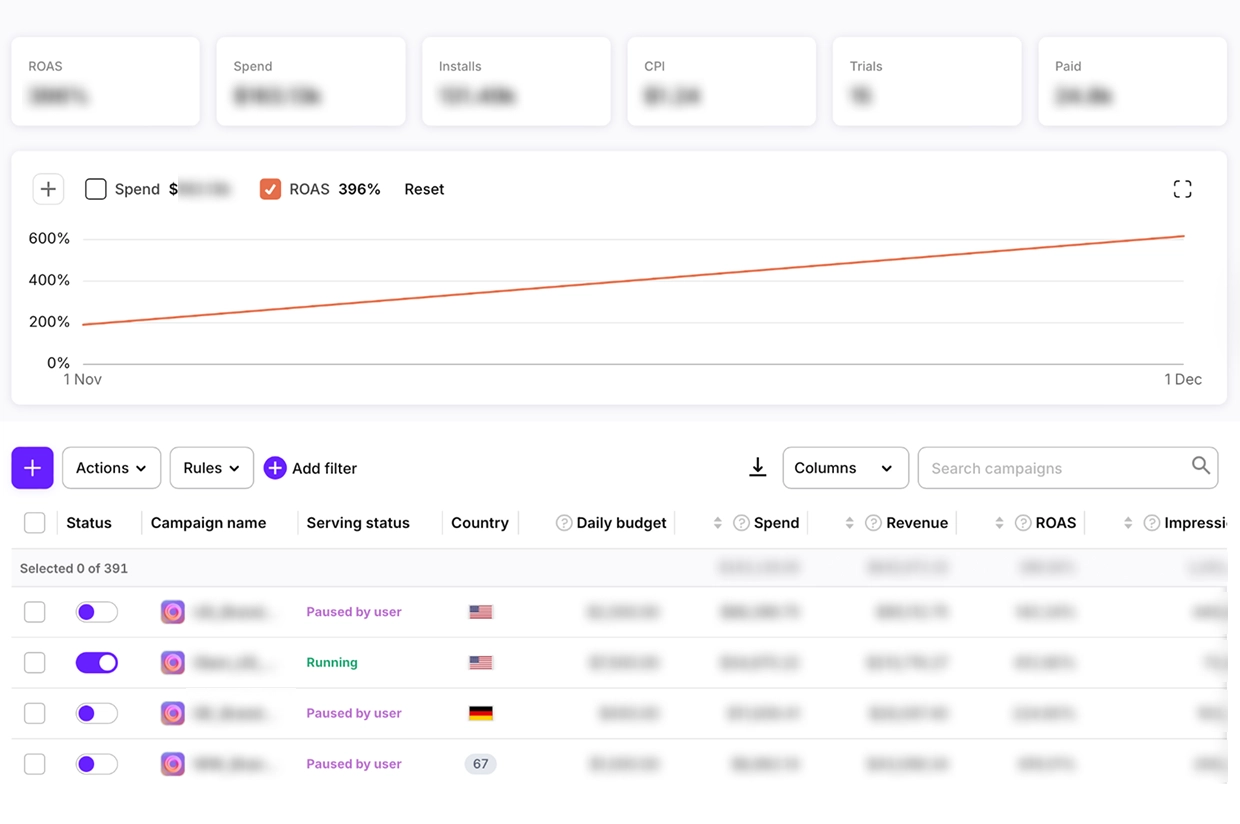
Second: rebuild the campaign portfolio. The team rebuilt the campaign portfolio from 23 mixed campaigns to 100+ granular ones, each built around a specific country and campaign type: brand, generic, competitor, and discovery. Automation handled SOV bidding, ROAS-based scaling, and budget reallocation continuously, with bid decisions running on keyword-level revenue data updated in real time.
Third: market expansion. The team used Market Intelligence to identify countries where competitor apps were already running Apple Ads with strong impression share — a signal that user intent and App Store demand existed, but Glam AI had no presence.
Markets like Turkey, Kazakhstan, the Czech Republic, and the Netherlands fit this profile: active competitor activity, no Glam AI campaigns, and historically lower CPT bids compared to competitive markets. Each new market launched with a controlled budget and scaled automatically once ROAS thresholds cleared in the Overview dashboard. Active markets expanded from 11 to 34.
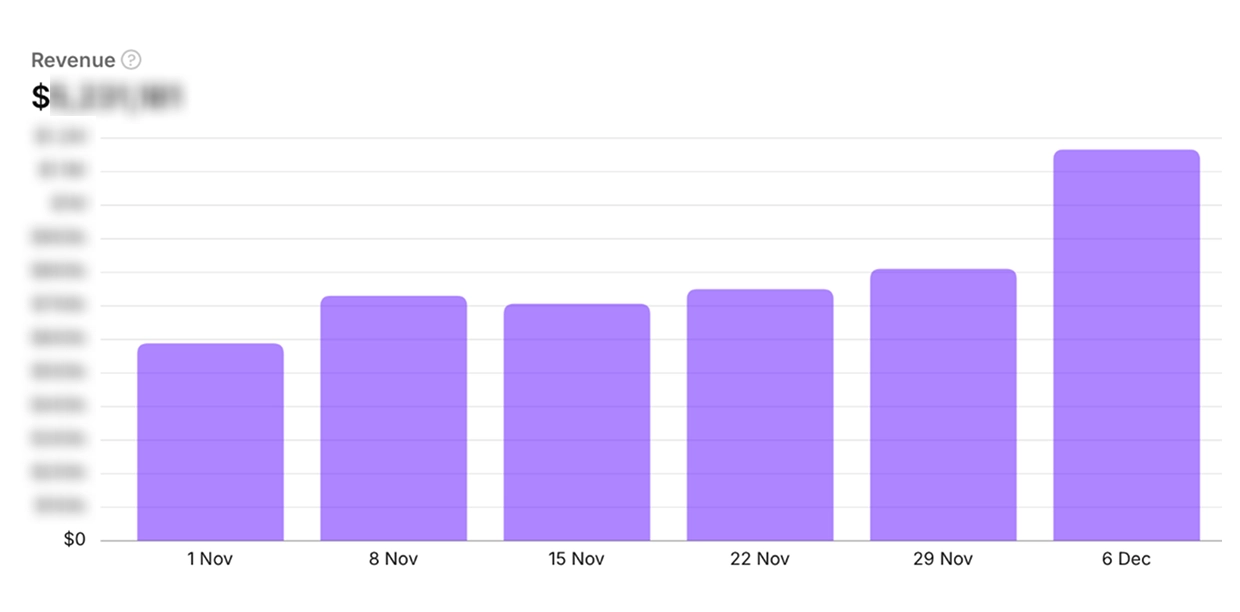
30 days in: 3x net revenue on 5.5% less spend
On nearly the same budget, the results shifted across every metric:
ROAS held across every cohort window from Day 0 through Day 92, not a one-time spike on install day. The US market saw ROAS nearly quadruple on 32% less spend, with the install-to-paid rate more than doubling. Turkey, Kazakhstan, the Czech Republic, and the Netherlands delivered strong returns that country-level campaigns made visible for the first time.
What teams spending $20K+/month on Apple Ads should take from this
Country-level granularity matters past a certain spend threshold. Multi-storefront campaigns group your best and worst markets together, making it impossible to optimize either.
Non-brand performance typically carries 30-50% of spend in low-converting segments until you audit keyword by keyword. Aggregate ROAS looks fine one level up.
Subscription economics and install metrics diverge as campaign complexity grows. LTV-based bidding outperforms CPI-based bidding once a portfolio crosses that threshold.