Price Radar
Find the markets where you can charge more
Compare your pricing and conversion rates against apps
in your sub-category, filtered by country.
Loading Price Radar…
Sign up to see the full dataset
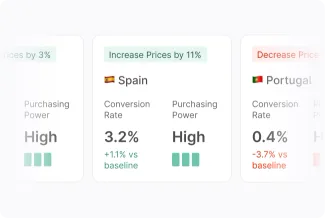
Conversion benchmarks for 60+ countries. See if your paywall beats (or loses to) competitors in every market you operate in.
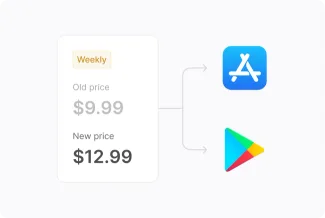
One-click price changes. Adjust pricing and push updates directly to the App Store. No spreadsheets. No manual work.
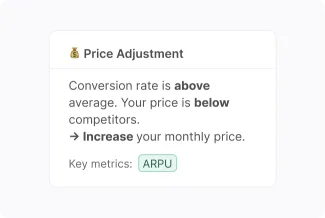
Know the impact before you ship. Get conversion-aware recommendations so you’re not guessing if a price change will work.


A pricing reality check before you scale
Adapty Price Radar helps you validate pricing before launch, price changes, or market expansion.


The pricing data App Store doesn’t show you
Country-specific conversion benchmarks you won’t find anywhere else
Understand whether your price converts above or below market expectations.
Your price vs real competitors
See how you compare against apps in your sub-niche in each country.
Clear market position
Spot underpricing, overpricing, and missed revenue opportunities fast.
Find your additional revenue in 4 clicks
- 1
Add your app
Paste your App Store link. We detect your pricing automatically.
- 2
Pick countries
Analyze any market you operate in — or plan to enter.
- 3
Review competitors
Confirm or adjust the apps you want to benchmark against.
- 4
See your position
Get a clear view of how your pricing and conversions compare in that market.
Join 30,000+ apps already benchmarking their pricing
$3B
revenue analyzed
105K
paywalls compared
500M+
transactions validated
Grow faster with Adapty Autopilot
The free analysis shows where your pricing stands. Autopilot helps you fix it across markets without spreadsheets, guesswork, or manual App Store work.
- Benchmarks, visuals, and comparisons for every country you operate in.
- Conversion-aware insights that explain the impact before you act.
- Adjust prices, run tests, and ship changes directly from the product.
FAQ
Frequently asked
Global medians in 2025: $7.48/week, $12.99/month, $38.42/year. But “good” depends on your tier — high-price weekly apps generate 5.2x more revenue per install than low-price ones, because the conversion drop doesn’t offset the revenue gain. Annual plans offer a 75% discount vs 12 months of monthly on average. Pricing also varies by region: Europe charges 29–39% more than North America across all plan types.
Yes. Regional pricing differences are significant and growing. Europe charges 29–39% more than North America across all plan types. MEA has a compressed pricing range where budget apps charge 88% above global while premium apps price 49% below. Locale testing delivers the highest LTV uplift of any experiment type (62.3%), beating price changes (45.5%) and even trial testing (59.6%). One global price means you’re overcharging some markets and undercharging others.
Compare against the percentile benchmarks in the report. We break down pricing by p10 through p90 for every combination of plan type, category, and region. If you’re below p25, you’re likely underpricing — higher-priced apps consistently generate more revenue per install (up to 5.2x at the top tier). If you’re above p75 and conversion is struggling, price resistance may be real. The key metric is revenue per install, not conversion rate alone — a price increase that drops conversion 20% but lifts ARPU 40% is a net win.
For real-time, app-level competitive pricing intelligence, Adapty’s Price Radar tool tracks what specific apps charge across countries and plan types.
In App Store Connect, go to your app’s Pricing and Availability section. For subscriptions, you can set custom prices per country or region — Apple provides pricing tiers in local currencies, and you can override the auto-generated prices with your own. Google Play Console works similarly under Monetize → Products → Subscriptions. Both stores suggest local prices based on exchange rates, but those defaults often miss the mark. Use Price Radar to figure out what you should charge in each market first, then set those prices in your store dashboard.
At least once a quarter for your key markets. Exchange rates shift, competitors change their pricing, and purchasing power fluctuates — what worked six months ago might be costing you conversions today. If you’re expanding into new countries or running paywall experiments, check more frequently. Price Radar makes this fast — run a new analysis anytime to see if your pricing still aligns with the market or if there are new opportunities you’re missing.





Grow your app revenue with Adapty
No credit card required.
