In-app subscription benchmarks for Entertainment apps
TL;DR:
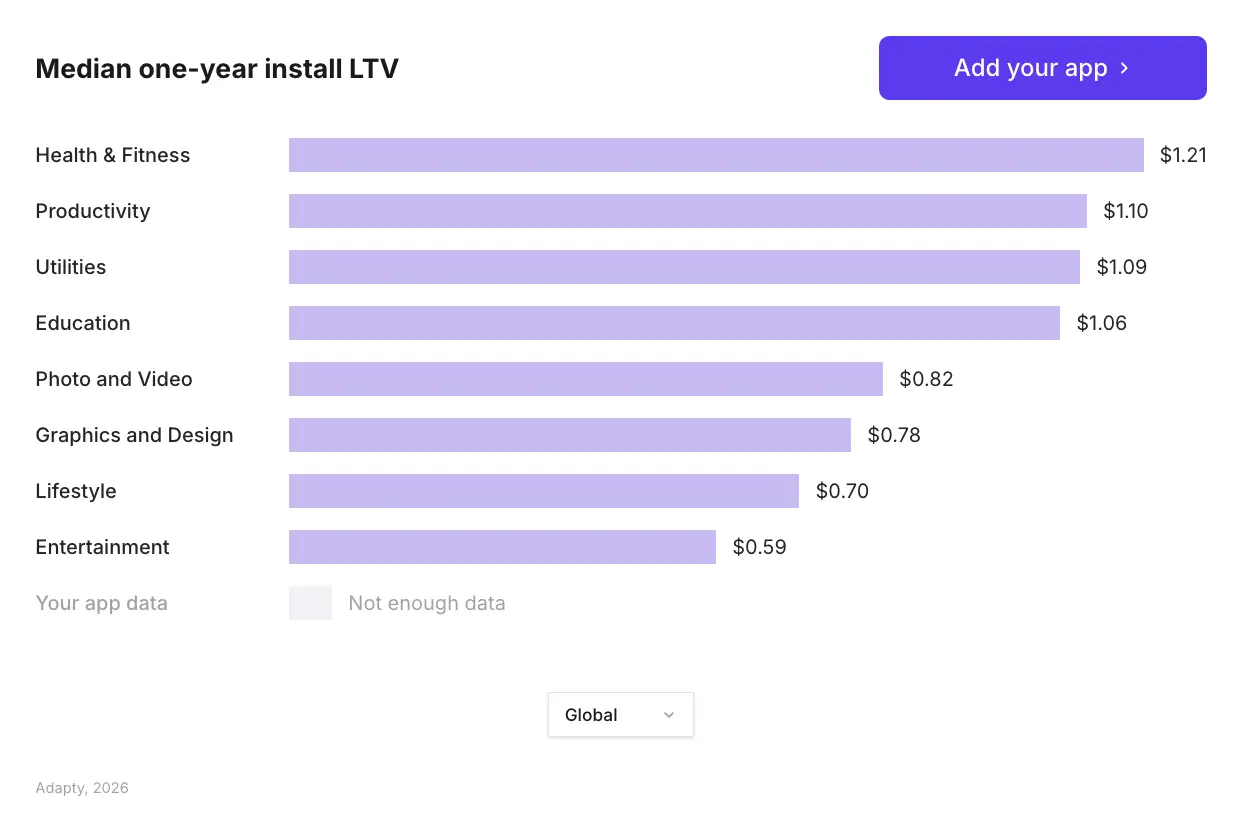
- Entertainment apps have the lowest install LTV of any category at $0.59 — less than half of Health & Fitness ($1.21).
- Trial-to-paid conversion sits at 19.1%, the weakest in the report. But that doesn't mean trials are wrong for Entertainment — it means most apps are running them badly.
- Weekly plans dominate Entertainment revenue. Direct buyers outperform trial users for LTV, which is unusual and worth examining.
- Monthly pricing is the most dangerous choice in Entertainment: low-priced monthly apps retain 2x better than high-priced ones, and the penalty for getting it wrong is steep.
- On Android, Entertainment is the only category where monthly install-to-paid conversion has reached parity with iOS — an early signal worth paying attention to.
What the Entertainment category looks like in 2026
Entertainment apps are competing in one of the more unusual corners of the subscription market. They have high trial adoption, weekly plan dominance, and some of the lowest per-subscriber LTV figures in the dataset. They also sit in the middle of the revenue concentration table — 94.0% of all Entertainment subscription revenue goes to the top 10% of apps, slightly better than Lifestyle (97.9%), but still brutal for anyone outside that tier.
The category covers a wide range of apps: streaming-adjacent tools, short-form video, audio fiction, games, adjacent content, fan communities, and interactive stories. That breadth makes benchmarking harder than in a focused category like Utilities. But the patterns in the data are consistent enough to be useful.
This article pulls the numbers that matter for Entertainment specifically. Where you sit relative to these benchmarks tells you where to focus.
How does LTV benchmark across categories?
Install LTV is the single most useful number for UA decisions. It measures how much revenue a new install generates over 12 months, combining conversion rate with per-subscriber LTV into one figure. Entertainment sits at $0.59 — the lowest of the eight categories tracked.
A $0.59 install LTV means that for every dollar you spend acquiring a new user, you need a CPI well under $0.59 to turn a profit. In most mature markets — particularly North America — that math is hard. In most categories, North American install LTV runs roughly 2x the global average, which gives Entertainment apps in the US somewhat more room to work with. But the gap to higher-performing categories is still significant.
Should Entertainment apps offer trials?
Entertainment’s trial-to-paid conversion rate sits at 19.1%, the weakest in the report. The global average is 25.6%, so there is a 6.5 percentage point gap to close.
The SOIS 2026 data on this question is counterintuitive. Across most categories, trial subscribers generate higher LTV than direct buyers — trials act as a quality filter, attracting users who are genuinely exploring the product before committing. But Entertainment is in the group where direct buyers outperform trial users.
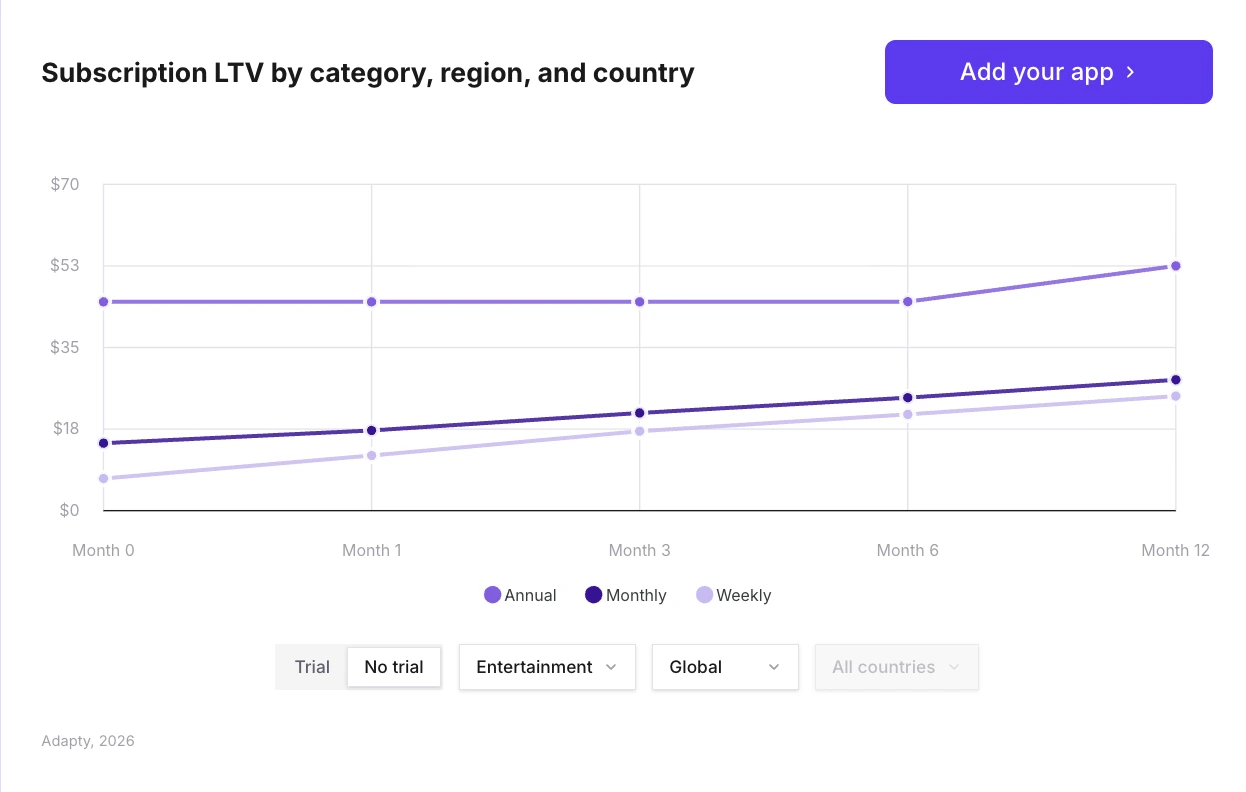
Productivity, Lifestyle, Entertainment, and Graphics & Design all show the same pattern: direct buyers are worth more than trial converts. In Productivity, that gap is wide — direct buyers are worth $56.95 vs $49.13 for trial users. The Entertainment gap is smaller but consistent.
There are two ways to read this. The pessimistic interpretation: trials in Entertainment attract low-intent users who sample content and churn before the first renewal. The more useful interpretation: Entertainment apps that offer trials are not doing enough within the trial window to create the habit that makes renewal feel obvious. The trial itself isn't the problem. The experience during it is.
The global trial-to-paid conversion benchmark is 25.6%. Entertainment at 19.1% is 6.5 percentage points below that. Closing half that gap — reaching 22%+ — would have a material effect on install LTV.
Which subscription plan type works best for Entertainment?
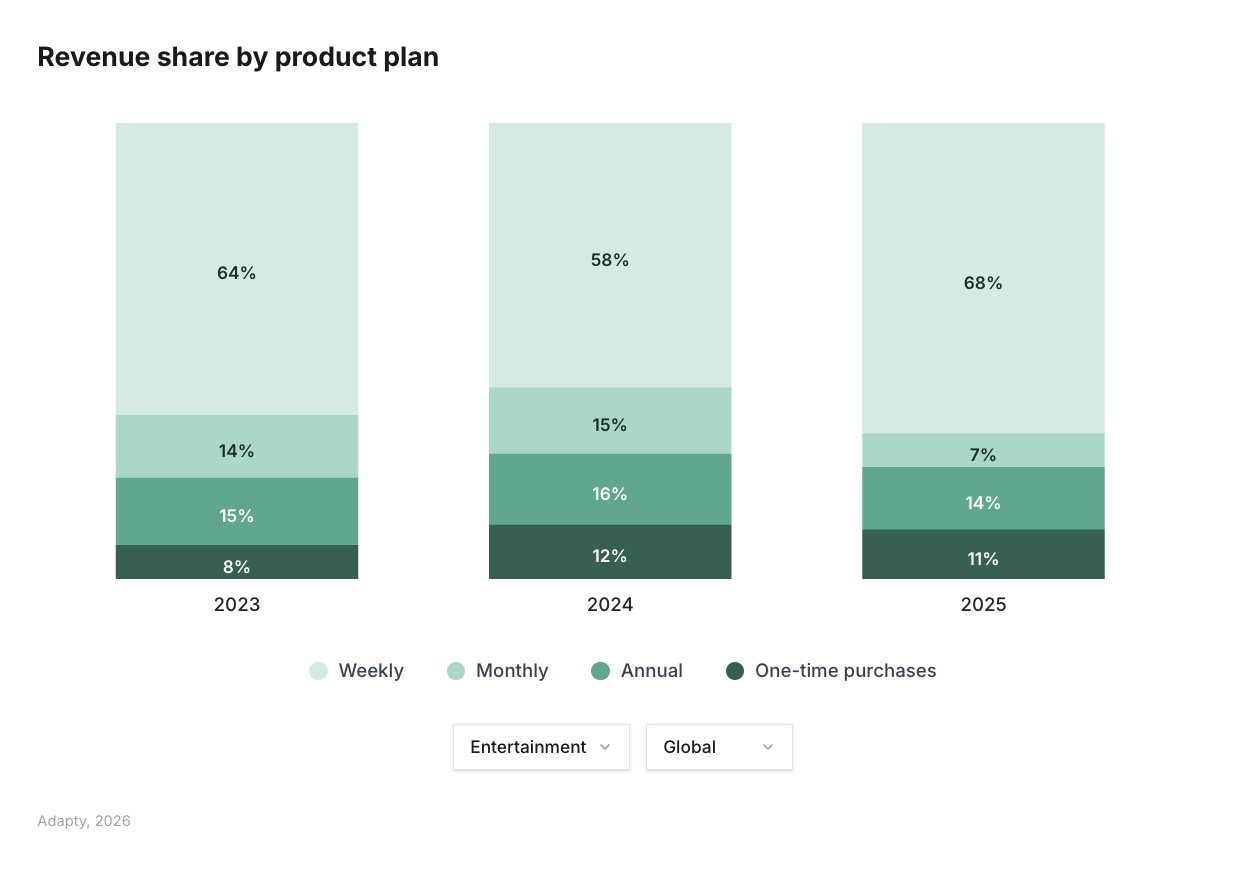
Weekly plans dominate Entertainment revenue, consistent with the broader market trend. Globally, weekly plans now generate 55.6% of all app revenue, up from 43.3% in 2023. Entertainment, alongside Utilities and Productivity, is among the categories where weekly plan revenue share is highest.
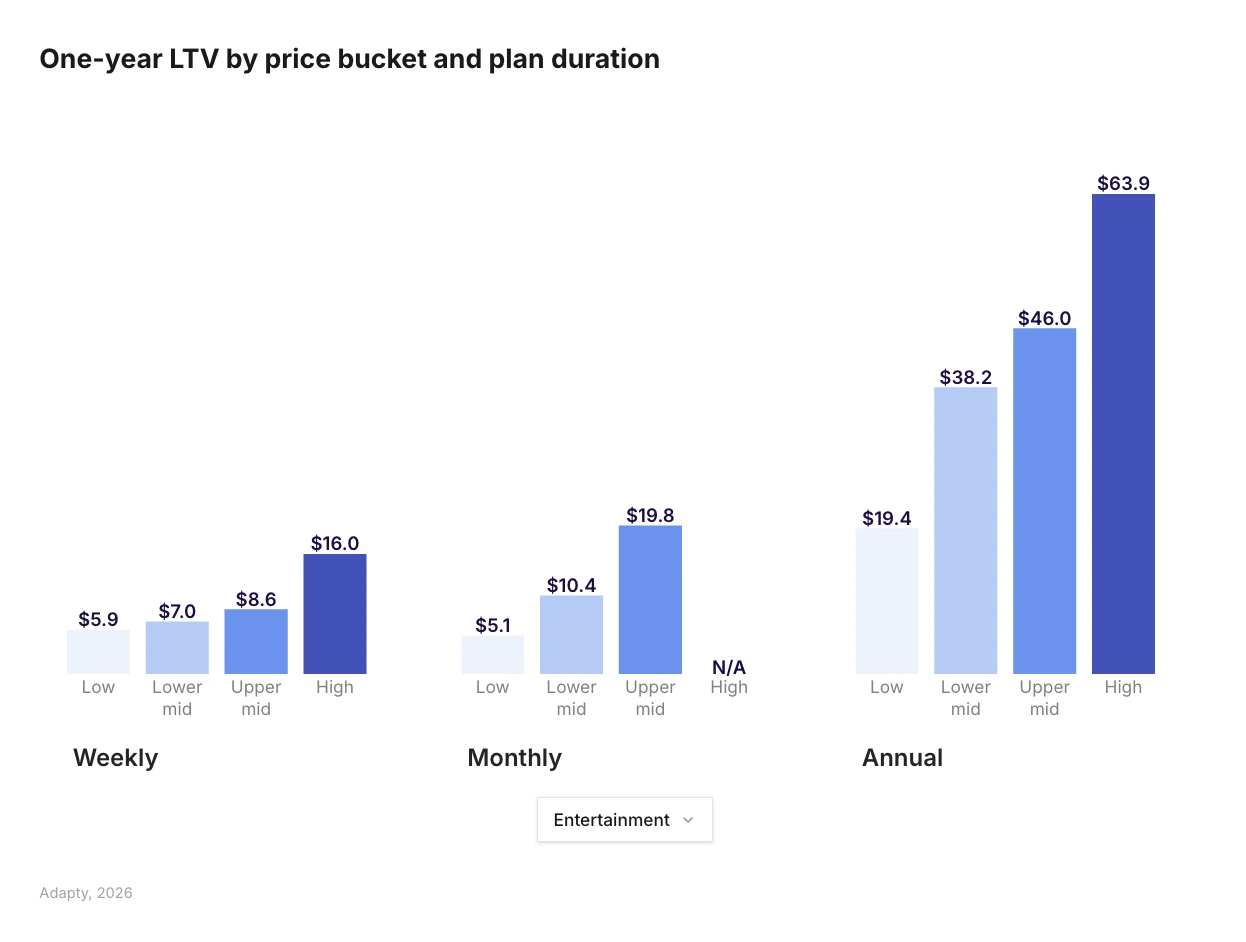
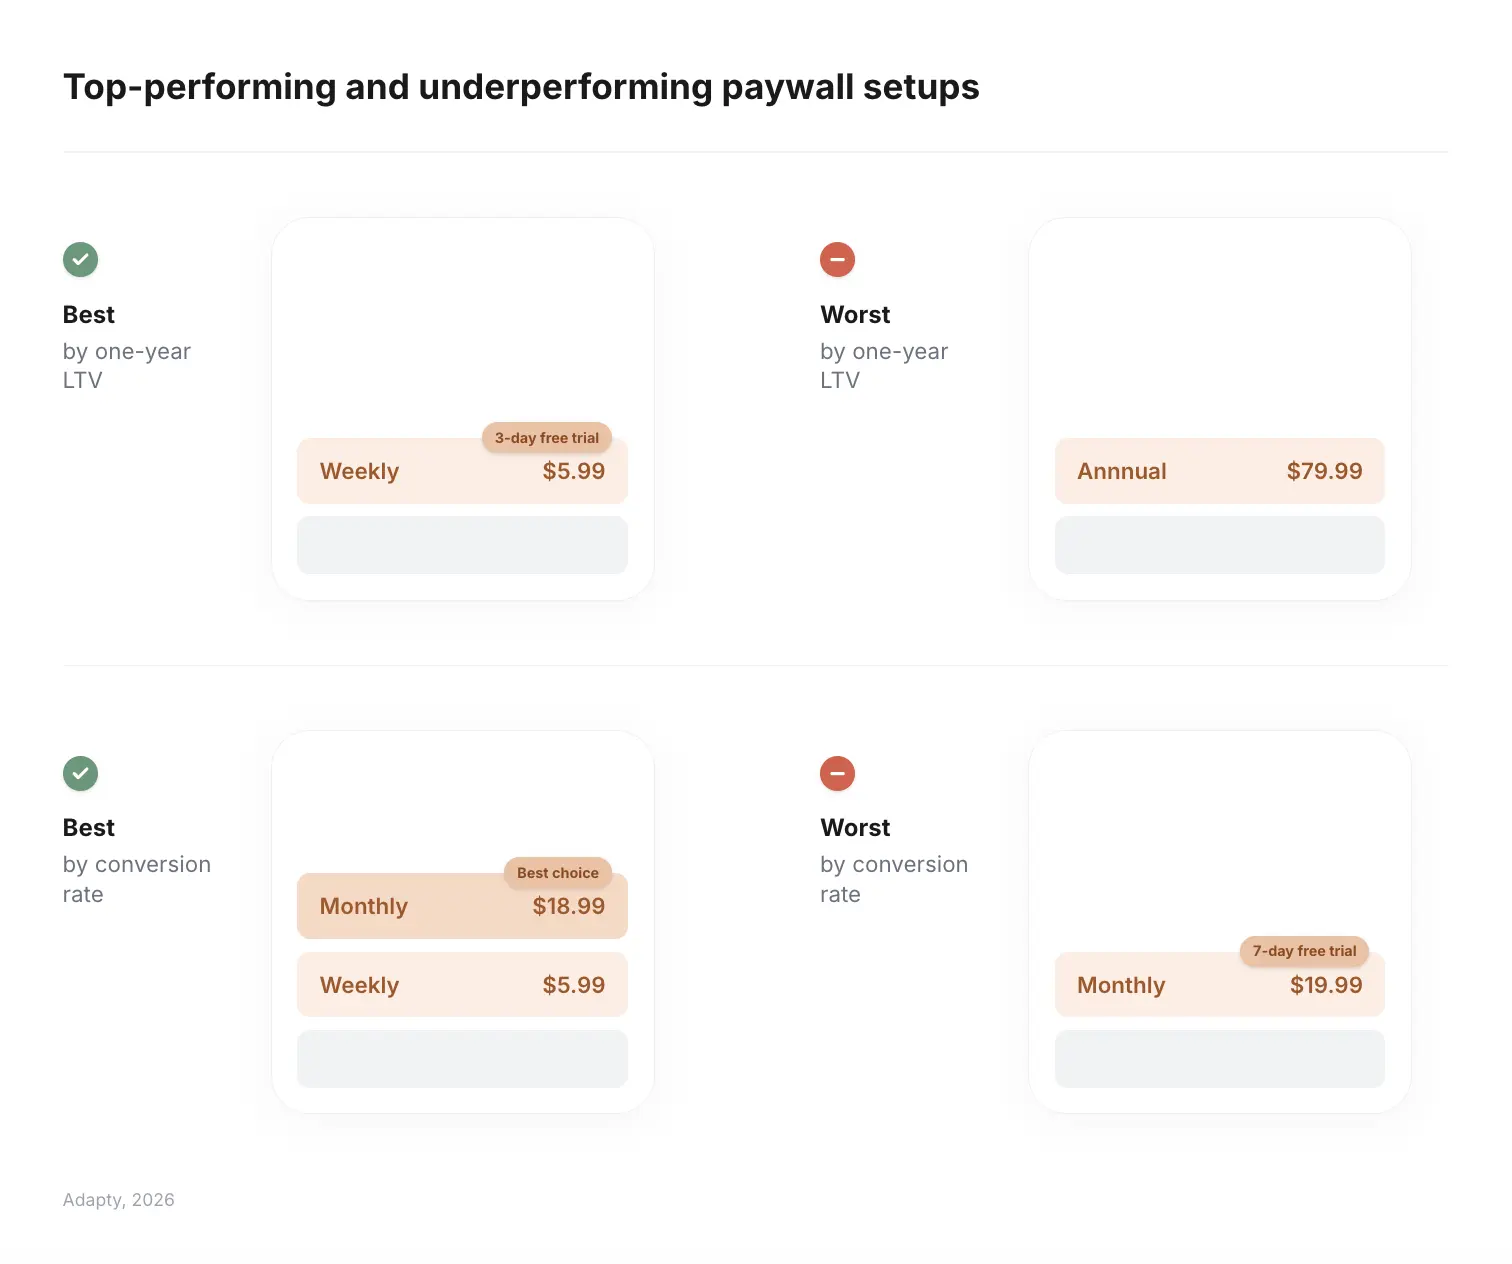
The LTV case for weekly is clear. The best-performing paywall configuration in the entire report is a weekly plan at $5.99 with a 3-day free trial, which produces 1.5x the average LTV of all other paywall setups. For Entertainment, where direct buyers are worth more than trial users, the optimal configuration likely skews toward slightly shorter trial windows or harder trial gates rather than extended free access.
Monthly is the riskiest plan type for Entertainment. Getting monthly pricing wrong carries a steeper penalty here than in any other category. The data shows that Entertainment monthly has the most extreme price-retention gap in the entire dataset: low-priced monthly Entertainment apps retain 2x better than high-priced ones.
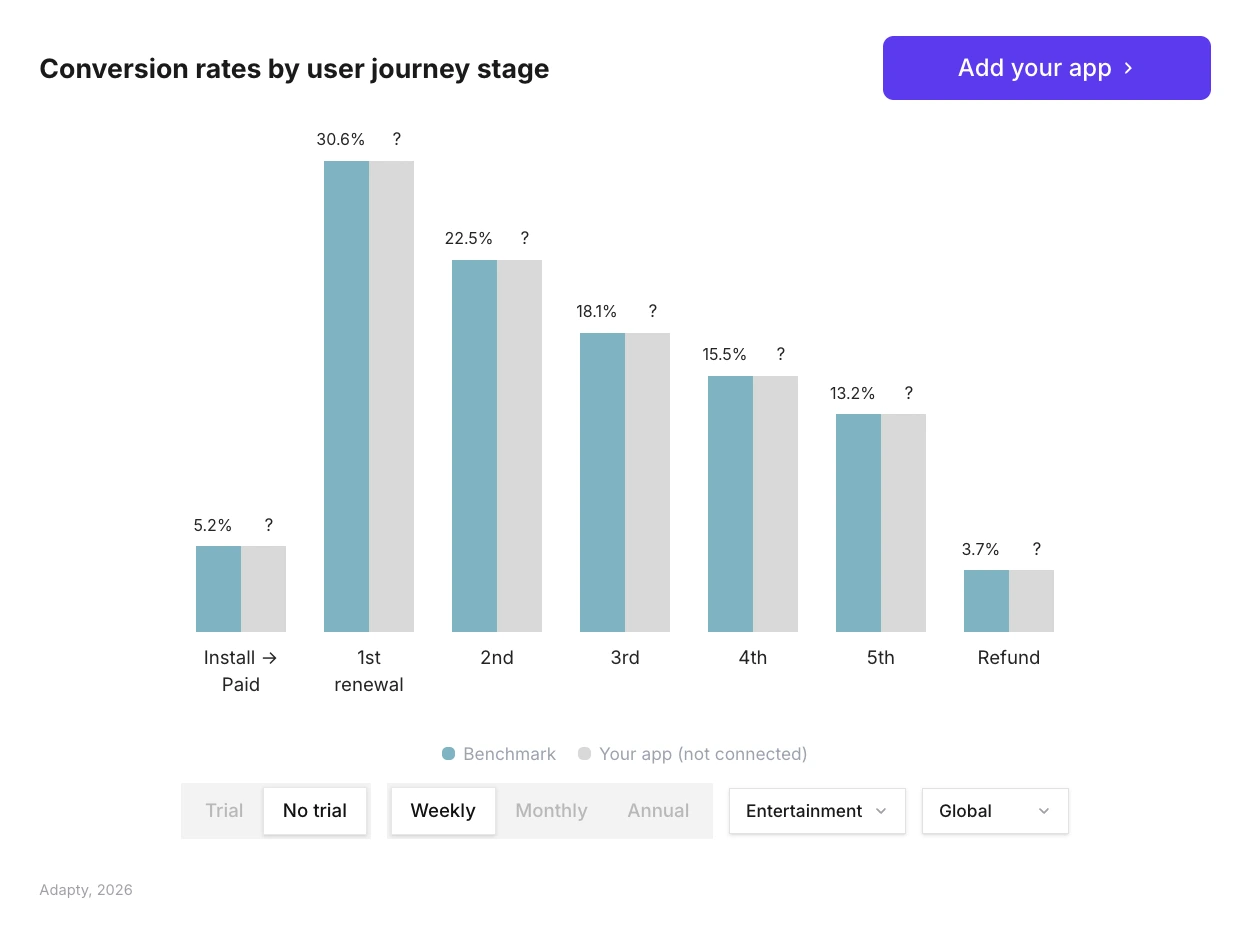
What conversion benchmarks should Entertainment apps target?
Working backwards from the global benchmarks:
The refund story in Entertainment has an interesting regional dimension. MEA (Middle East & Africa) shows the lowest refund rates overall, and Entertainment in MEA bottoms out as the lowest refund rate of any category-region combination in the report. If you are targeting MEA markets, refund risk is materially lower than your global average suggests.
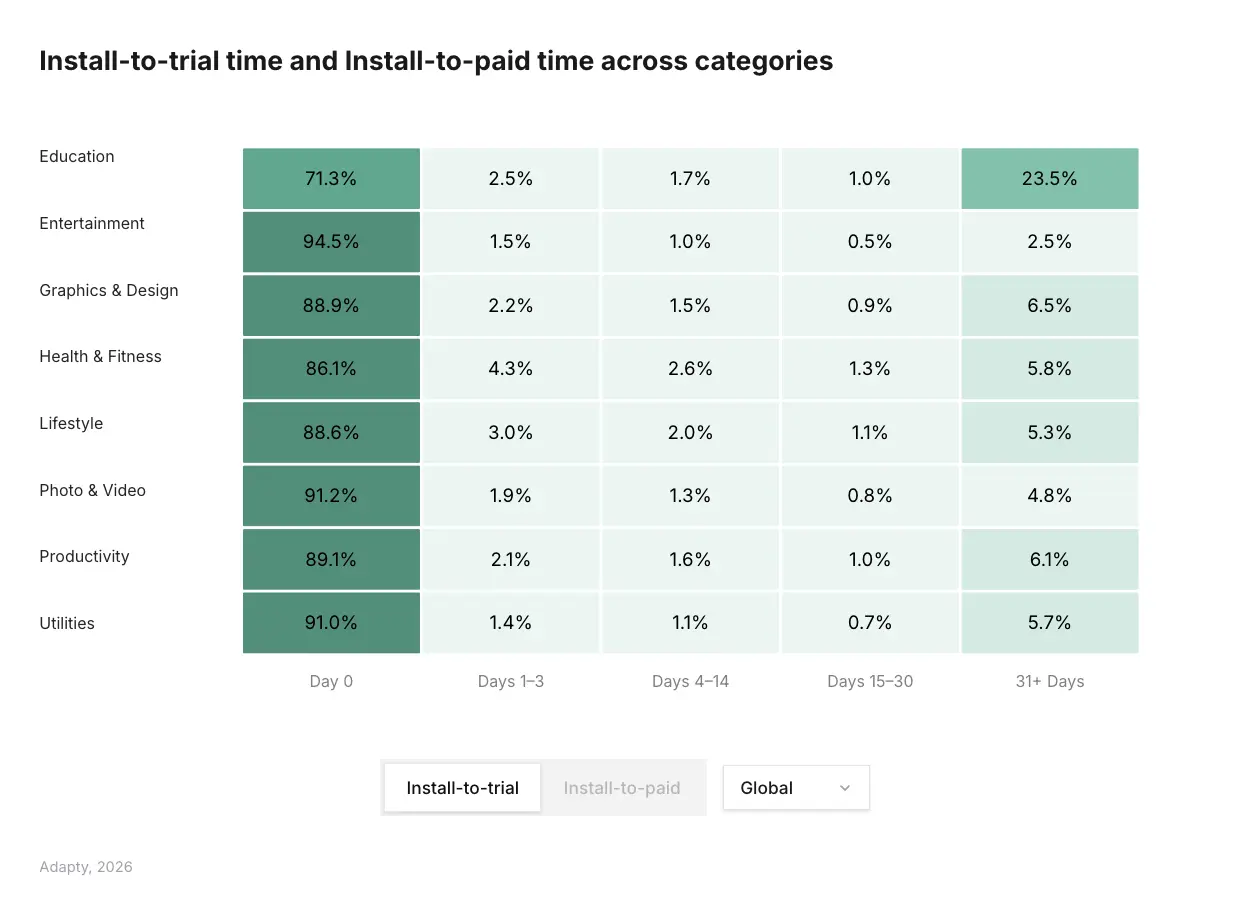
On timing: 90% of trial starts happen on Day 0 across all categories. Entertainment follows this pattern. That means your onboarding and the paywall moment need to work together — the decision to subscribe or trial happens in the first session. Onboarding flows designed to defer the paywall do not get a second chance in most cases.
How should Entertainment apps price across regions?
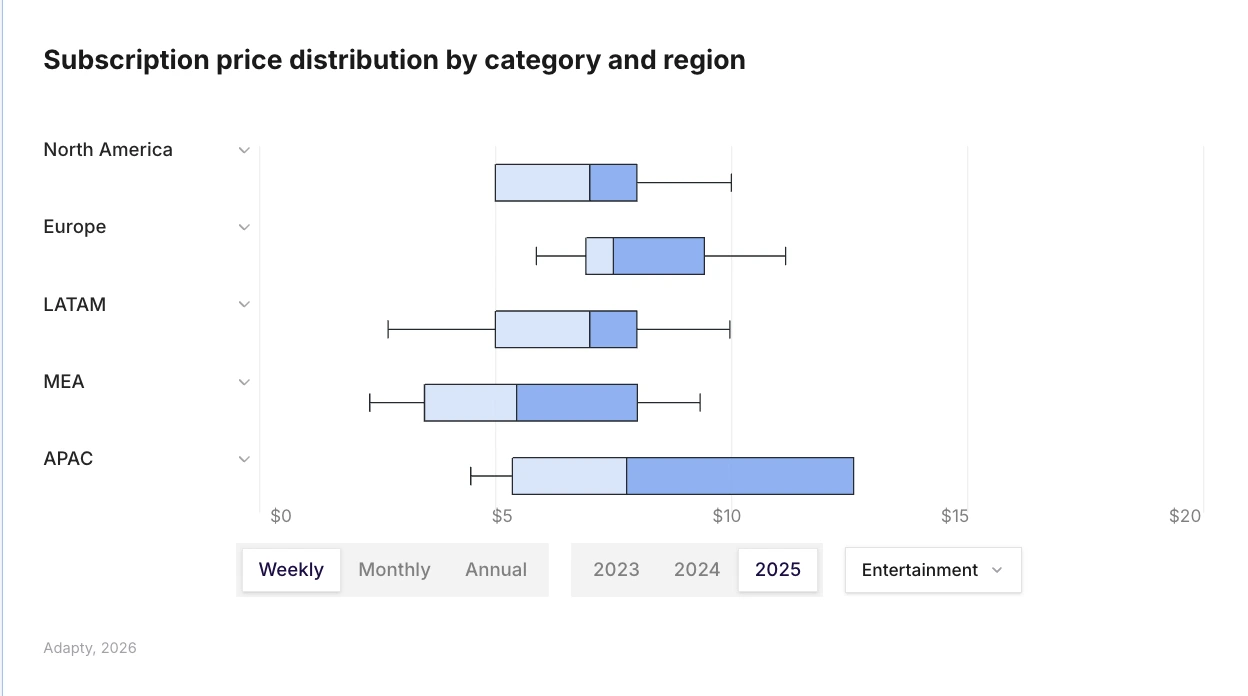
The global median prices in 2025 are $7.48/week, $12.99/month, and $38.42/year. These are starting points, not targets.
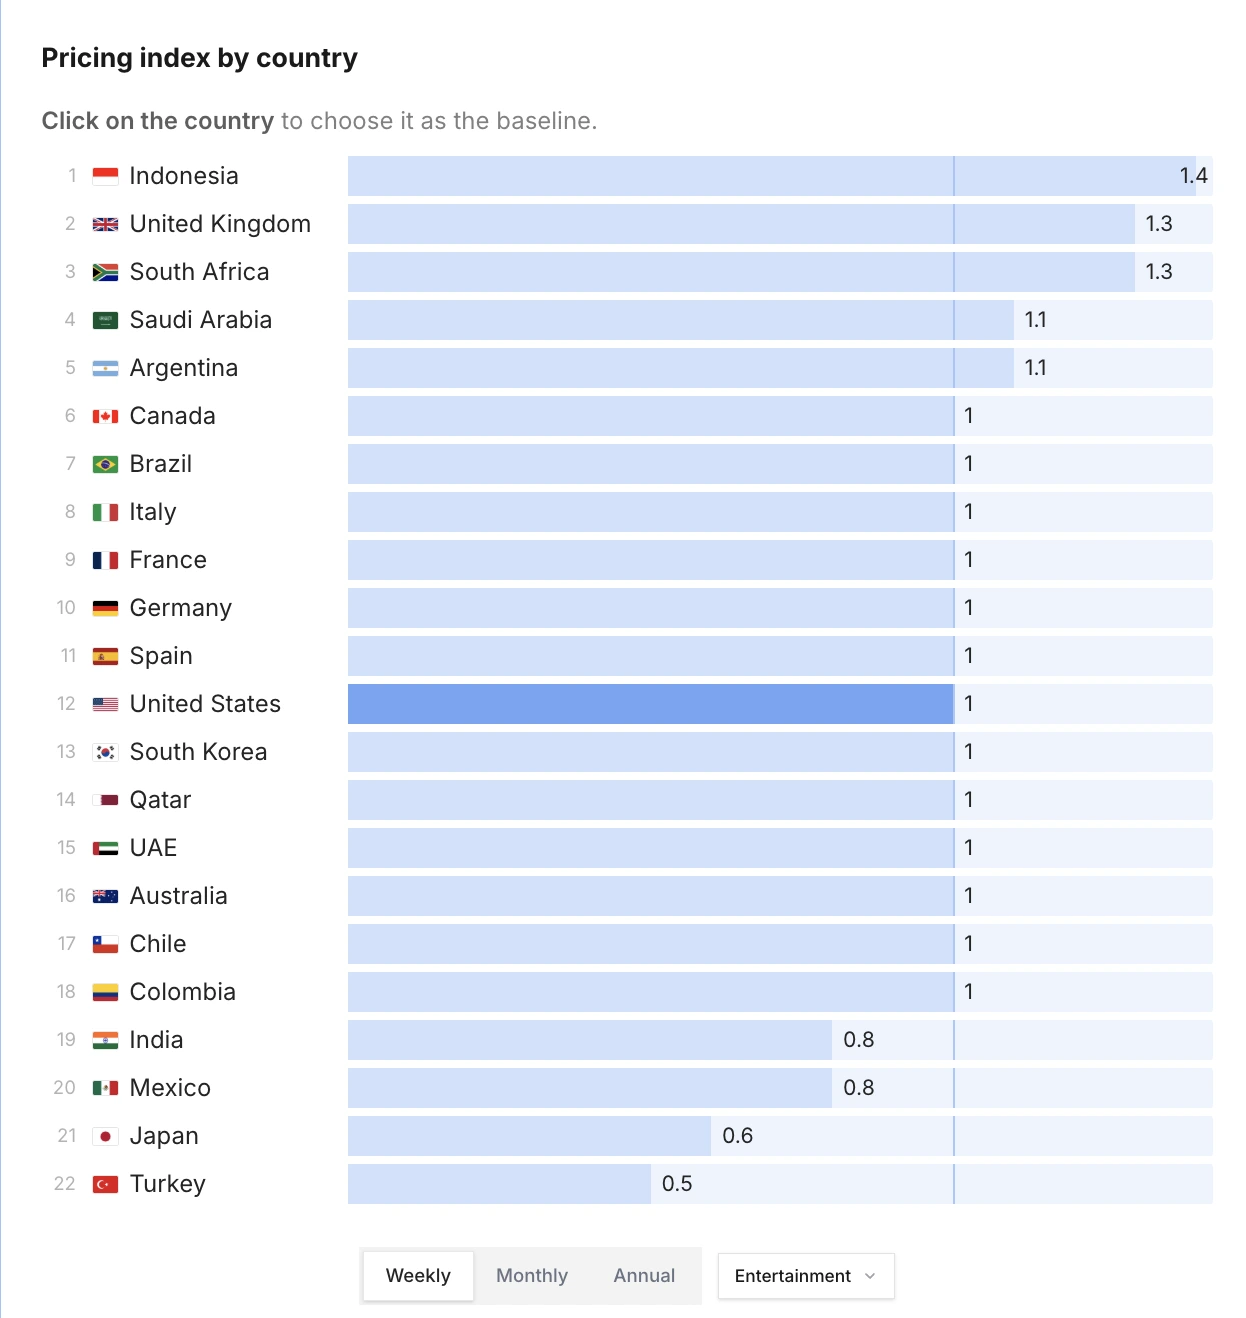
Europe overtook North America as the most expensive region in 2025, with subscription prices up to 40% higher than the US baseline. The UK, France, Germany, Italy, and Spain all sit at a 1.2x pricing index relative to the US. If your Entertainment app is live in Europe and you haven't raised prices in the last two years, you are likely leaving revenue behind.
The SOIS data shows that high-priced apps earn 3x the LTV of low-priced apps across the market as a whole, and for weekly plans, higher-priced apps actually convert into purchases better. Price is not what stops users from subscribing. For Entertainment specifically, the weekly plan dynamic holds: the concern is retention after price increases on monthly plans, not acquisition.
Is Android worth prioritizing for Entertainment?
The short answer is: increasingly, yes.
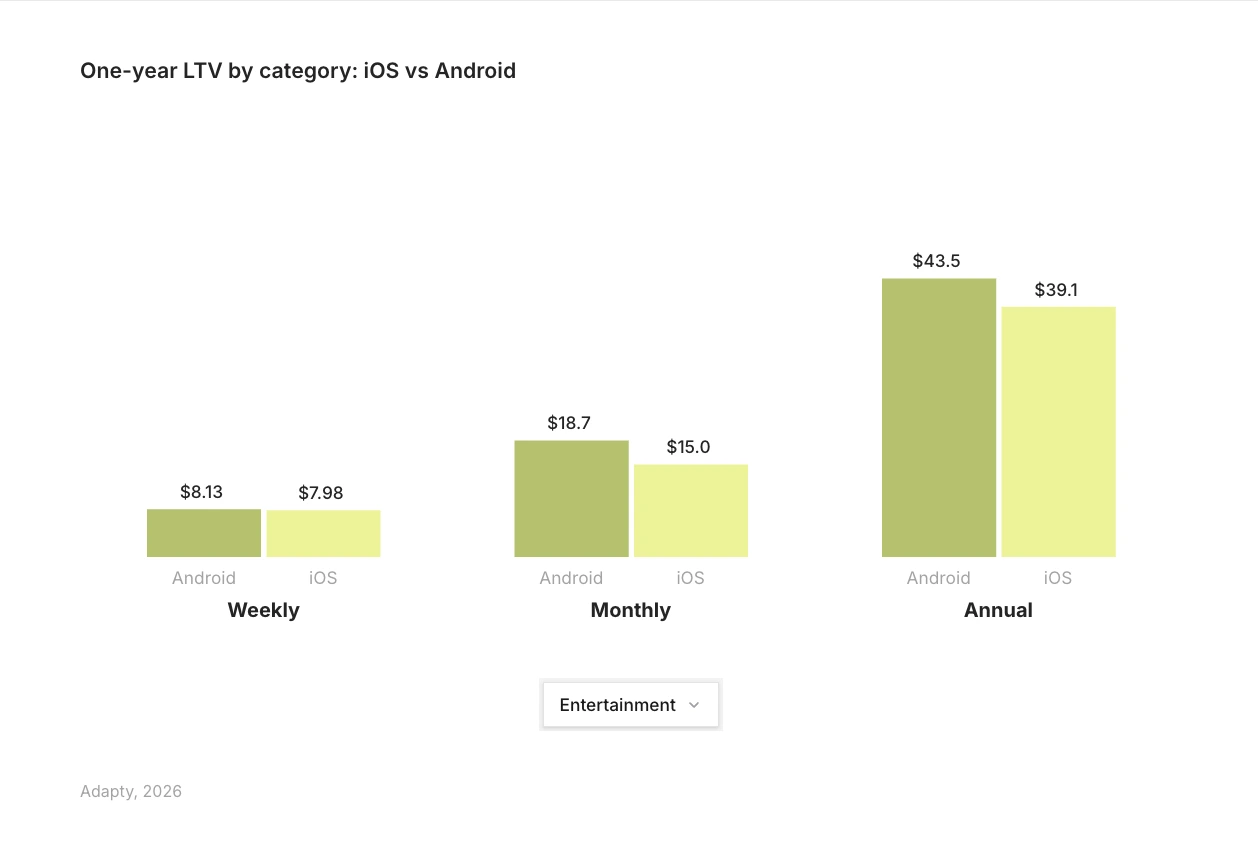
Entertainment is one of the few categories where Android LTV exceeds iOS across all three plan types. On annual plans, Android users generate $43.5 vs iOS at $39.1. On monthly, Android comes in at $18.7 vs $15.0. Weekly is the closest — $8.13 vs $7.98 — but Android still leads.
That said, conversion tells the opposite story. iOS converts dramatically better on weekly (1.43% vs 0.42%) and holds a clear lead on monthly (0.45% vs 0.27%) and annual (0.36% vs 0.09%). So Android Entertainment users who do subscribe are worth more — they just convert at a much lower rate.
The practical read: if your Entertainment app is already converting Android users, the revenue upside per subscriber is real. The priority is conversion optimization on Android, not monetization depth. Weekly plans, location-specific pricing, and hard paywalls tested against soft ones are the right levers.
How much does experimentation matter for Entertainment apps?
The correlation between experimentation cadence and revenue in the SOIS data is the starkest finding in the report. Teams that run experiments make up to 40x more revenue than those that don't. The average experimenting app runs 14.7 tests — they don't stop at one.
For Entertainment specifically, the experiment types most likely to move LTV are:
- Plan duration changes (58.7% of these tests result in LTV uplift)
- Trial structure changes (59.6% result in LTV uplift)
- Locale tests (62.3% result in LTV uplift — the highest of any type)
- Number of plans offered (57.1% result in LTV uplift)
Visual and copy-only changes have the lowest win rate at 34.6%. If your experimentation roadmap is built around paywall design iterations, you are testing the wrong layer first. Structure before aesthetics.
For Entertainment apps with trial underperformance — the 19.1% trial-to-paid rate — the most targeted experiment is trial duration and gate design. Shorter trials or harder gates can improve LTV if the product experience within the trial is strong enough to earn the conversion.
What paywall setup works best?
Onboarding paywalls with trials produce the highest install-to-paid conversion at 1.78% on average. For Entertainment, where the first session determines nearly all trial and purchase decisions, putting the paywall in the onboarding flow rather than burying it in-app is the more defensible default.
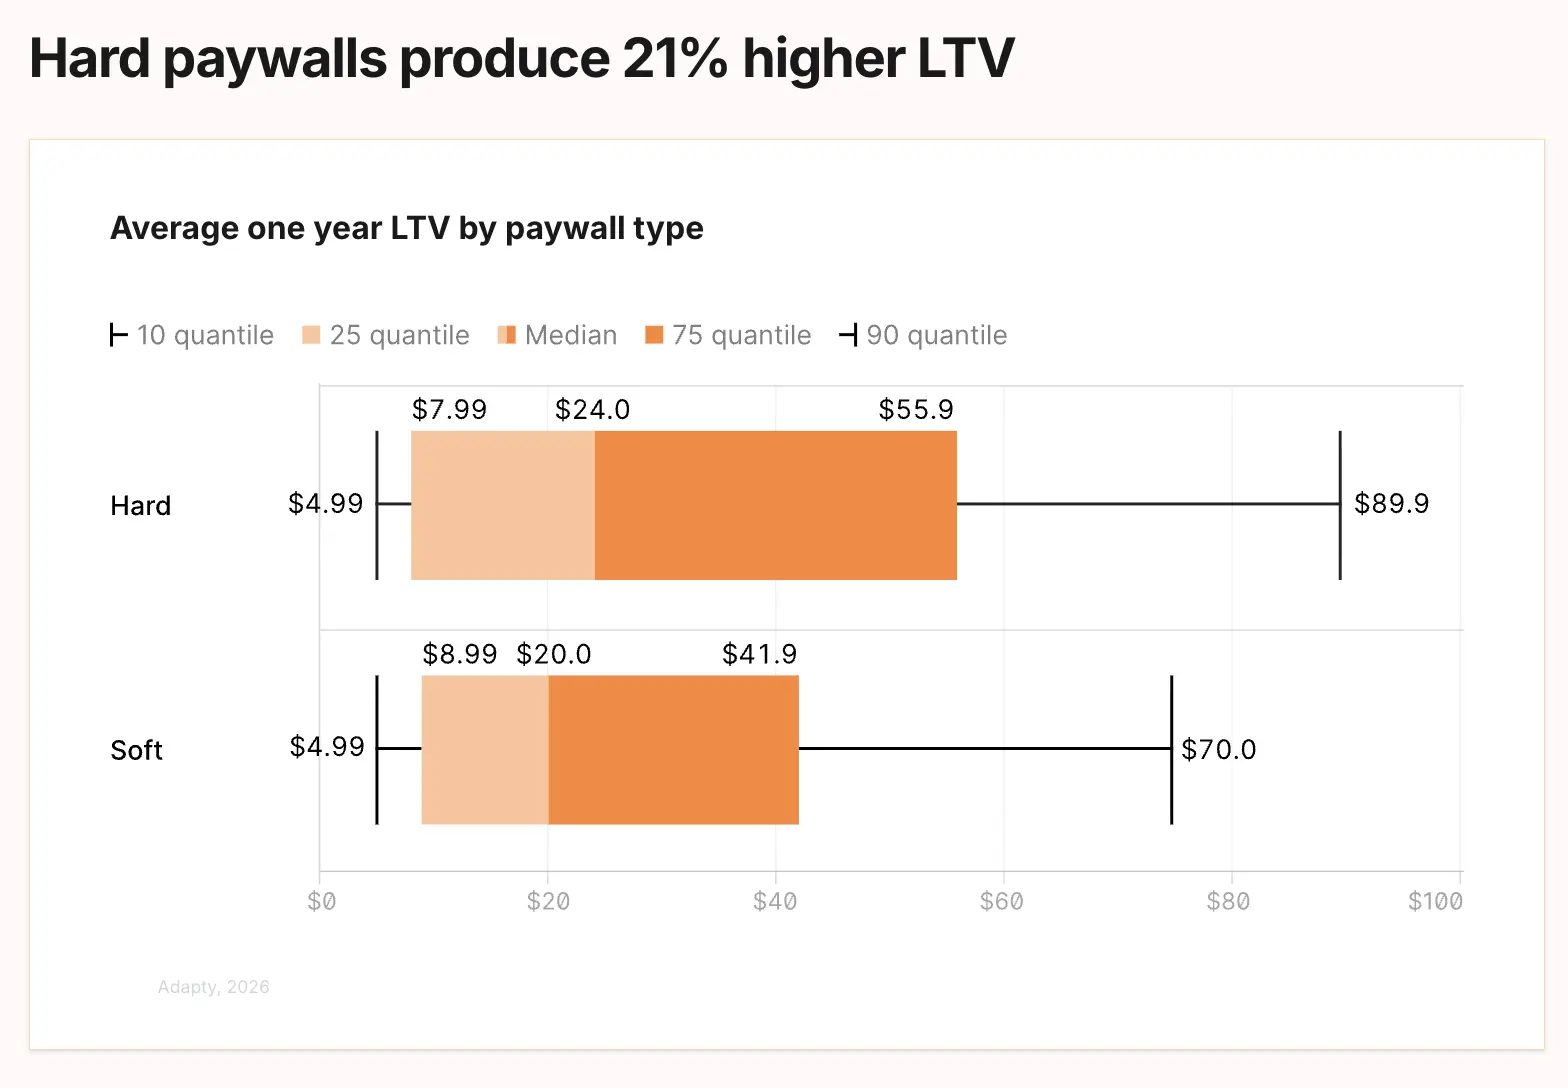
Hard paywalls produce 21% higher LTV than soft paywalls. Soft paywalls outconvert hard ones by nearly 50%, but the users who pay through a hard paywall spend 20-33% more than the median. For Entertainment, where retention after conversion is the primary challenge, acquiring higher-value users through harder gates may trade short-term conversion rate for better long-term economics.
The weekly $5.99 + 3-day trial configuration that tops the LTV chart across the whole report is a reasonable starting benchmark for Entertainment apps. Run it against your current setup before optimizing anything else.
Entertainment app benchmarks at a glance
| Metric | Entertainment | Context |
| Install LTV (12-month) | $0.59 | Lowest of 8 categories; H&F leads at $1.21 |
| Trial-to-paid conversion | 19.1% | Global avg: 25.6% |
| Revenue to top 10% | 94.0% | Better than Lifestyle (97.9%), similar to industry avg |
| Direct buyers vs trial LTV | Direct buyers win | Opposite pattern to Utilities/H&F |
| Monthly price sensitivity | Highest of any category | 2x retention gap between low/high price tiers |
| Refund rate (MEA) | Lowest of any category-region combo | Favorable for MEA-focused apps |
| Android parity (monthly) | Reached in 2025 | Only category with iOS-Android monthly conversion parity |
| Best paywall config (LTV) | Weekly $5.99 + 3-day trial | 1.5x avg LTV across all setups |
| Best experiment type | Localization (62.3% LTV uplift rate) | Higher than price, trial, or visual tests |
Benchmark your app against the full dataset
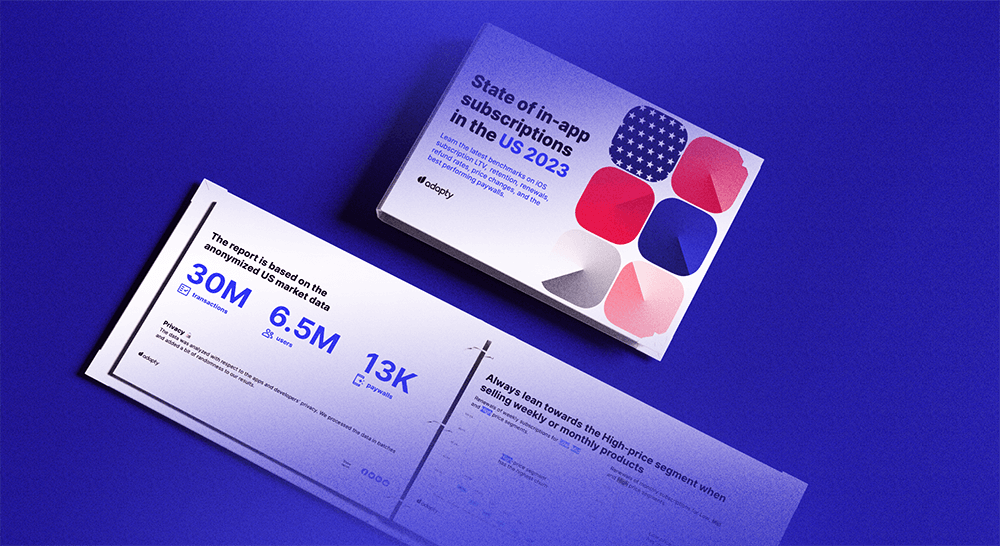
The figures in this article come from the interactive Adapty State of In-App Subscriptions 2026 report, which covers $3B in revenue across 16,000+ apps. The full report lets you filter by category, region, plan type, and country — so you can compare your specific metrics against apps built like yours, not just the category average.