Weekly vs. monthly vs. annual: which plan type should you offer?

TL;DR:
Weekly plans now account for 55.5% of all app subscription revenue — up from 43.3% two years ago. Monthly plans lost nearly half their revenue share in the same period. But "weekly by default" is not a universal rule. Health & Fitness is the only category where annual plans dominate (60.6% of revenue). Lifestyle is the only category where trials actively reduce LTV. The right plan type depends on your category, your paywall structure, and whether users can find value fast enough to survive a weekly renewal cycle.
The question of which subscription plan to offer sounds simple. It isn't. Most guides treat it as a conversion problem — weekly plans convert better, so offer weekly plans. That's directionally correct but dangerously incomplete.
Plan duration affects conversion, LTV, retention, and refund rates differently depending on your category, region, and paywall setup. Getting it right compounds. Getting it wrong quietly drains revenue for months before anyone notices.
Here's what the data from Adapty's State of in-app subscriptions 2026 — covering 16,000+ apps and over $3B in processed revenue — actually shows.
For a broader view of what else the data revealed this year, see Mobile app monetization in 2026: what the data reveals.
What the market looks like right now
The headline shift is hard to ignore. Two years ago, weekly plans generated 43.3% of all app subscription revenue. By 2025, that number is 55.5%. Monthly plans went from 21.1% to 11.7% in the same period. Annual dropped from 29.2% to 22.5%.
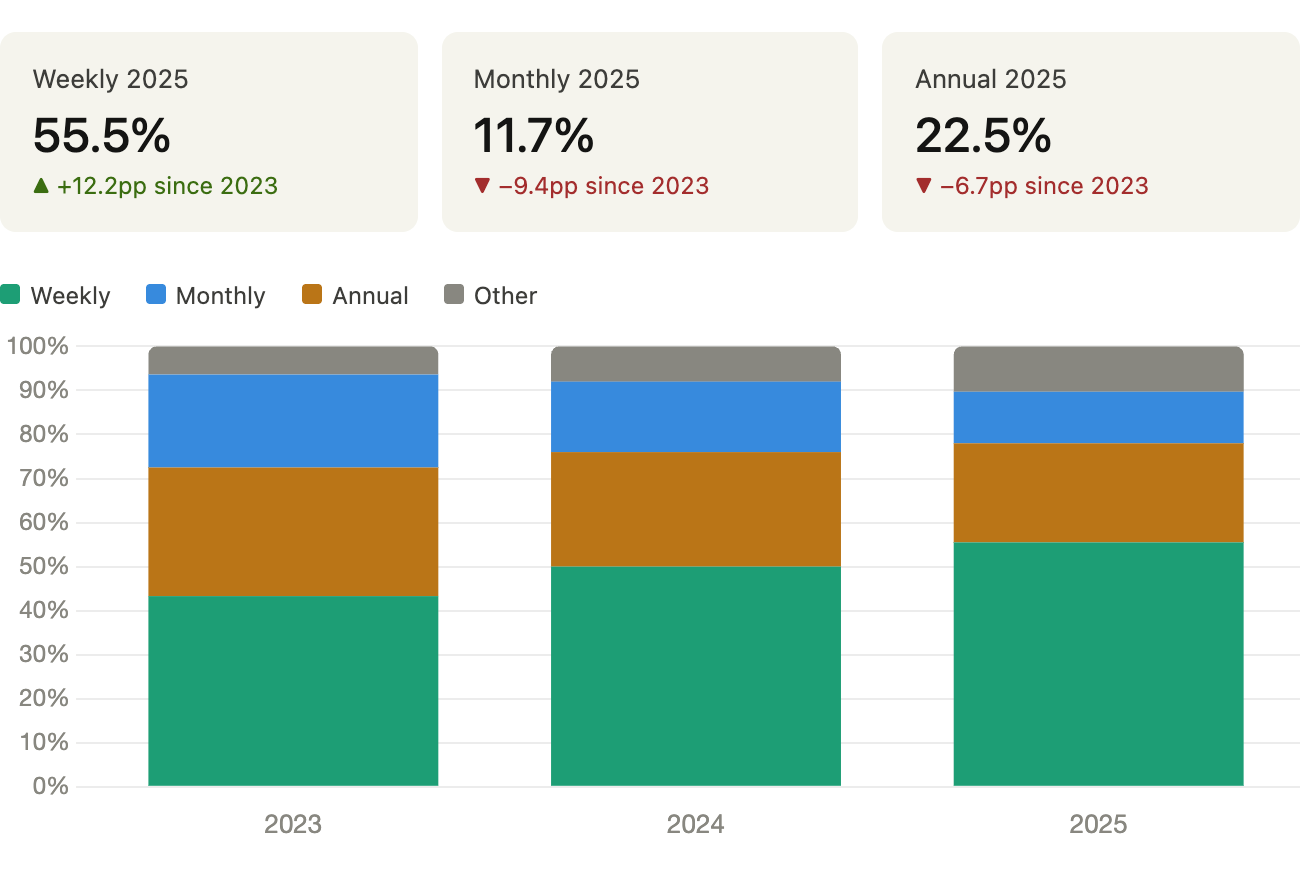
Weekly didn't just grow — it cannibalized both monthly and annual simultaneously. Monthly took the worst of it, losing nearly half its share in 24 months.
The conversion data explains why. Weekly plans convert 1.7-7.4x better than annual across all price tiers. The low commitment threshold makes them easy to try. But conversion at Day 0 is only one part of the story.
How each plan type performs
Weekly: high conversion, fast churn, high ceiling
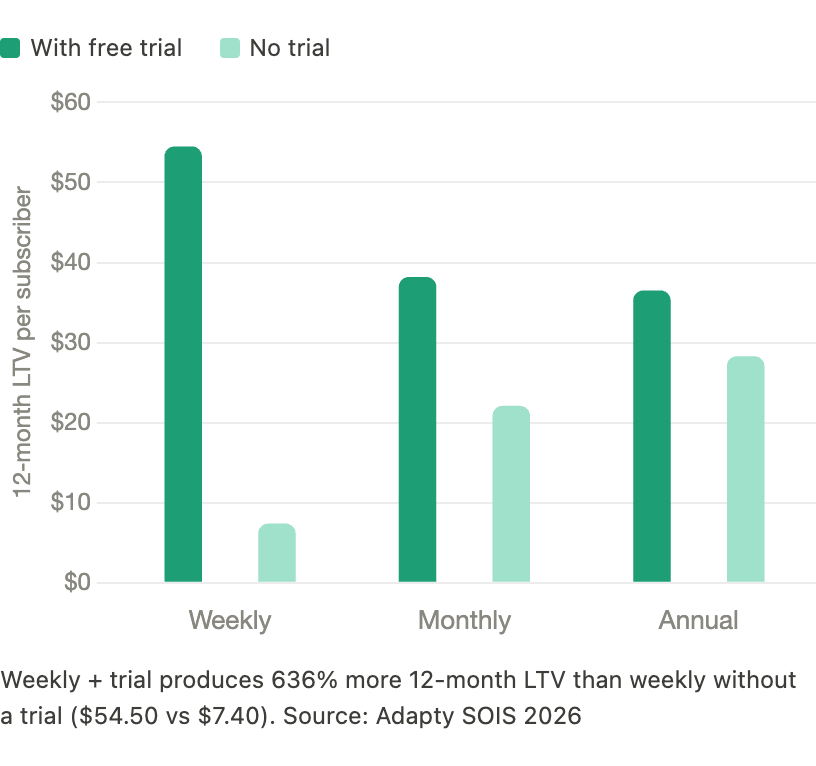
Weekly plans win on entry. They generate the lowest Day 0 LTV of any configuration — you're collecting $7-9 upfront versus $12-15 for monthly or $38-54 for annual. But paired with a free trial, weekly plans produce the highest 12-month LTV of any setup in the dataset: $49.27 per user.
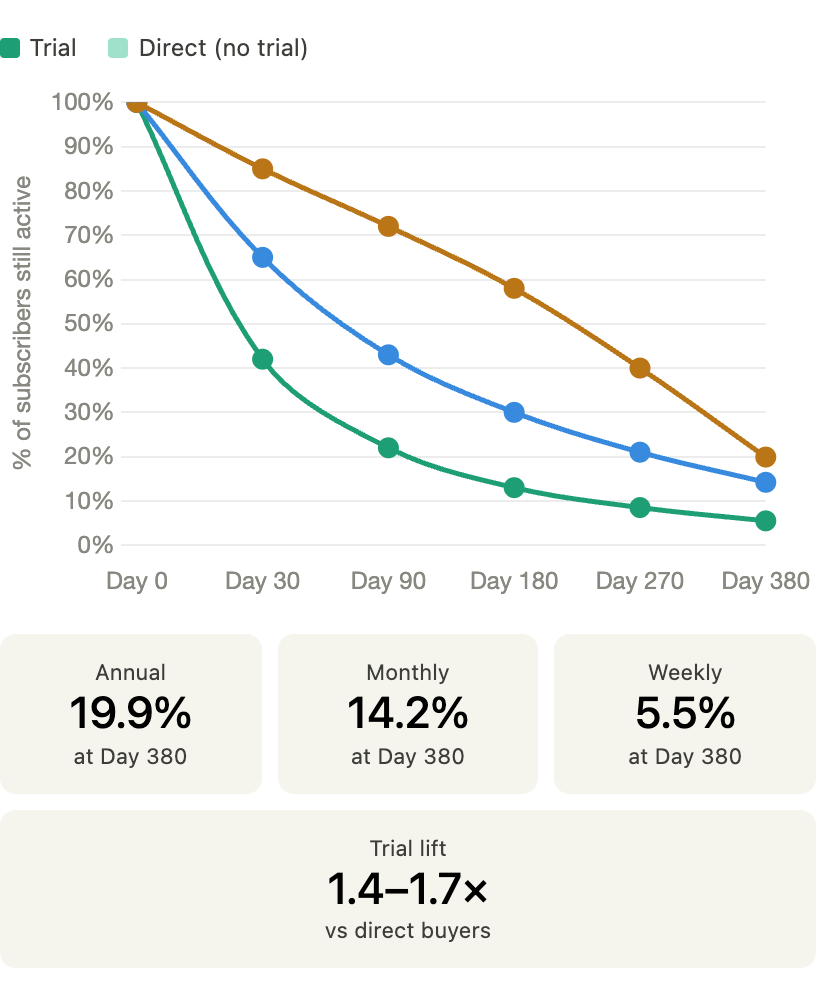
That number comes with a catch. Weekly subscribers churn fast. At Day 380, only 5.5% of trial weekly subscribers are still active. The LTV accumulates through volume and repeated short renewal cycles — not through high retention. You need a significant share of users to survive past their first few renewals for the math to work.
Worth noting
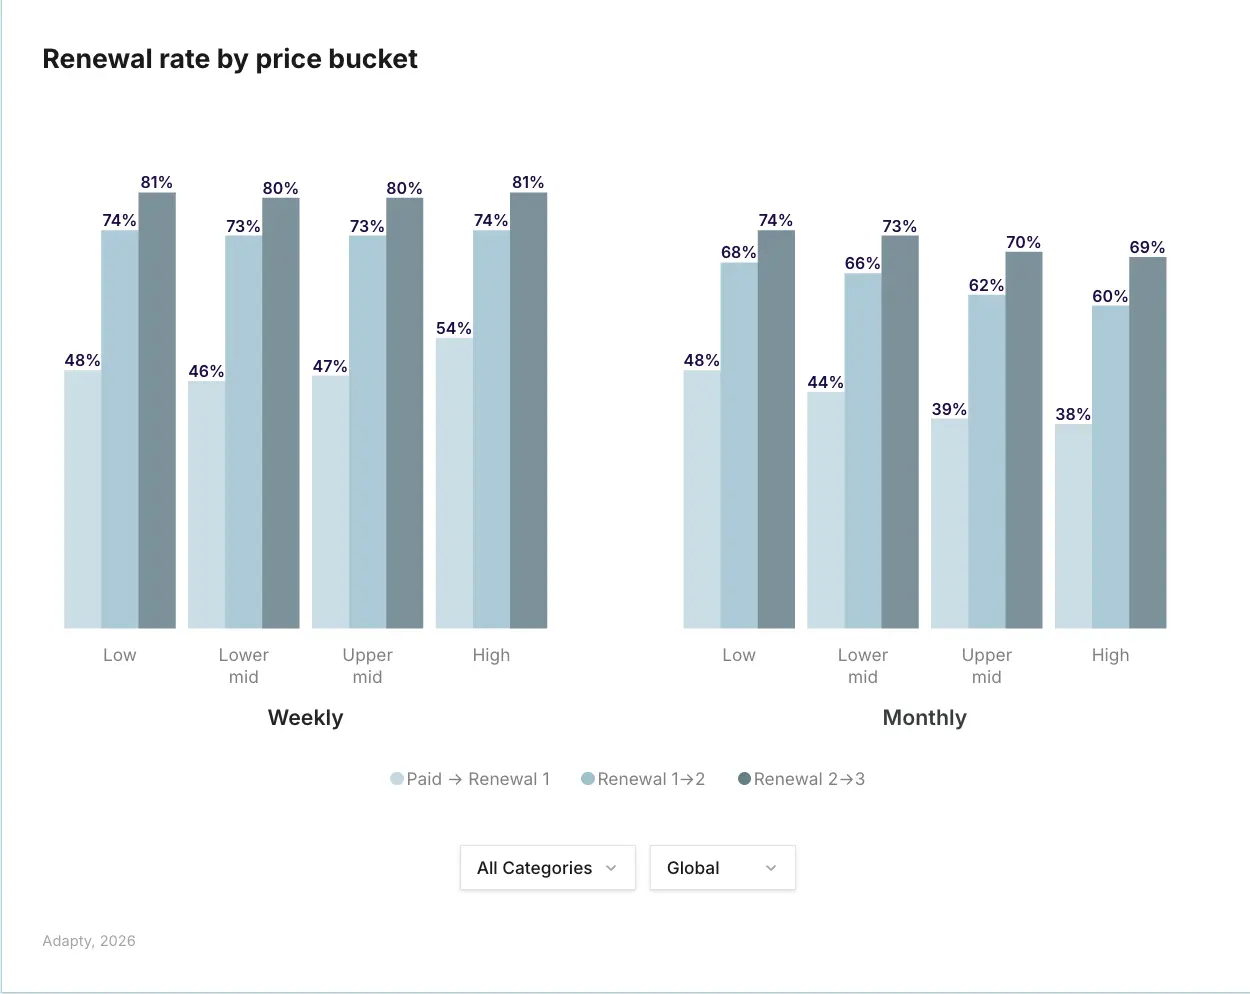
Weekly plan renewal rates are the least price-sensitive in the dataset. Renewal rates barely change across price tiers. If you're already on weekly, raising your price is lower risk than you think.
Monthly: the middle ground that's losing ground
Monthly plans are in structural decline. They lost nearly half their revenue share in two years, and the data suggests this isn't a temporary trend.
Monthly is the most price-sensitive plan type. First renewal rates drop 8 percentage points as prices move from the cheapest to the most expensive tier. Weekly barely moves. Annual varies by category. Monthly takes the hit hardest.
Retention at Day 380 is 14.2% for monthly trial subscribers — better than weekly (5.5%) but well below annual (19.9%). The 12-month LTV lands between the two as well, but monthly rarely produces the conversion volume of weekly or the per-subscriber value of annual.
The one place monthly holds up: Lifestyle apps, where monthly subscribers generate $39 in 12-month LTV. Lifestyle is also the only category where annual trials reduce LTV by 21.2%. In that narrow context, monthly is a reasonable default.
Regional note
European monthly subscribers are the most price-sensitive at renewal anywhere in the dataset. Low-priced European monthly apps see 40% higher first-renewal rates than high-priced ones. If you're running monthly plans in Europe, price matters more than anywhere else.
Annual: lower conversion, higher retention, category-dependent
Annual plans convert at 1.7–7.4x lower rates than weekly. That's a real cost — you're showing the same paywall and pulling in fewer paying users. But the users you do convert stay longer and generate more stable revenue.
At Day 380, annual trial subscribers retain at 19.9% — nearly 4x the weekly rate. First-renewal retention is also significantly higher. The tradeoff is clear: annual trades conversion volume for subscriber quality.
Annual plans also benefit most from high pricing. In Health & Fitness, expensive annual plans generate 4.5x more LTV per user than cheap ones. No other plan-category combination has that kind of spread.
The churn spike pattern for annual is worth knowing: most users stay through the full 12-month cycle (because they've paid), then churn in the renewal window. Your retention efforts around month 10–11 matter more than anything you do in the first month.
Which plan type wins by category?
This is where the market-wide averages start to mislead. Plan type performance varies dramatically by app category. The comparison table below summarizes the key patterns:
| Category | Weekly | Monthly | Annual |
| Health & Fitness | Strong conversion | Not dominant | ★ Dominates (60.6%) |
| Productivity | High LTV ($46.97) | Underperforms | Solid alternative |
| Utilities | 73.6% revenue share | Low share | Growing niche |
| Entertainment | High share | Declining | Underperforms |
| Lifestyle | Growing | Best monthly LTV | Trials hurt LTV |
| Education | Competitive | Middle ground | Strong ($45.10 LTV) |
| Photo & Video | High share | Declining | Solid ($42.4 LTV) |
| Graphics & Design | Growing | Low share | Emerging |
Health & Fitness: the annual exception
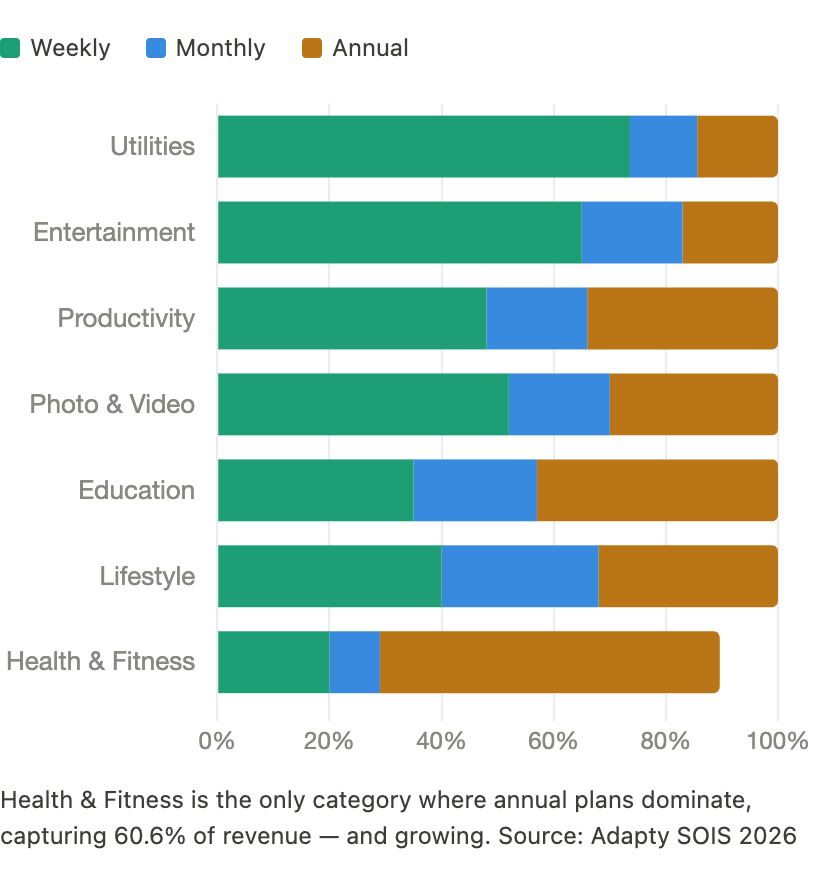
Health & Fitness is the only category where annual plans not only dominate but have increased their share, from 51% in 2023 to 60.6% in 2025. This isn't an anomaly. It's psychology.
Fitness is aspirational. Committing signals intent annually in a way a weekly trial does not. The purchase framing is "I'm investing in my health for the year" — a fundamentally different decision than "I'll try this for a week."
The data supports this: Health & Fitness has the highest trial-to-paid conversion of any category (35%) and the lowest first-renewal retention (30.3%). Users commit fast and churn fast. Annual plans lock in revenue before motivation fades.
If you're building in Health & Fitness and defaulting to weekly because that's what works everywhere else, the data argues otherwise.
Utilities and Entertainment: weekly's stronghold
Utilities apps generate 73.6% of their revenue from weekly plans. Entertainment is similar. These categories share a common trait: users want access now, at low commitment. The value proposition is immediate and repeatable — stream this, use this tool — not aspirational.
Utilities trial subscribers generate the highest 12-month LTV of any category at $68.90. That number reflects both the high weekly volume and the relative stickiness of utility tools once integrated into a workflow.
Lifestyle: the category that breaks the rules
Lifestyle apps are the outlier across multiple dimensions. The top 10% of Lifestyle apps capture 97.9% of all Lifestyle revenue — the most concentrated category in the market. That leaves 2.1% for the remaining 90%.
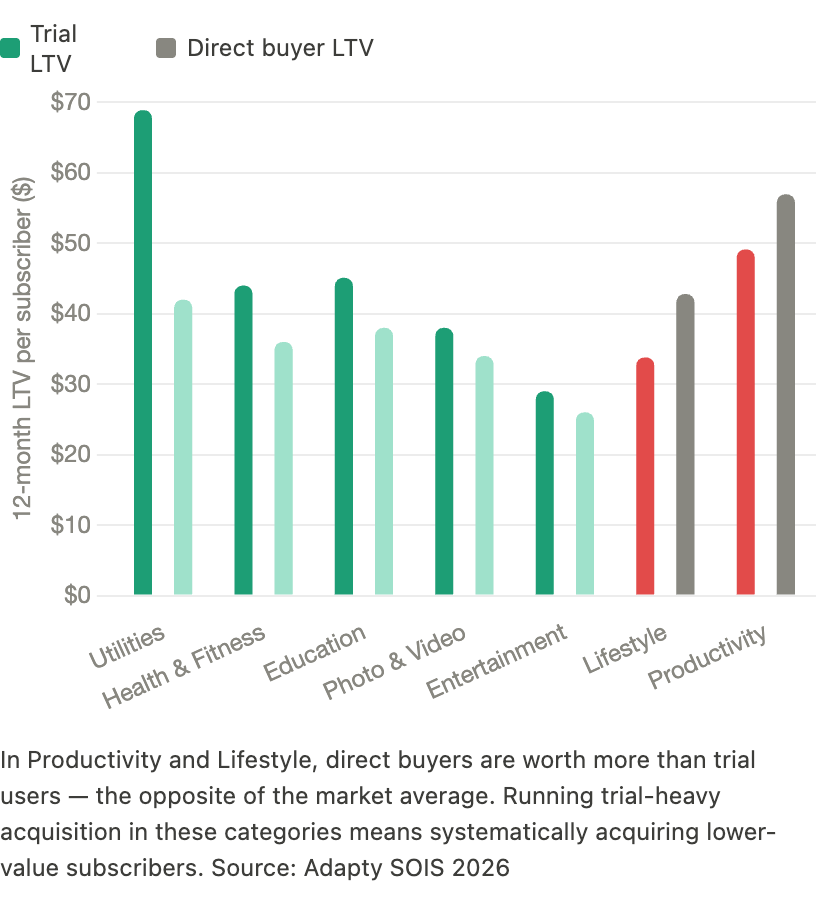
More practically, Lifestyle is the only category where trials reduce LTV by 21.2%. Direct buyers in Lifestyle are more valuable than trial users — the opposite of what's true in most categories. If you're building a Lifestyle app and running trial-heavy acquisition, the data suggests you're systematically acquiring lower-value subscribers.
Should you offer multiple plan types?
Paywalls with three plans — weekly, monthly, and annual — tend to drive stronger LTV across categories than single-plan paywalls. The mechanism is anchoring: offering an item at full price makes monthly feel reasonable and weekly feel accessible.
The median annual plan costs 3x the price of a monthly plan globally, which means annual subscribers save 75% on a per-month basis. That math is a conversion lever. Show it explicitly on the paywall.
| Region | Weekly | Monthly | Annual |
| North America | $8.49 | $13.99 | $40.99 |
| Europe | $8.72 | $14.50 | $44.00 |
| LATAM | $6.20 | $9.80 | $28.00 |
| MEA | $6.80 | $10.20 | $30.00 |
| APAC | $6.50 | $9.60 | $30.50 |
| Global median | $7.48 | $12.99 | $38.42 |
That said, three-plan paywalls require A/B testing to optimize. Which plan is highlighted, how savings are framed, and where the paywall appears in your onboarding flow all affect which plan users choose. Apps that run 50+ experiments earn 18.7x more than apps that run just one.
If you haven't built a testing sequence yet, the paywall experiments playbook covers exactly what to test and in what order — pricing first, visual second, country-based third.
How trials change the math
Across every plan type, trial subscribers retain 1.4-1.7x better than direct buyers at first renewal. Trials lower the psychological barrier to starting, and users who survive the trial tend to be more committed than cold purchasers.
But "always offer a trial" is not the right takeaway. The trial impact is highly category-dependent:
- Productivity: Direct buyers are worth $56.95 vs. $49.13 for trial users. Trials are a churn magnet.
- Lifestyle: Trial users end up 21% less valuable than direct buyers. The only category where this is this extreme.
- Health & Fitness: Trials boost LTV for annual subscribers specifically. The trial starts a commitment arc that annual pricing closes.
- Utilities: Trials help. High trial-to-paid conversion (above category average) and strong 12-month LTV from trial cohorts.
The question is not whether to offer a trial. The question is what a converted trial user looks like in your category compared to a direct buyer. If they're worth less, rethink your acquisition flow.
90% of trial starts happen on the day of install. Your onboarding paywall is effectively your entire monetization strategy. The trial structure only matters if users see value fast enough to want to pay at the end of it.
For benchmarks and optimization tactics: free trial conversion rates for in-app subscriptions — what good looks like by category and how to close the gap.
How the region affects which plan type works
Region matters less for plan type preference than for plan pricing. The gap between best and worst-performing region by retention is 4.1 percentage points. The gap between plan types is 15+ percentage points.
Where region does matter for plan type:
- North America: 14.5% install-to-trial rate, highest in any region. Users are more willing to start and more likely to convert. Weekly trial setups perform particularly well.
- Europe: Most expensive region across all plan types, overtaking North America. European monthly subscribers are the most price-sensitive at renewal — pricing decisions here carry more downside risk than elsewhere.
- APAC: Highest gap between cheap and expensive weekly apps — 3.1x difference in LTV by price tier. Refund rates spike in Photo & Video (14.1% in APAC vs. 6.4% globally), largely driven by Korean refund policies.
- LATAM: Top LATAM countries see 35% lower LTV than top European ones. If you're running annual plans in LATAM, localize pricing accordingly.
Country-level variation is significant enough to warrant localized pricing experiments regardless of which plan you lead with. Locale tests deliver 62.3% LTV uplift in the dataset — the highest of any experiment type.
The decision framework: which plan type should you lead with?
The bottom line: there is no universal answer. But there is a decision framework that works across most cases.
For a deeper look at the structural decisions behind paywall performance, see what a high-performing paywall looks like in 2026? — covering placement, gate type, trial configuration, and what top apps are testing right now.
| If you're building... | Lead with | Trial? | Watch out for |
| Health & Fitness | Annual | Yes (boosts annual LTV) | Churn after renewal — protect month 11 |
| Utilities | Weekly + trial | Required | Price increases are low risk; test up |
| Entertainment | Weekly + trial | Required | High refunds in APAC; monitor by region |
| Productivity | Weekly or annual | No (direct beats trial) | Trial acquisition lowers subscriber value |
| Lifestyle | Monthly or weekly | No (trials hurt LTV) | Extreme concentration; need strong PMF first |
| Education | Annual or weekly | Yes (category-dependent) | Annual LTV is strong; test both |
| Photo & Video | Weekly + trial | Yes | APAC refund spike; consider regional limits |
A few principles hold across categories:
- Weekly + trial is the default starting point for most apps. Test against annual before dismissing it.
- Monthly is rarely the optimal lead plan in 2026. It converts worse than weekly and retains worse than annual. Use it as an anchor option on multi-plan paywalls, not the primary offer.
- Annual works best when your value proposition requires time to demonstrate and your users are making aspirational commitments, not utility purchases.
- High pricing on any plan type outperforms low pricing in most categories. High-price apps earn 3x the LTV of low-price apps. You're probably undercharging.
- Trials are not free. They carry higher refund rates — up to 14% of revenue in some category-region combinations. Build refund prevention into your setup.
The State of In-App Subscriptions 2026 covers LTV by category and region, conversion benchmarks by plan type and trial setup, pricing data across 22 countries, paywall performance across 105,000 paywalls, and experiment win rates by test type. It’s interactive — filter any chart by your category, region, and plan to see where your app ranks.