In-app subscription benchmarks for Education apps
TL;DR:
- Education ranks third in average 12-month LTV at $45.10 — behind Productivity ($46.97) and Utilities ($46.30)
- Trials lift LTV in Education, with a +50.4% trial premium over direct buyers — one of the strongest trial signals in the dataset
- Education is the only category where 23.5% of trial starts happen 31+ days after install — late-start conversions matter here more than anywhere else
- Education leads all categories in discount usage at 14.3% of apps — and that number is accelerating, which is a risk
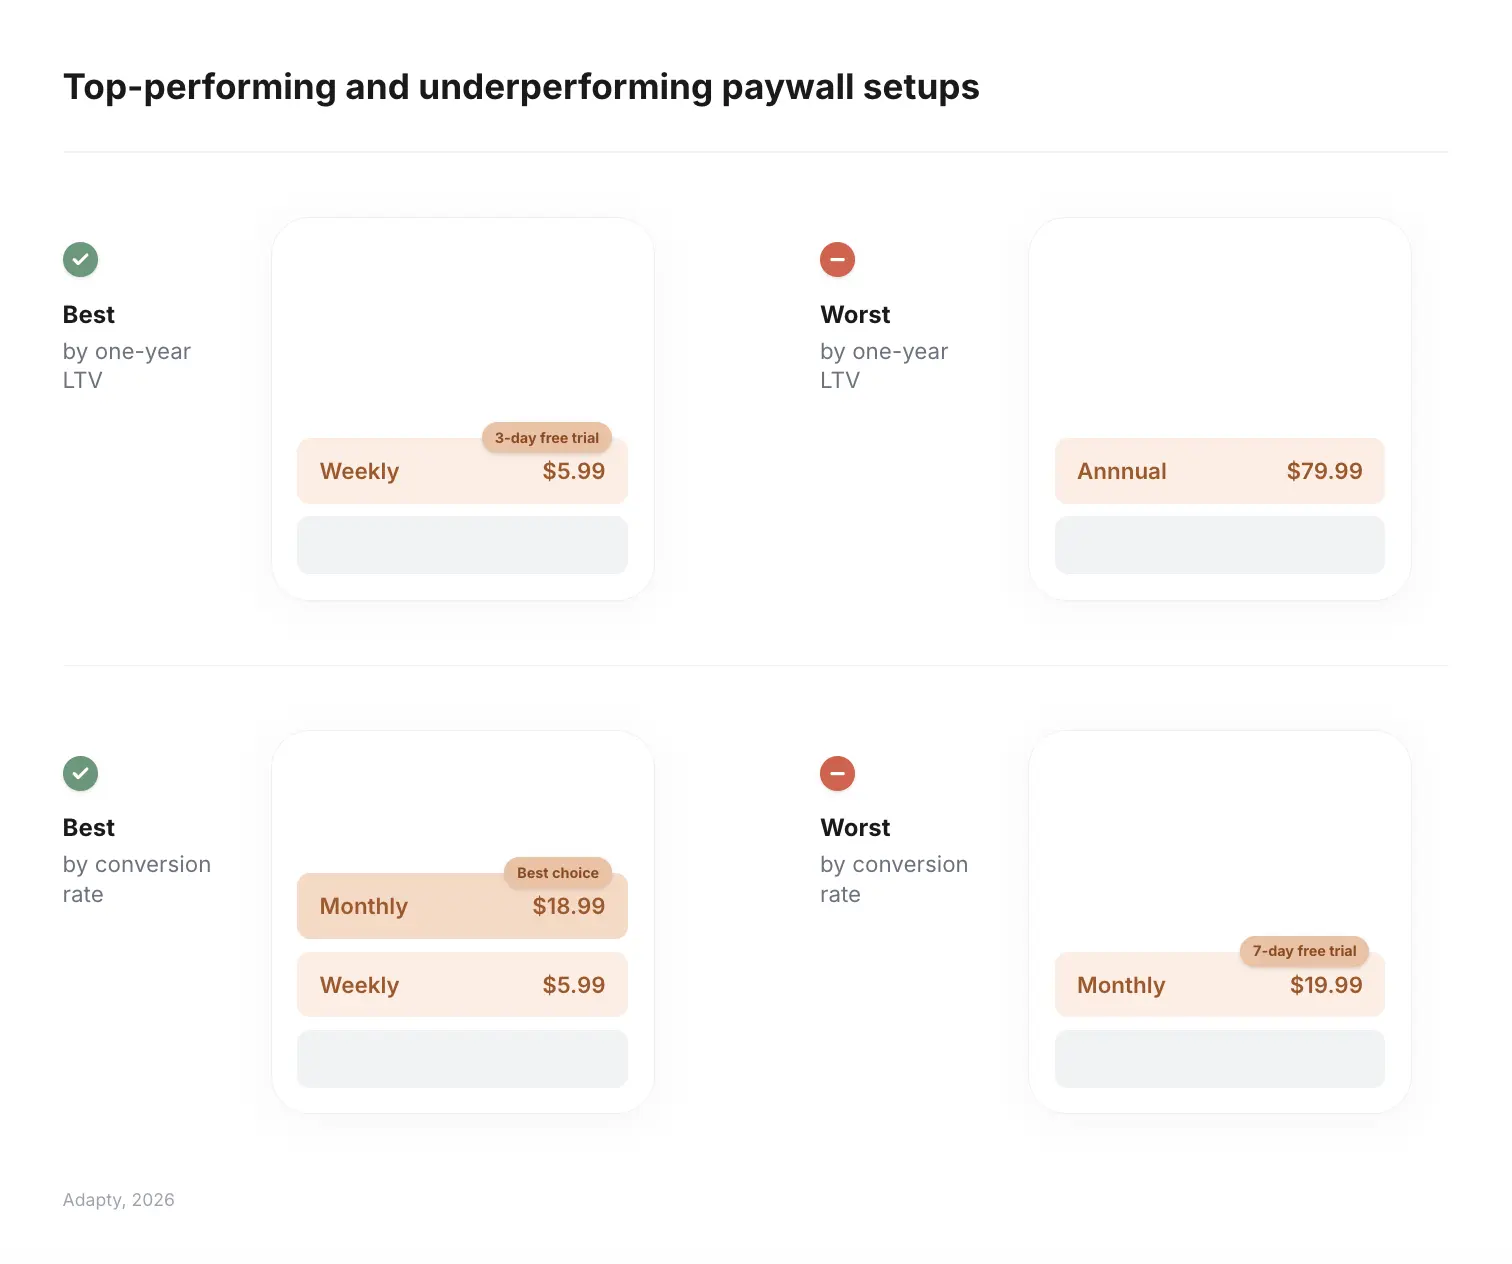
- Annual plans outperform weekly in LTV for Education users — a structural difference from most other categories
- European pricing beats North America; Japan leads annual plan LTV globally at $54.59
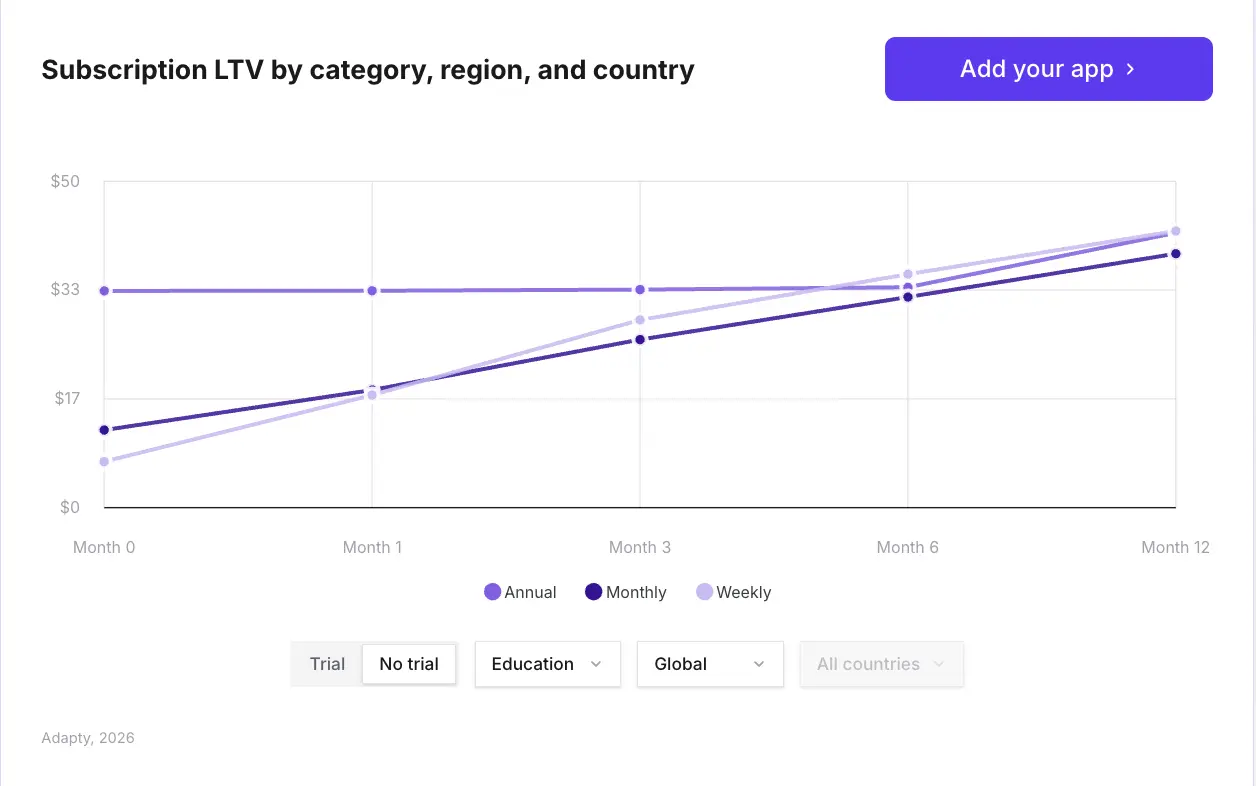
Education is one of three categories where trials genuinely work. Across all plan types combined, Education ranks third in average 12-month LTV at $45.10 — behind Productivity at $46.97 and Utilities at $46.30. The trial premium over direct buyers sits at +50.4%, which puts Education firmly in the camp of categories where free trials are a quality filter, not a conversion crutch.
The nuance is in who converts and when. Education subscribers take longer to commit than users in any other category. They explore. They return. They start trials weeks after installing. Getting Education monetization right means building a funnel that accounts for that behavior — not one optimized purely for Day 0 conversion.
All benchmarks in this article are drawn from Adapty's state of in-App subscriptions 2026 report, covering data from 16,000+ apps processing over $3B in subscription revenue.
What is the average LTV for Education apps?
Education ranks third in average 12-month LTV at $45.10, behind Productivity ($46.97) and Utilities ($46.30). That's a competitive position — it puts Education well above Entertainment, Lifestyle, and Graphics & Design.
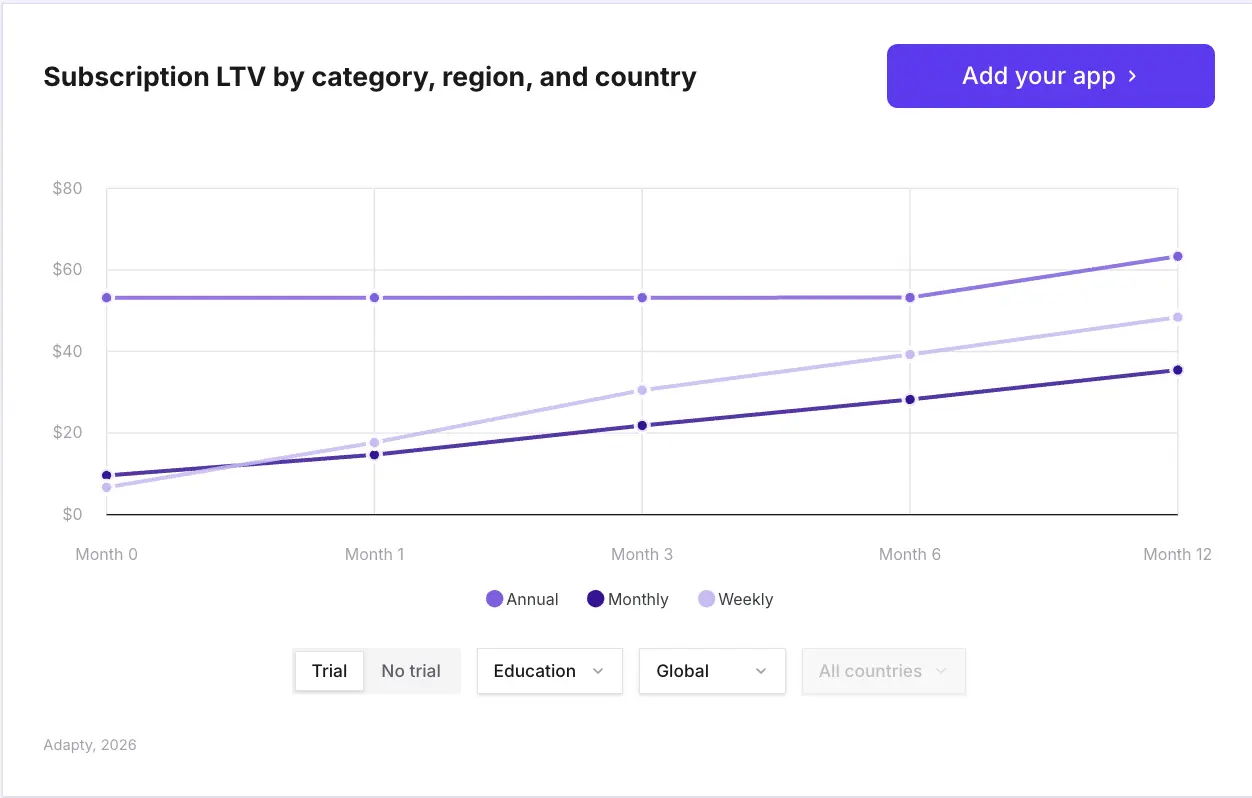
The more important number is the trial premium. Education trial users generate 50.4% more 12-month LTV than direct buyers. In Utilities, that premium is 85.1%, and in Health & Fitness, it's 63.6%. Education sits between them: high enough to make trials the right default strategy, but not so dominant that direct buyers are negligible.
Compare that to Productivity, where direct buyers are worth $7.82 more over 12 months than trial users. The categories that benefit from trials are the ones where users need to experience the product to confirm it solves a real problem. Education fits that profile. A language learner, a test prep student, or a parent evaluating a kids' reading app all want proof before they pay.
LTV benchmarks
| Metric | Value |
| Education average 12-month LTV (all plans) | $45.10 |
| Trial LTV premium over direct buyers | +50.4% |
| Productivity average LTV (ranked #1) | $46.97 |
| Utilities average LTV (ranked #2) | $46.30 |
| Global weekly+trial LTV (market leader config) | $54.50 |
| Education annual plan LTV (2025 SOIS reference) | $45.80 |
Which plan type works best for Education apps?
Education's 2025 revenue split differs from most categories. Weekly plans account for 52% of Education revenue — significant, but well below Utilities at 73.6% or Productivity at 66%. Annual holds 22%, monthly 9%, and one-time purchases have grown to 17%, up from just 6% in 2023. That one-time purchase acceleration is worth watching: it signals that a meaningful share of Education users prefer buying specific content over subscribing to ongoing access.
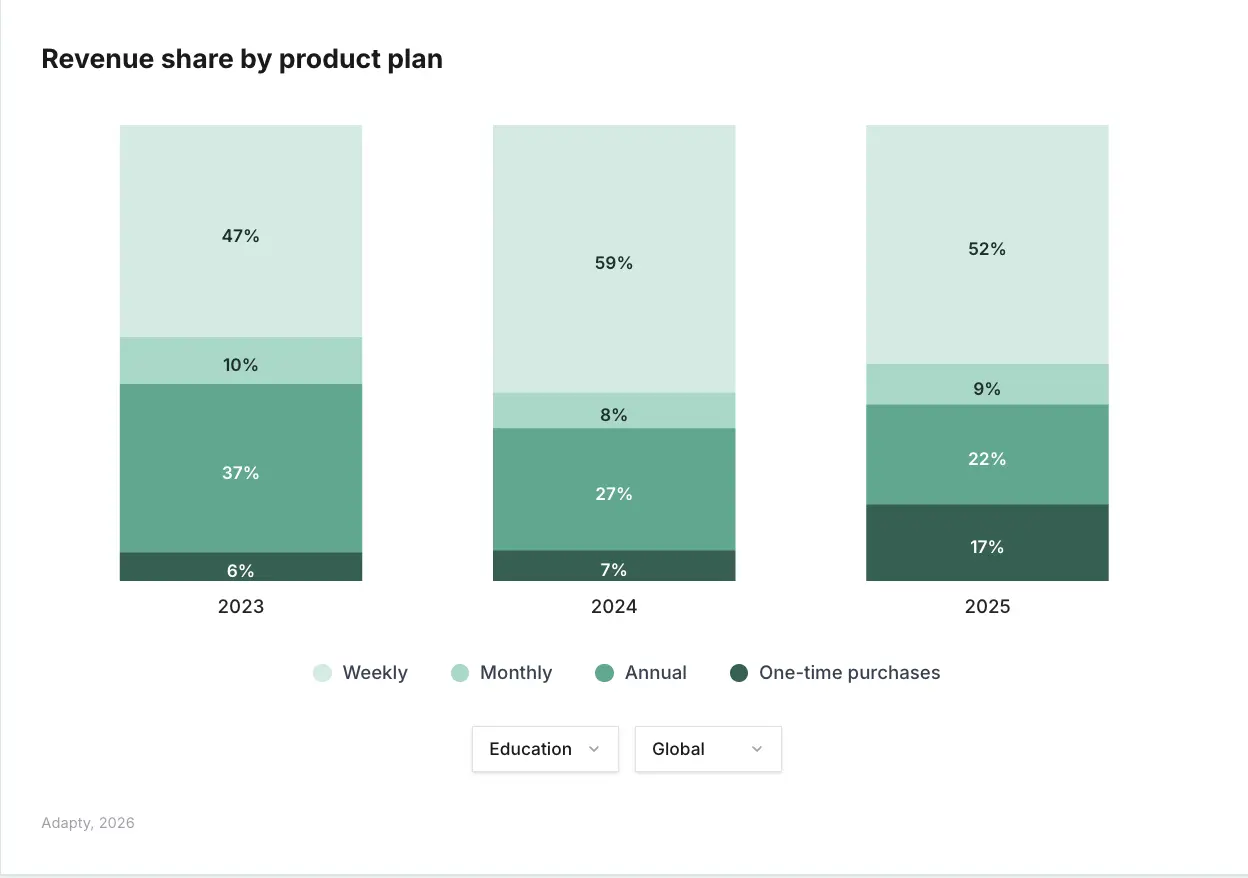
The reason maps to user intent. Someone subscribing to a language learning app, a K-12 tutoring platform, or a professional certification tool is making a goal-oriented commitment. Annual framing reinforces that commitment and locks in revenue before motivation fades — the same psychology that makes annual dominant in Health & Fitness.
Weekly still earns its place in Education as a conversion entry point. Users who are uncertain about product-market fit for their specific learning goal will trial weekly before committing to an annual subscription. The data support offering both, with annual as the primary LTV driver. See the paywall experiments playbook for how to sequence the tests.
Monthly underperforms in Education, as it does everywhere else
Monthly plans consistently underperform both weekly and annual at every price tier across all categories. For Education specifically, the commitment signal from annual is stronger, and the low-risk entry point from weekly converts better. Monthly occupies an awkward middle — too expensive to feel low-risk, not long enough to lock in annual-level retention.
Should Education apps offer free trials?
Yes — and more forcefully than most categories. Education sits in the trial-positive camp alongside Utilities and Health & Fitness. The +50.4% trial LTV premium makes the case clearly: a converted trial user in Education is worth significantly more over 12 months than a direct buyer. For a full breakdown of which categories benefit from trials and which don't, see trial vs. direct purchase: what $3B in app revenue says.
The mechanism is intent filtering. Users who start a free trial in an Education app and convert to paid have already confirmed the app fits their learning goal. They've done a lesson, run through a practice test, or worked through a module. The trial acts as a proof-of-value gate. Direct buyers who skip that gate are more likely to churn early.
What makes Education distinct is when trials start. Across all categories, 89.4% of trial starts happen on Day 0. In Education, only 71.3% of trials start on the day of installation. A full 23.5% happen 31 or more days after install — the highest late-start rate in the entire dataset, by a significant margin.
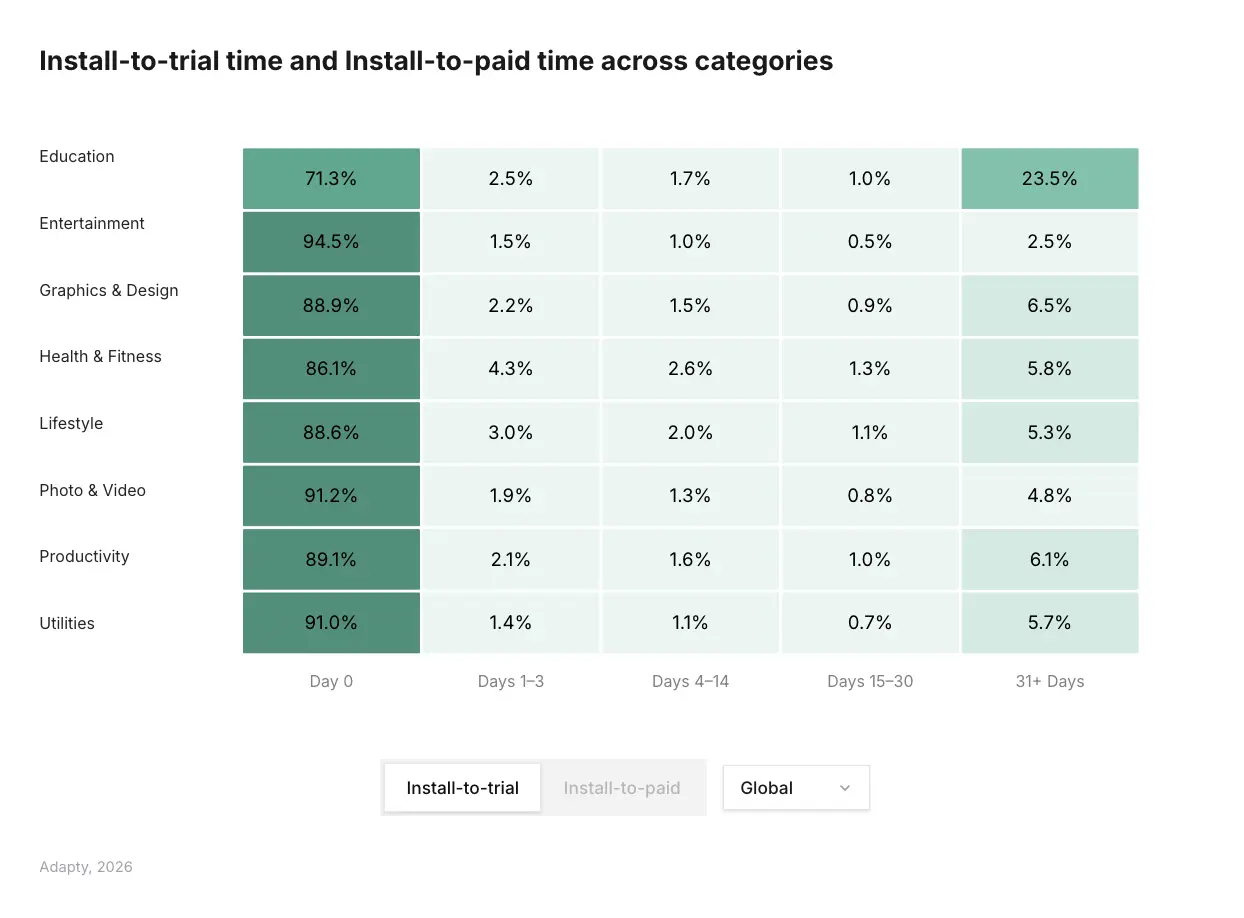
Education is the major outlier on trial timing
Most categories are entirely first-session dependent — Entertainment at 96%, Photo & Video at 91.2%, Utilities at 91.0%. Education breaks that pattern. Nearly a quarter of trial starts happen over a month after install. That means re-engagement sequences, push notifications, and email win-backs have real leverage in Education in a way they simply don't in other categories. Don't build your trial acquisition strategy around Day 0 alone.
That said, Day 0 is still your primary trial acquisition window. The global average of 10.9% install-to-trial and 25.6% trial-to-paid applies here — your onboarding paywall is the highest-leverage surface in your funnel. The Education-specific insight is that the funnel doesn't close when users don't convert in session one.
Trial conversion funnel
| Stage | Benchmark |
| Install-to-trial rate (global average) | 10.9% |
| Trial-to-paid rate (global average) | 25.6% |
| H&F trial-to-paid (category leader) | 35.0% |
| Entertainment trial-to-paid (lowest) | 19.1% |
| Education trial starts on Day 0 | 71.3% |
| Education trial starts at Day 31+ | 23.5% — highest of any category |
| Trial LTV premium over direct buyers | +50.4% |
What should Education apps charge?
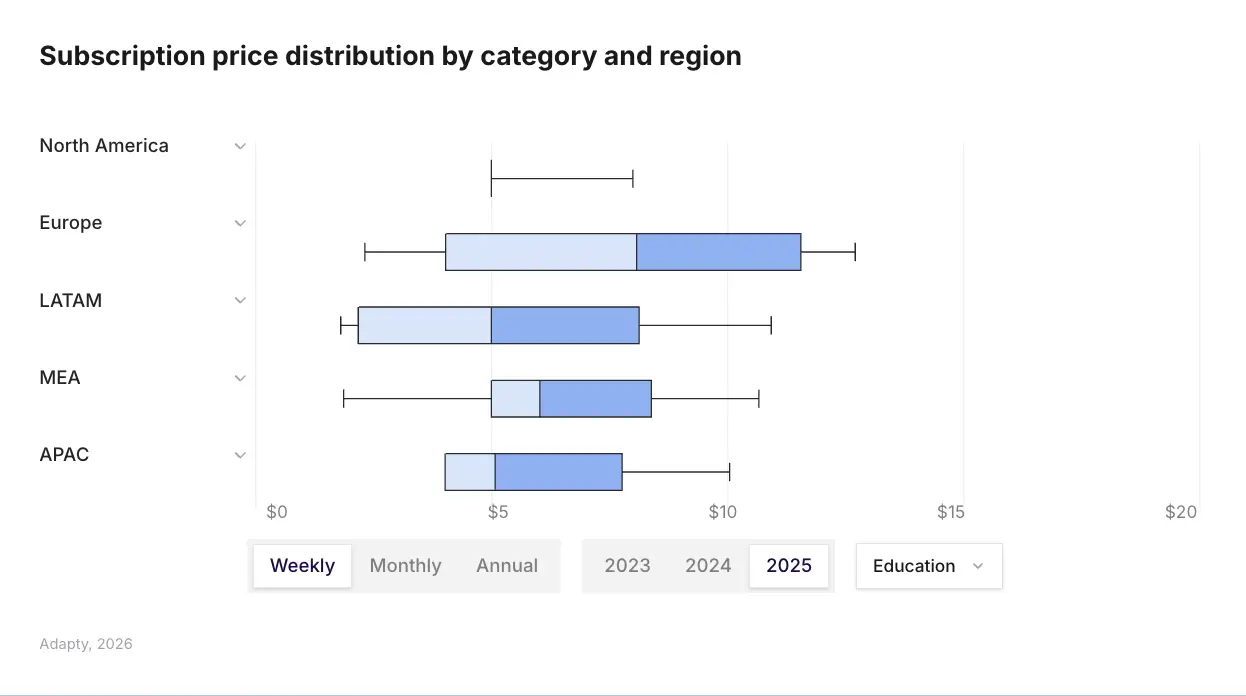
Global median subscription prices in 2025: $7.48/week, $12.99/month, and $38.42/year. Those are floor numbers for Education — the category's LTV profile supports pricing above global median on annual plans in particular. Use Adapty's subscription pricing index to benchmark against your specific markets.
European pricing beats North America across all categories in 2025. European apps now charge 29–39% more than North American ones, and Europe has overtaken North America as the most expensive region on annual, monthly, and weekly plans. Education apps with meaningful European user bases should reflect that in their pricing.
At the country level, Japan tops annual plan LTV globally at $54.59. Germany leads monthly plans at $17.19. Switzerland generates the highest overall 12-month LTV globally at $28.50 per user, followed by Qatar at $27.50 and Israel at $27.00. All three exceed the US ($19.90) and Canada ($20.90). If you're running one global price for your Education app, you're undercharging in Japan, Germany, Switzerland, and most of Europe.
Regional pricing reference
| Market / Plan | Benchmark |
| Global median weekly price | $7.48 |
| Global median monthly price | $12.99 |
| Global median annual price | $38.42 |
| Japan — top annual plan LTV | $54.59 (global leader) |
| Germany — top monthly plan LTV | $17.19 |
| UK — top weekly plan LTV | $8.72 |
| Switzerland — highest overall LTV | $28.50 per user |
| US overall LTV | $19.90 |
| LATAM vs. European LTV gap | ~35% lower in LATAM |
| European pricing premium over NA | 29–39% higher |
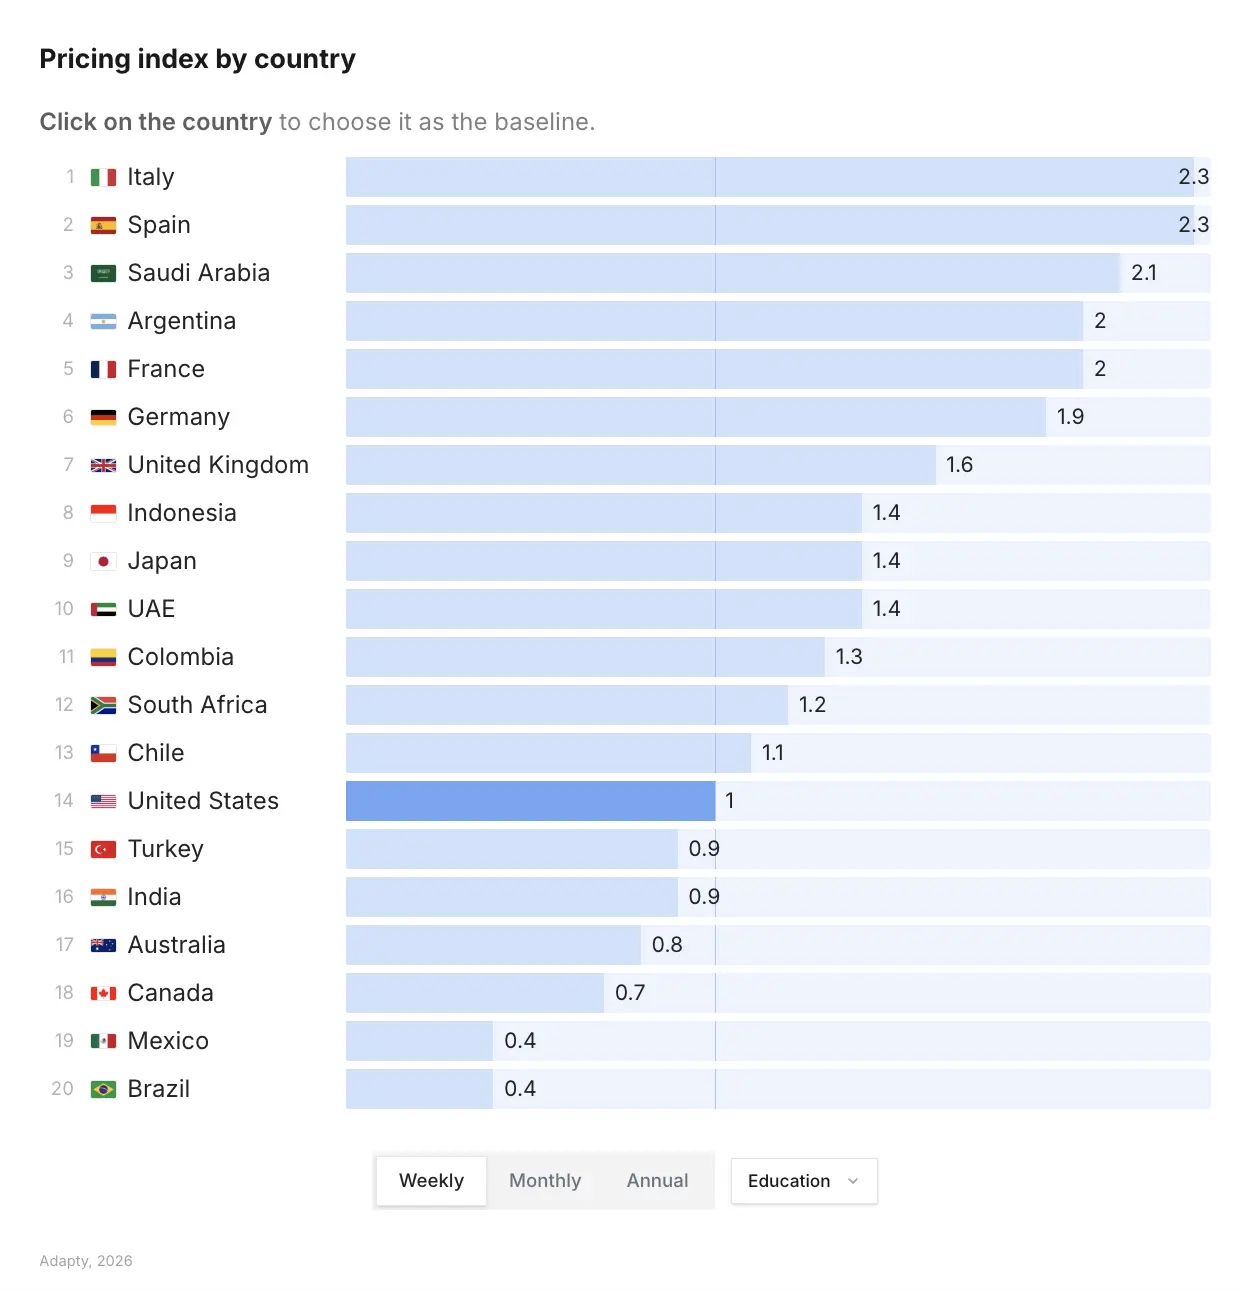
For Education weekly plans specifically, the pricing index shows Italy and Spain at 2.3x the US baseline, France at 2.0x, Germany at 1.9x, and the UK at 1.6x. On the other end, Canada sits at 0.7x, Mexico and Brazil at 0.4x. If you're running one global price, you're overcharging in LATAM and leaving significant revenue uncaptured in Southern Europe.
Are Education apps over-relying on discounts?
Education apps discount more than any other category. In 2025, 14.3% of Education apps offered discounts — up from 10.5% the previous year. The only other categories close to that figure trail by several points. Utilities barely discount at all: 1.4% of Utilities apps, the lowest of any category.
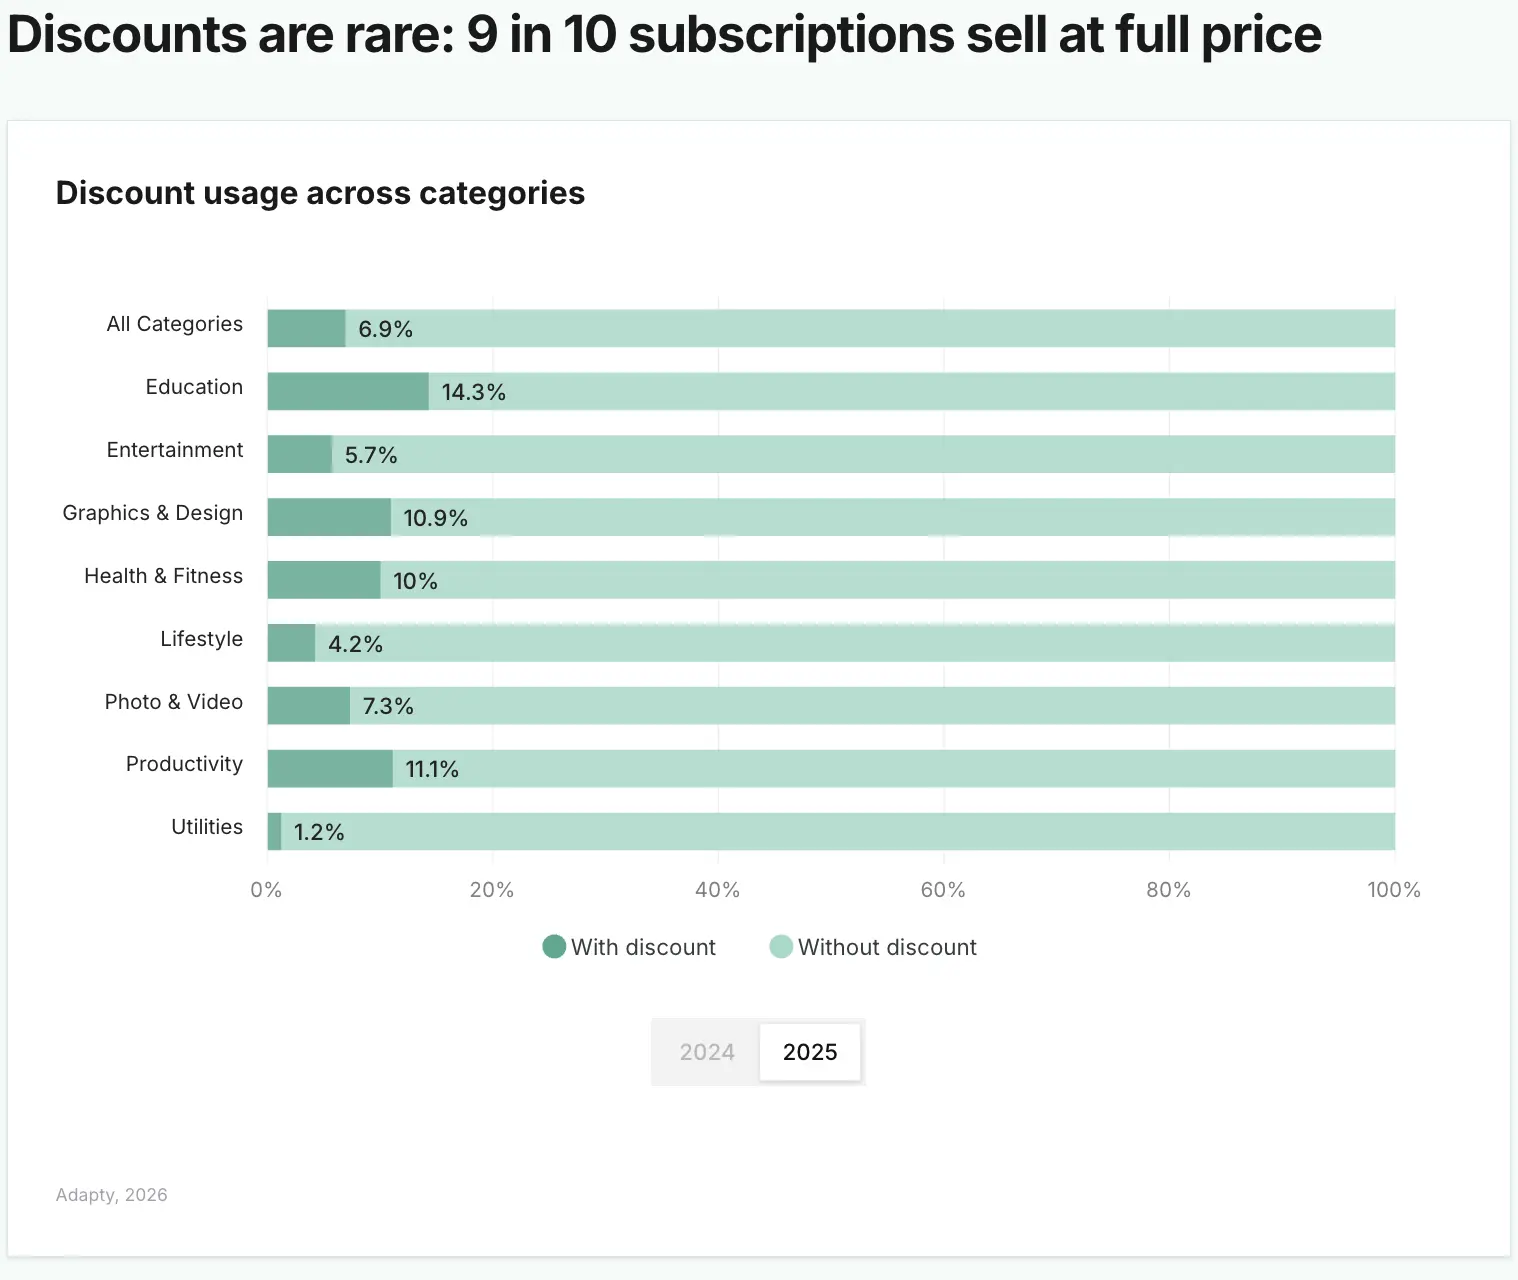
The acceleration matters more than the number. The fastest-growing discount adoption in the entire dataset is in Education. The likely cause: Education has a relatively flat pricing curve compared to other categories, meaning higher prices don't move LTV upward the way they do in Utilities or Productivity. When organic growth slows, teams reach for the discount lever.
The risk is habit formation. Nine in ten subscriptions across the market sell at full price. Apps that discount publicly train users to wait — if your main paywall regularly shows a discount, you're bidding against your own full-price offers. The data-supported approach is to reserve discounts for post-close offers: shown only to users who hit the paywall and didn't convert, not broadcast to everyone. For a full breakdown of what makes a high-performing paywall in 2026, including how top apps structure post-close offers, see that article.
The discount playbook that doesn't backfire
Post-close welcome offers are now common across every major category. The implementation: a banner or screen that appears after the onboarding paywall is dismissed, offering a time-limited discounted annual plan. Only users who showed intent but didn't convert see it. Everyone else pays full price. This approach captures price-sensitive users without eroding full-price conversion for the rest of your base.
What paywall configuration works for Education apps?
The data across 105,000 paywalls in the SOIS 2026 report gives a clear hierarchy for paywall performance:
- Onboarding paywalls with trials convert at 1.78% on average — the highest of any paywall configuration
- Hard paywalls generate 21% higher LTV per subscriber than soft paywalls
- Soft paywalls convert roughly 50% better but bring in lower-value users
- Weekly plans with trials produce $54.50 in 12-month LTV vs. $7.40 without a trial — a 636% difference
For Education specifically, the onboarding paywall is essential — but the late trial-start data means you need a second paywall strategy. Build an in-app paywall that surfaces to users who return after Day 7 or Day 14. These are the Education users who didn't convert on onboarding but came back — and 23.5% of your trial starts are waiting in that cohort.
Hard vs. soft paywall is a test worth running. Hard paywalls produce higher LTV subscribers, but Education users often want to experience a lesson or module before paying. A hybrid approach — soft paywall with limited free content, then a hard gate — is common in the category. The Paywall Newsletter's Education edition covers how Blinkist, Quizlet, and Chegg handle this tradeoff with real paywall teardowns.
How does Education compare on retention?
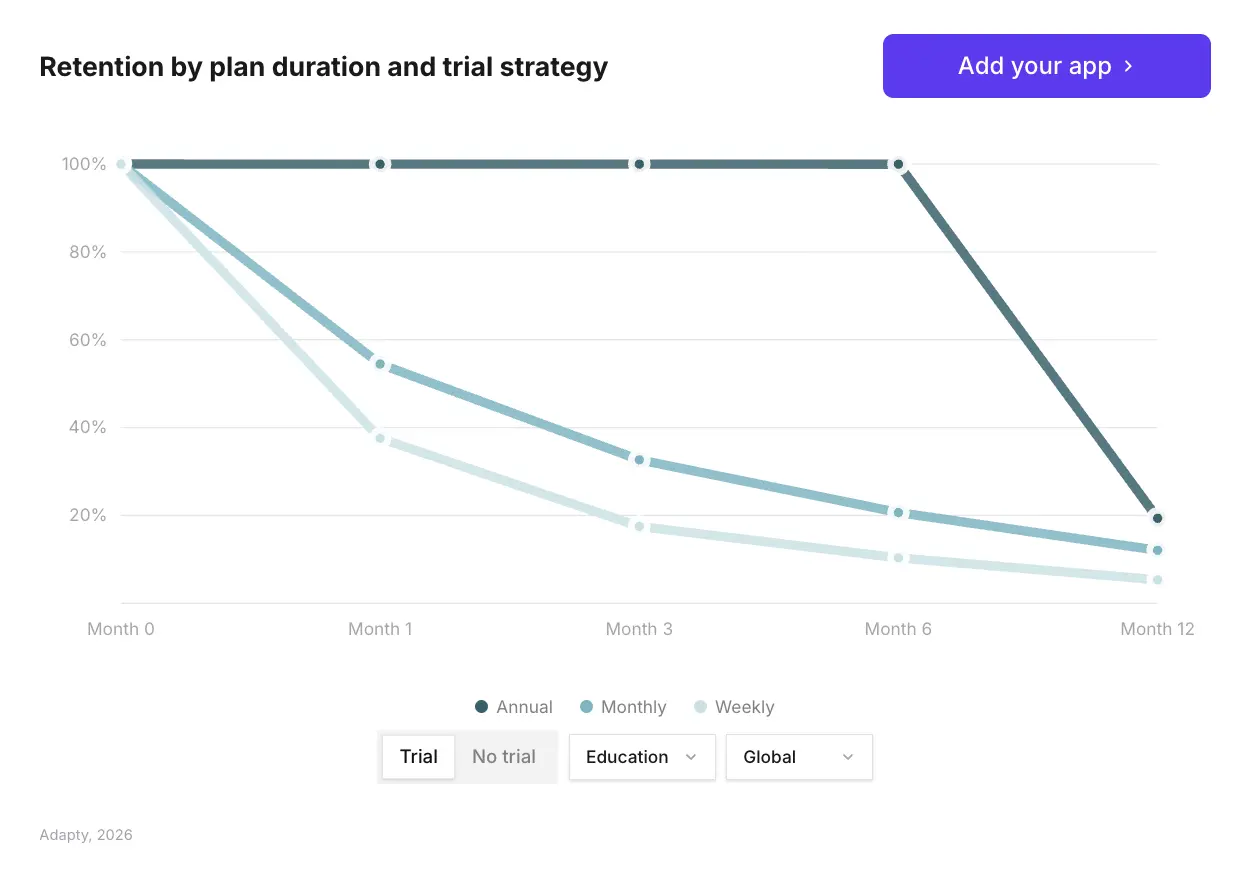
At the plan-type level, the SOIS 2026 retention data shows annual trial subscribers retaining at 19.9% at Day 380, monthly at 14.2%, and weekly at 5.5%. These are cross-category figures, but they define the hierarchy Education apps operate within.
Trial subscribers retain 1.4-1.7x better than direct buyers across all plan types globally. Given Education's +50.4% trial LTV premium, a subscriber base weighted toward trial-converted annual users will show the strongest retention profile. That's the combination to optimize toward: trial entry, annual plan conversion.
Utilities leads all categories in first-renewal retention at 58.1%. Health & Fitness is last at 30.3% — a 27.8 percentage point gap between best and worst categories. Education sits between those extremes. The category's late-engagement pattern (users returning weeks after install) suggests retention strategies that re-engage lapsed users can compound LTV in ways that are less available in more Day-0-dependent categories. For a broader view of how revenue concentration affects retention strategy, see what makes a subscription app successful in 2026.
Retention reference
| Metric | Benchmark |
| Global first-renewal retention (all categories) | 59.2% |
| Utilities first-renewal retention (category leader) | 58.1% |
| Health & Fitness first-renewal retention (lowest) | 30.3% |
| Annual trial subscribers at Day 380 | 19.9% |
| Monthly trial subscribers at Day 380 | 14.2% |
| Weekly trial subscribers at Day 380 | 5.5% |
| Trial vs. direct buyer retention lift | 1.4-1.7x across all plan types |
How competitive is the Education category?
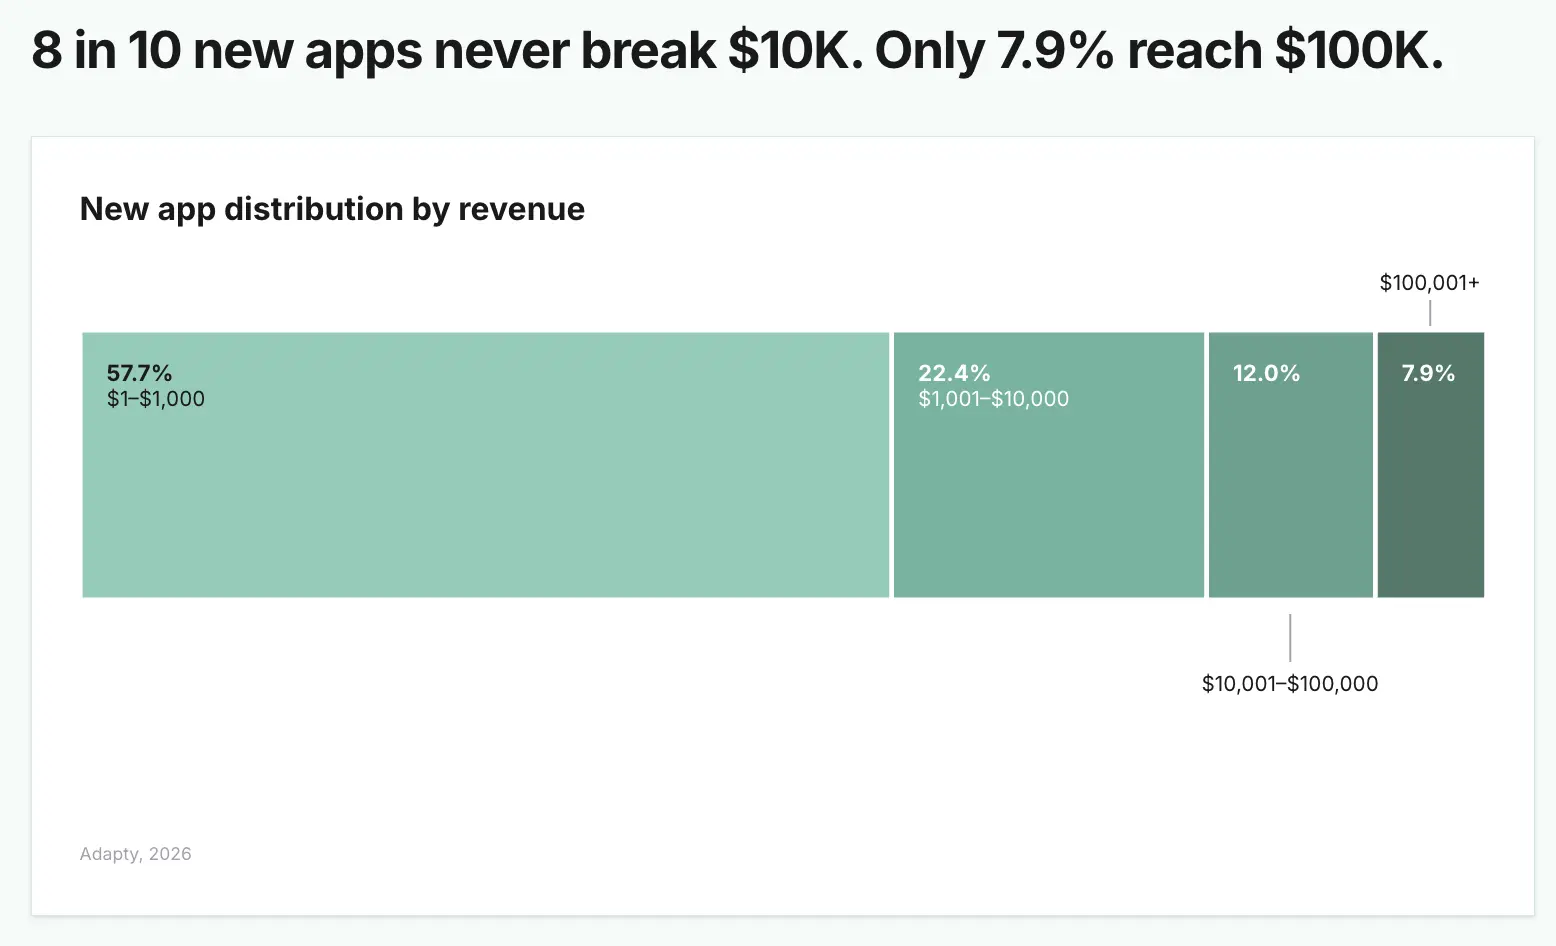
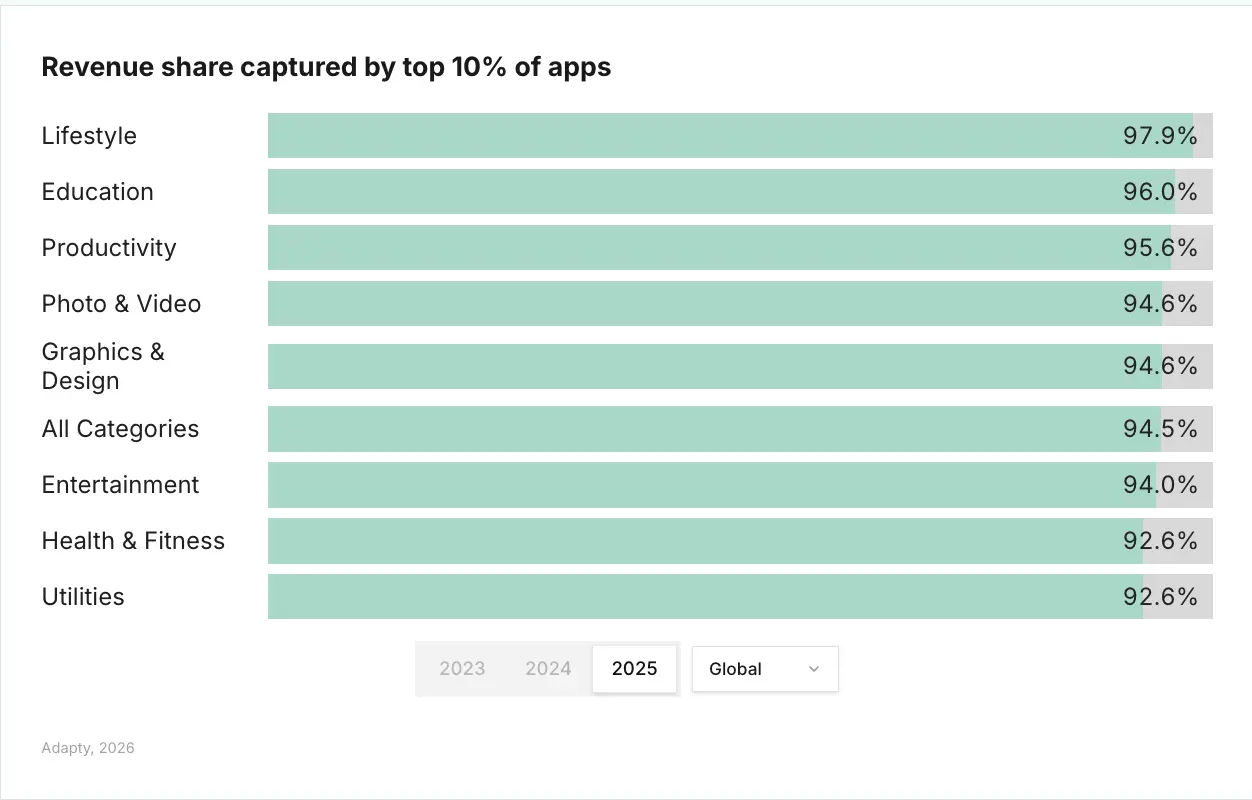
The market-wide concentration figures set the context. The top 10% of apps now capture 95% of all subscription revenue — up from 92.7% in 2023. Newer apps earn roughly 25% less at the median than apps launched a few years ago. For a full breakdown of what separates top-performing apps from the rest, see how much a subscription app makes.
Within Education, concentration is real but not as extreme as the worst categories. Lifestyle is the most concentrated at 97.9% of revenue going to the top 10%. Education sits closer to the overall market average. That 2-3 percentage point difference represents a real opportunity for apps that can carve out a specific niche — a language, a subject, an age group, a certification — and execute monetization well.
The experiment data gives a concrete benchmark. Apps running 50+ experiments have a median revenue of $914,734 versus $48,848 for apps running just one — an 18.7x premium. Among apps that test regularly, the average is 14.7 experiments per year. For Education apps, the highest-ROI experiment types are trial structure, plan duration, and localization — not visual or copy changes, which win at roughly half the rate. The paywall experiments playbook covers the right test sequence in detail.
The localization opportunity in Education
Localization tests win 62.3% of the time — the highest win rate of any experiment type in the dataset. For Education apps, this is particularly high-leverage. Japan is the fastest-growing major market globally by subscription revenue growth, and it's not easy to localize for (script complexity, cultural expectations). That barrier keeps many competitors out. Mexico and Turkey are also growing markets where localized paywalls can outperform global defaults.
Benchmark your Education app against the market
The SOIS 2026 report is fully interactive — filter any chart by region, category, and plan type to see exactly where your app ranks. If you want to run the experiments the data points to, Adapty's A/B testing tools let you test paywall structure, plan combinations, trial length, and pricing without app store releases.