Web paywalls on iOS, one year in: What the data says about app-to-web in 2026
17 min readRead
Author
65 posts
Entertainment apps average $0.59 install LTV and 19.1% trial-to-paid conversion — the lowest of any category. Here's what the data says about pricing, trials, and Android.

Productivity apps leads all categories at $46.97 average LTV — but direct buyers outperform trial users by $7.82. 2026 benchmarks for pricing, conversion, and retention from $3B in subscription revenue.

Health & Fitness apps leads all categories with $1.21 install LTV. 2026 benchmarks on pricing, trials, conversion, and plan mix — based on $3B in subscription revenue.
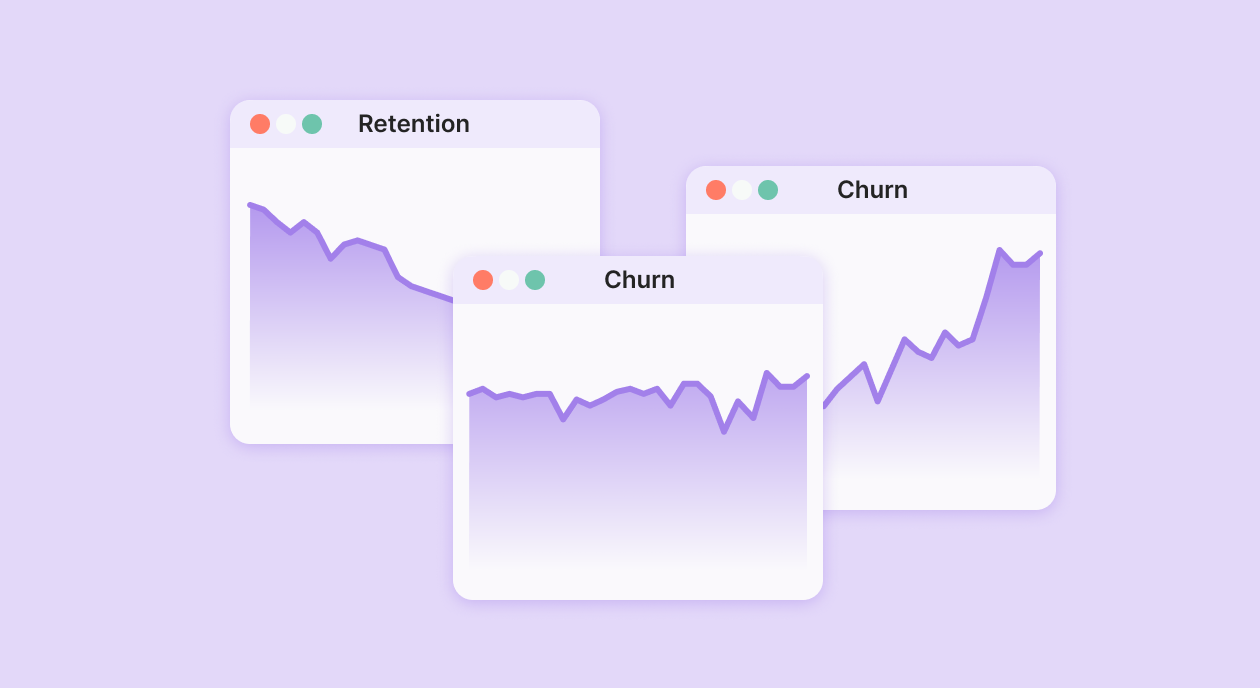
Your churn rate changes based on plan type, trial vs. direct, and category. Data from 16,000+ apps shows how to read each dimension correctly.
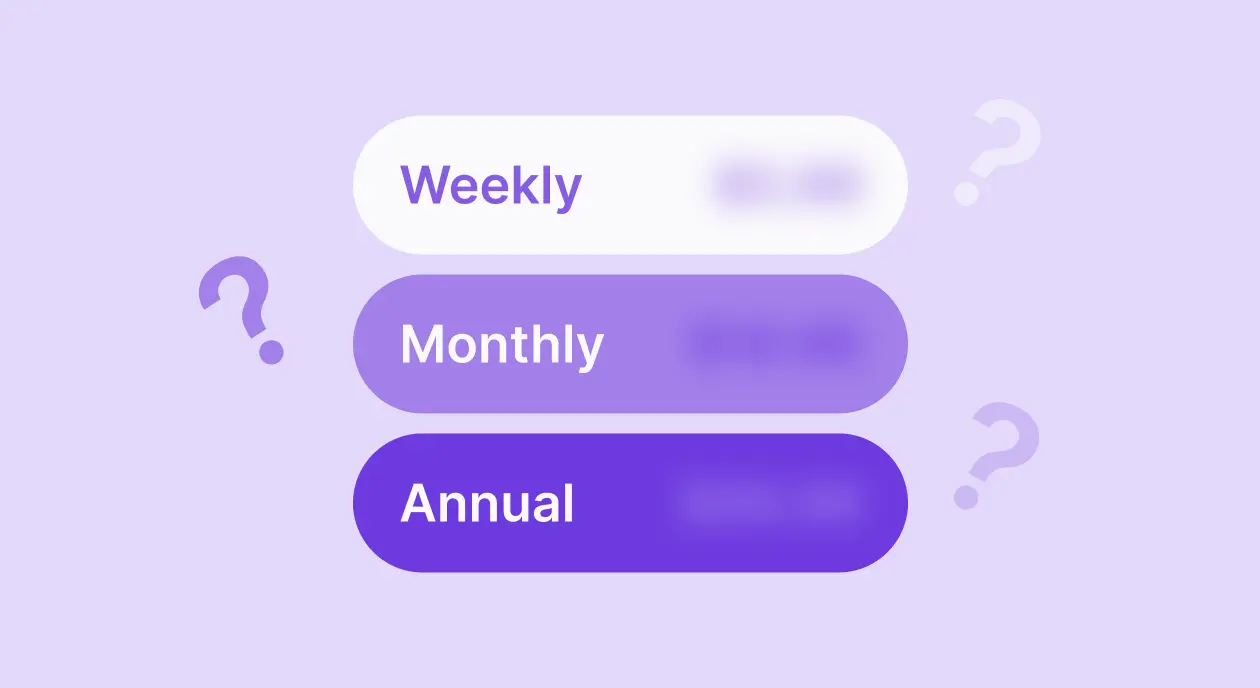
Weekly subscription plans now generate 55.5% of all app revenue. But the right subscription plan type depends on your category. Data from 16,000+ apps.
95% of subscription revenue goes to the top 10% of apps. Data from 16,000+ apps reveals the 3 myths holding most subscription apps back in 2026.
Trials lift LTV in Utilities and Health & Fitness. In Productivity, direct buyers are worth 16% more. Data from $3B in subscription revenue across 16,000+ apps.
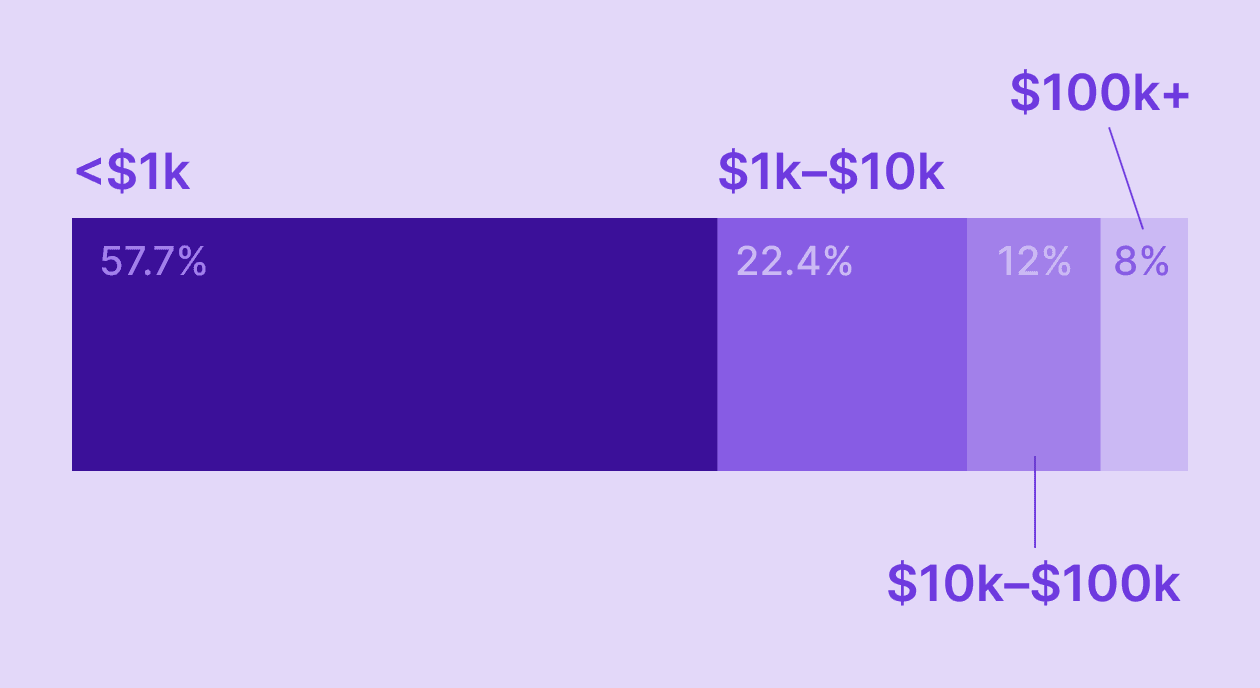
58% of new subscription apps earn under $1K/year. Here's what the full revenue distribution looks like — by category, platform, and app type. Based on $3B in real data.
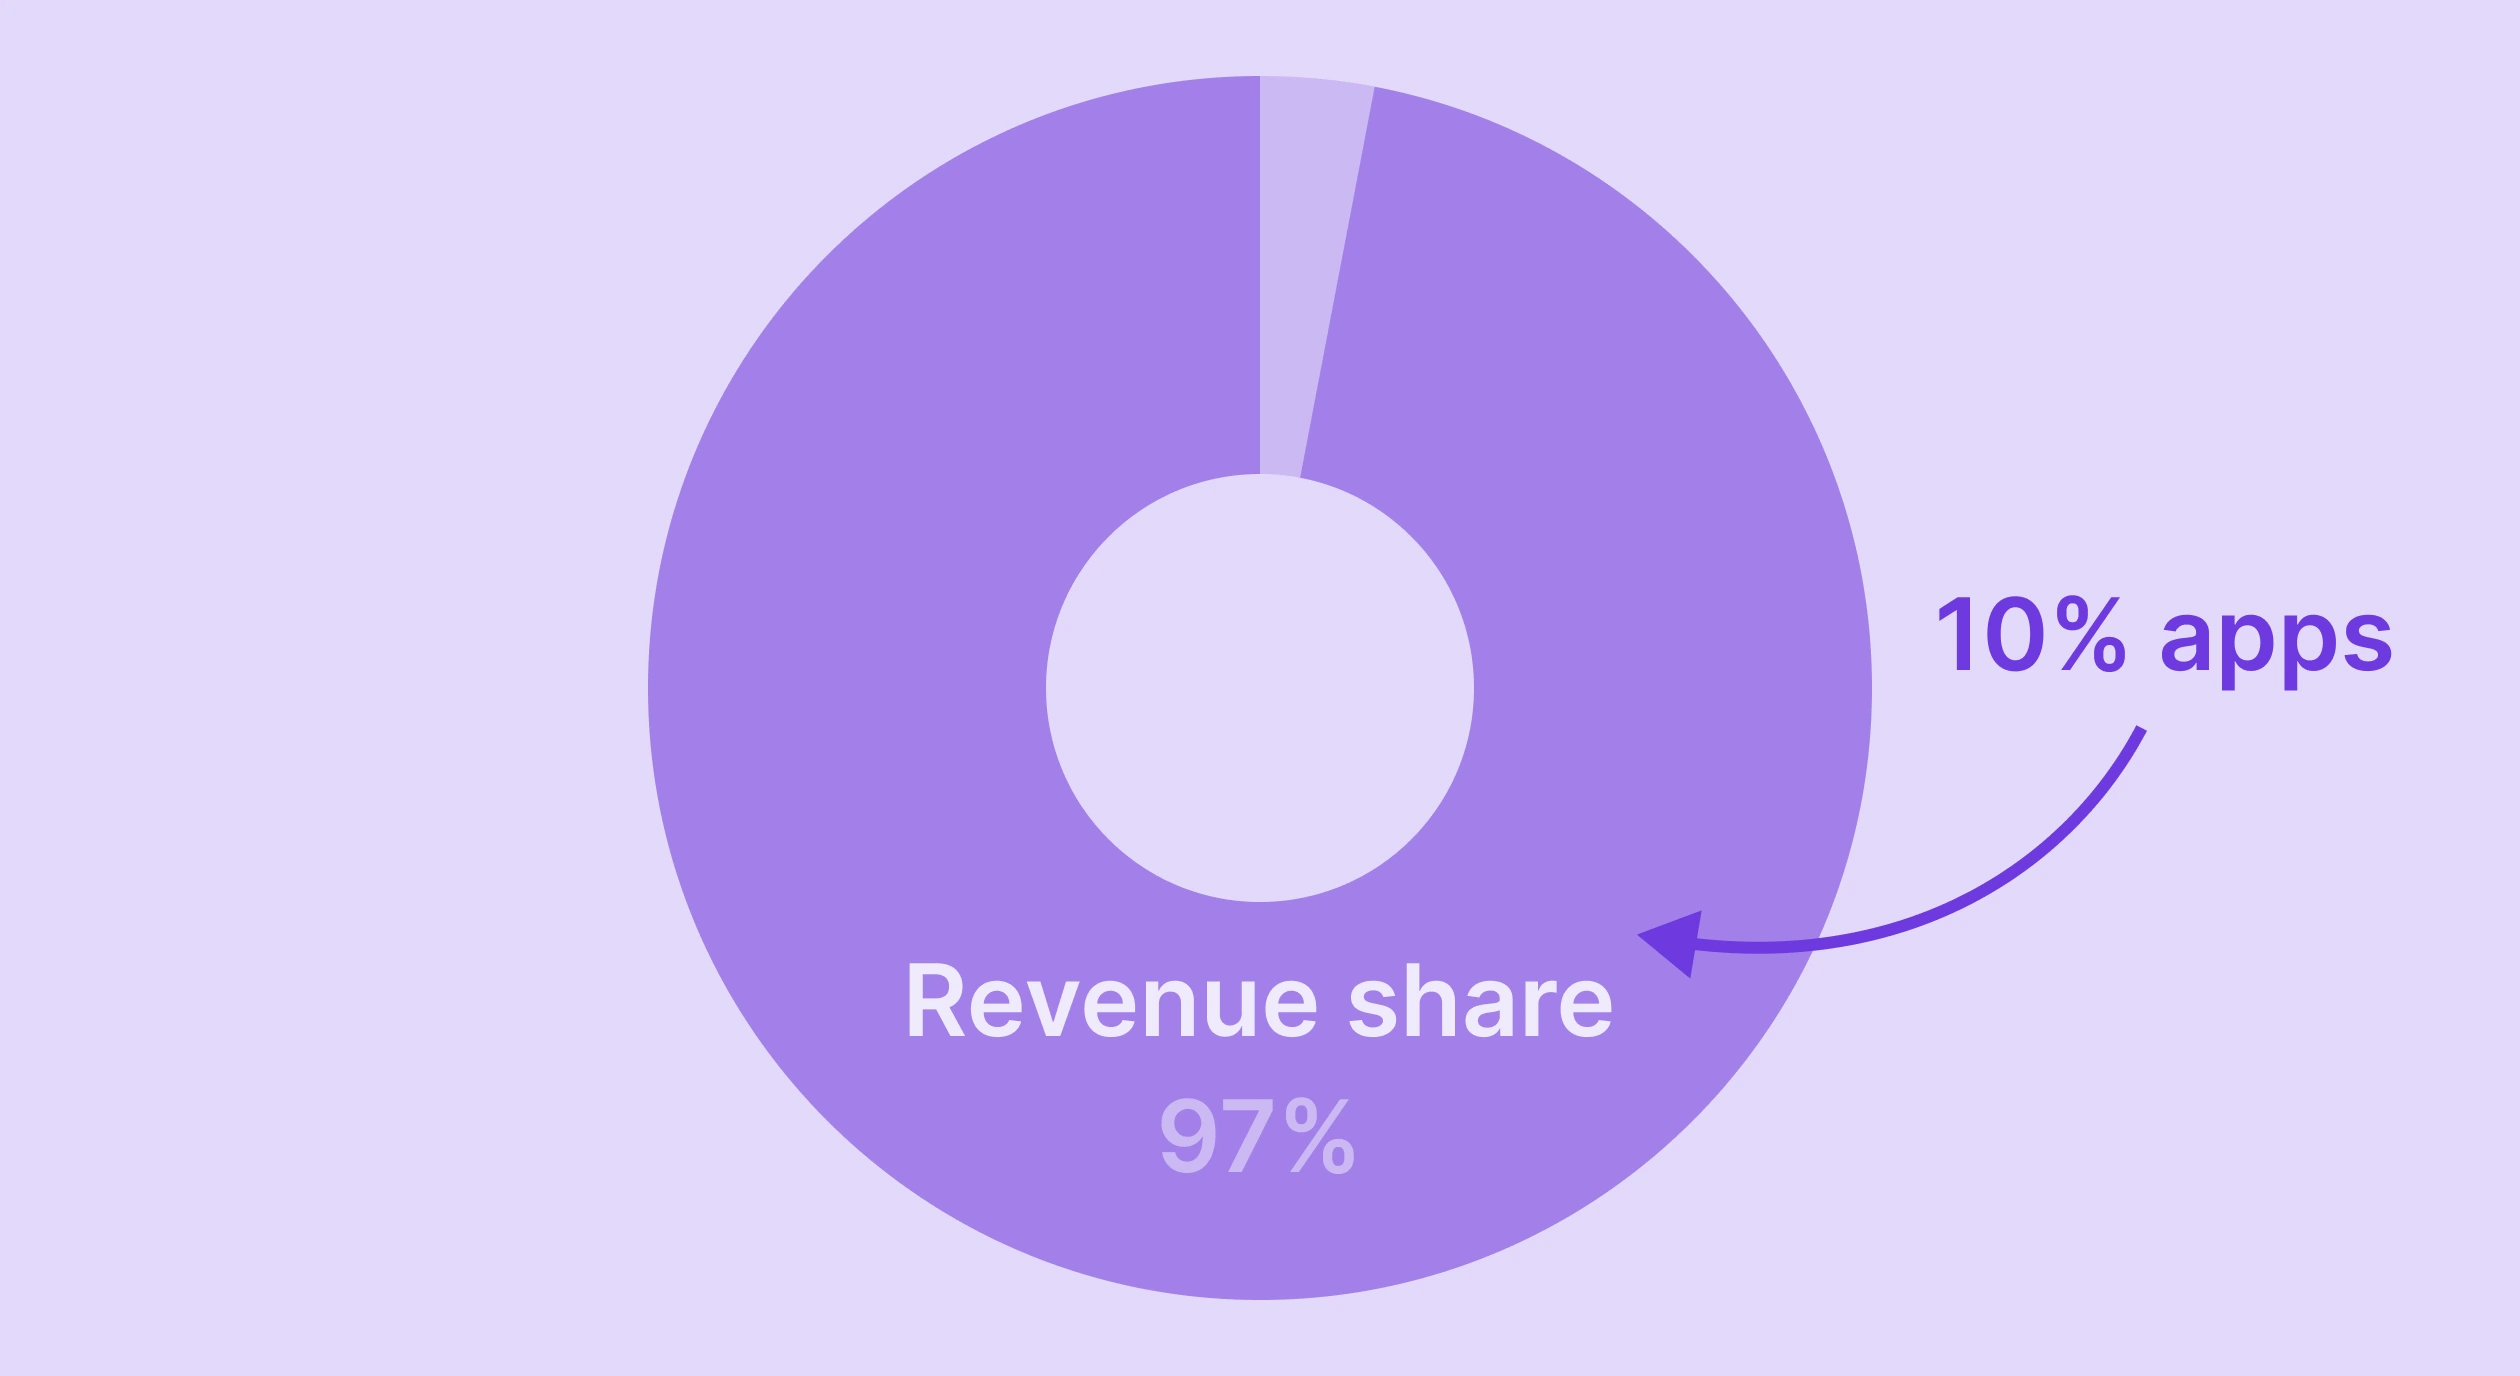
The top 10% of apps capture 94.5% of all subscription revenue — up from 92.7% in 2023. Here's what the data says and what to do about it.

Japan, Mexico, and Turkey are the fastest-growing app markets in 2026. Full regional breakdown based on $3B in subscription revenue data.
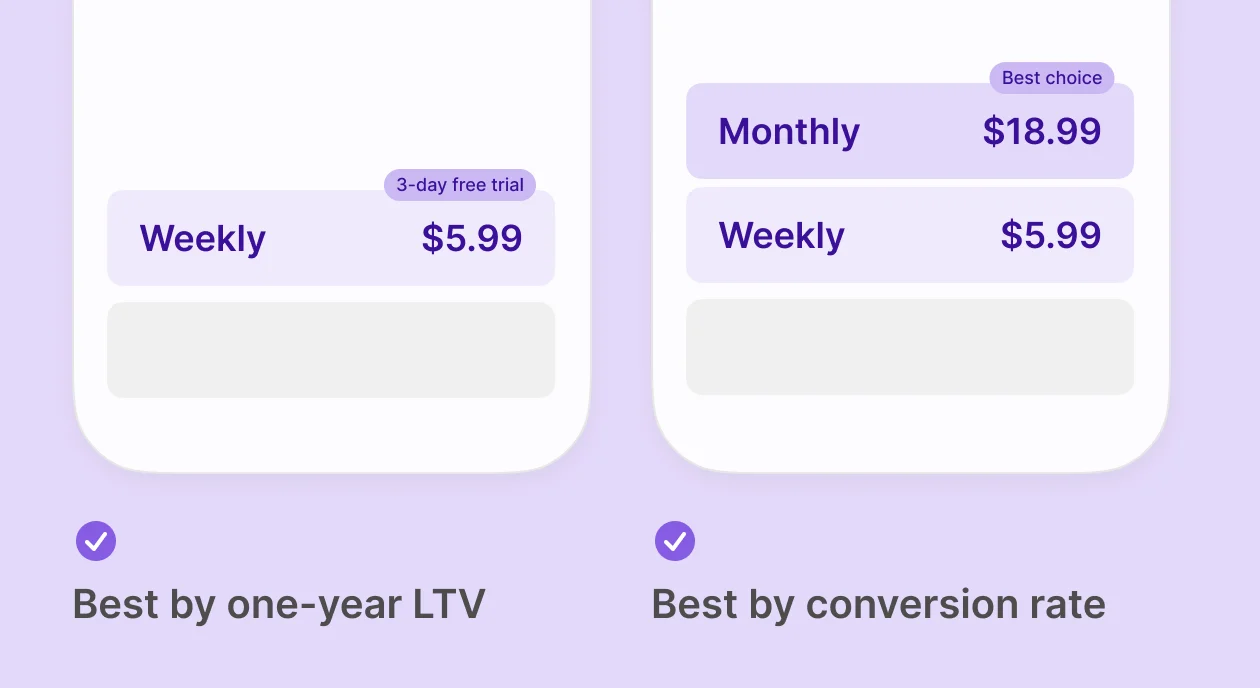
Data from 16,000+ apps reveals what separates high-converting paywalls from the rest — plan type, trial setup, pricing, placement, and what to test first.
Weekly plans now drive 55% of app revenue. Trials hurt LTV in 4 out of 8 categories. Here's what SOIS 2026 data from thousands of apps actually tells you.