What makes a subscription app successful in 2026?

TL;DR:
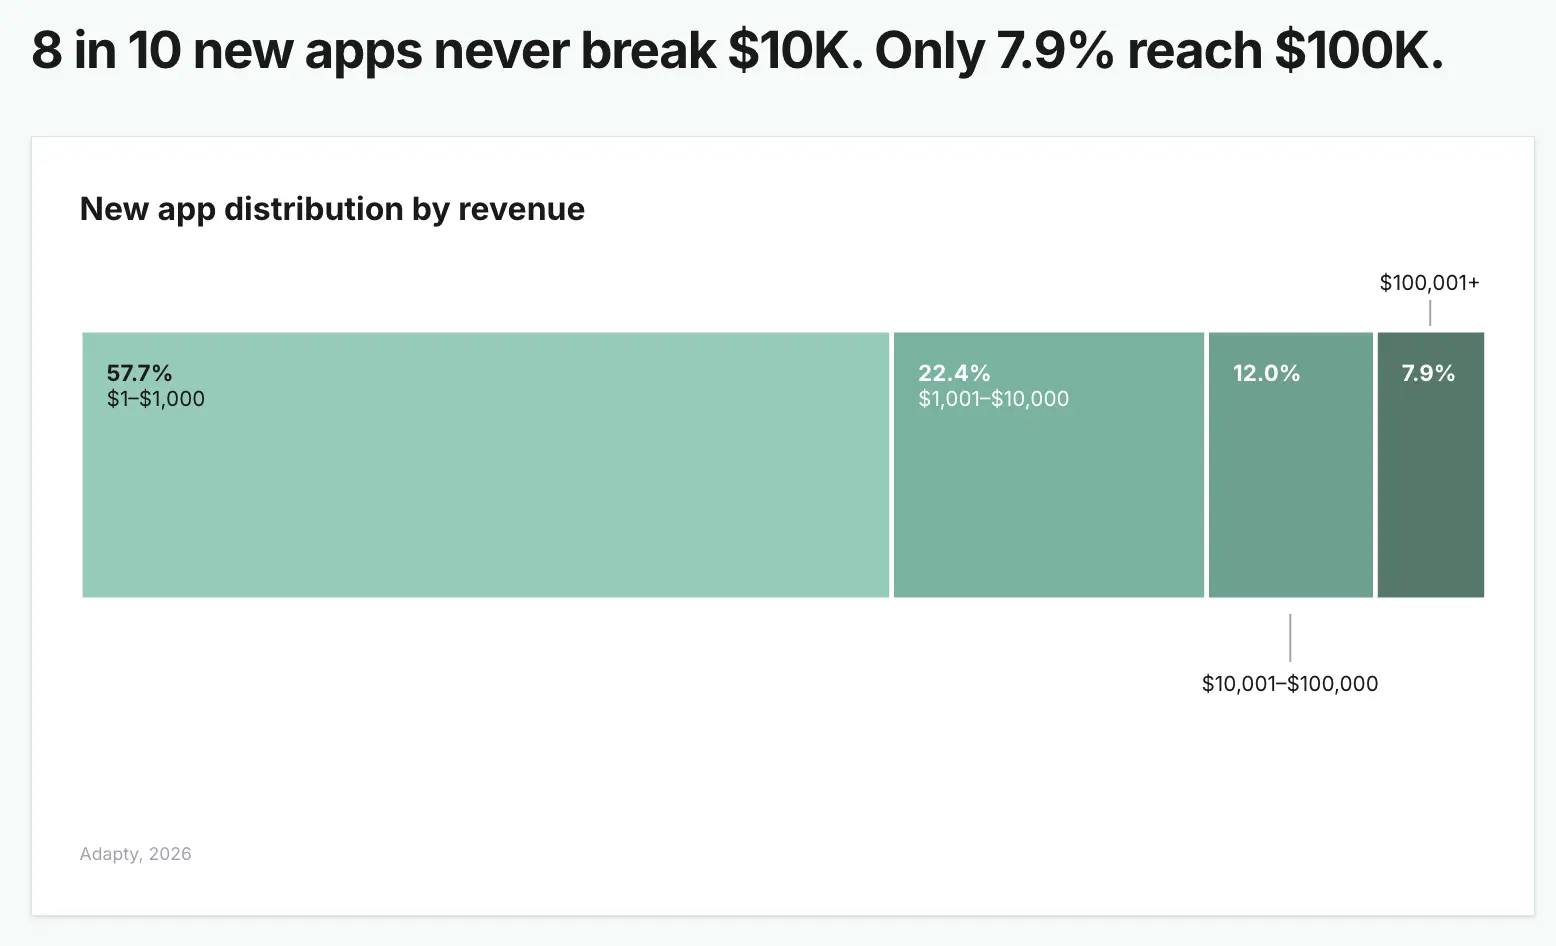
- 57.7% of new subscription apps never cross $1,000 in total revenue. Below ~$100K, this is almost never a pricing or paywall problem.
- The top 10% of apps capture 95% of all subscription revenue — and the gap grew again this year.
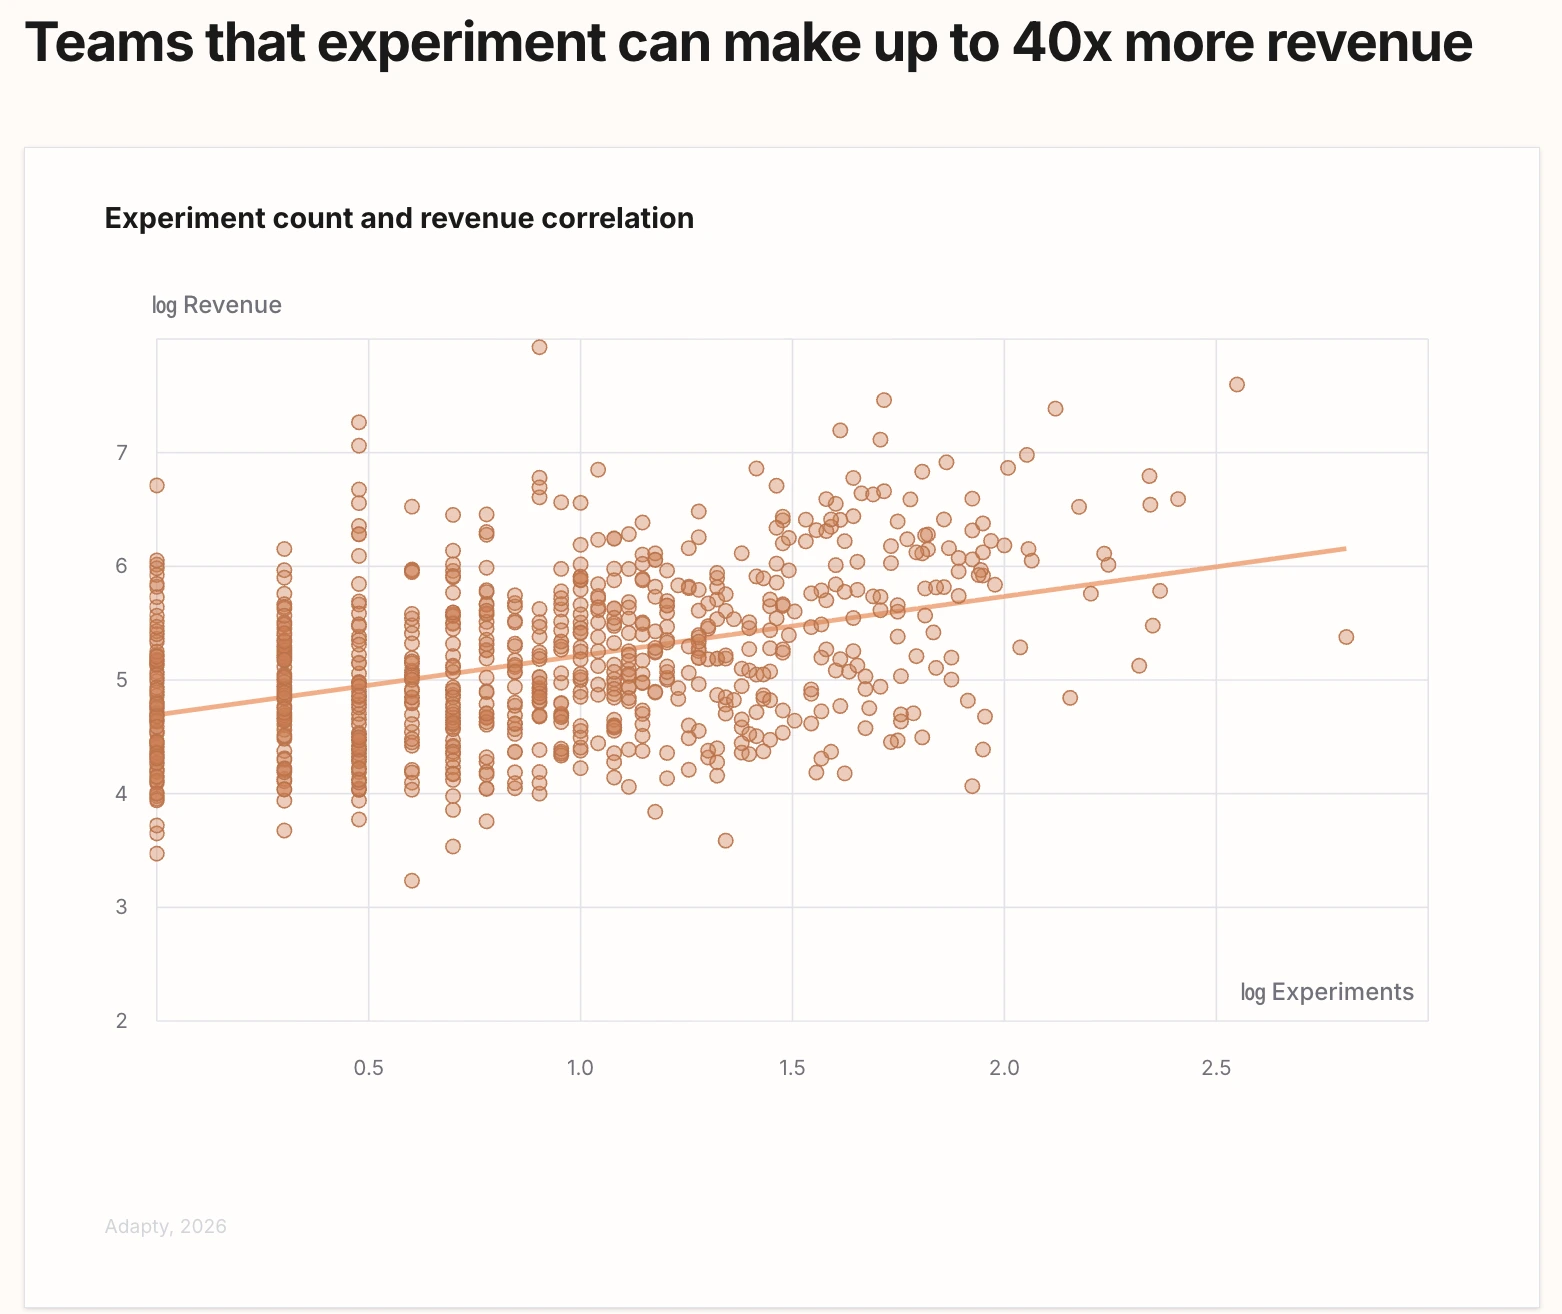
- Apps running 50+ experiments earn 18.7x more than apps that run just one. Velocity beats strategy.
- Weekly plans with trials generate 636% more 12-month LTV than weekly plans without trials.
- Localization delivers higher LTV uplift than repricing. Most teams test in the wrong order.
- 90% of trial starts happen on Day 0. Your onboarding paywall is your entire monetization strategy.
Most conversations about subscription app success are about tactics. Paywall design. Trial length. Weekly vs. annual. Discount timing.
Those things matter. But they matter a lot less than most people think — and for most apps, at most stages, they’re not the actual problem.
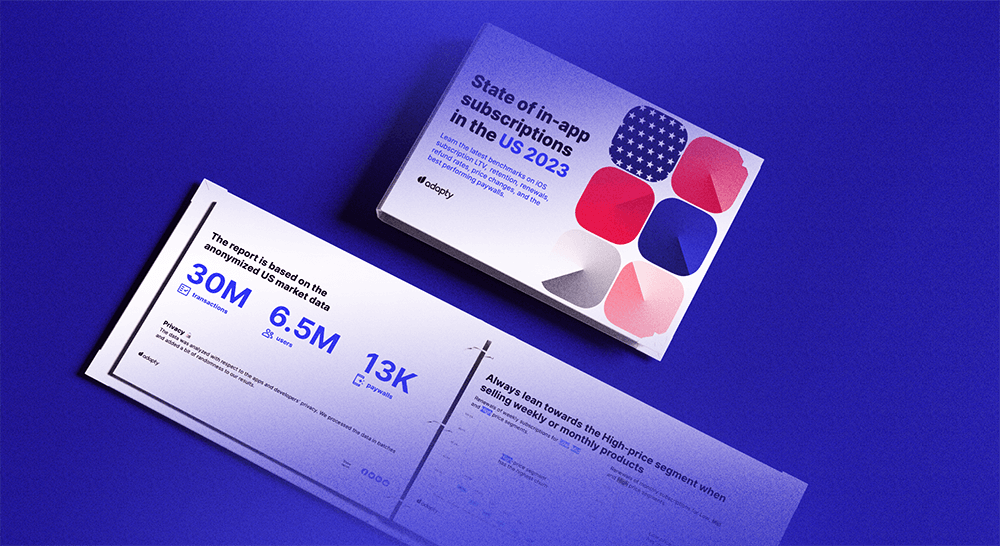
Adapty’s State of in-app subscriptions 2026 covers $3 billion in subscription revenue across 16,000+ apps. It’s the most comprehensive dataset on how subscription apps actually perform, and a lot of what’s in it cuts against the conventional wisdom.
Three myths in particular.
Myth #1: You need a better paywall
| THE MYTH | THE DATA |
| My conversion rate is low. I should redesign the paywall, test a new headline, or adjust my pricing. | 57.7% of apps never cross $1,000 total. Below ~$100K revenue, conversion problems are almost always product-market fit problems in disguise. |
Here’s what the data actually says: the majority of subscription apps that struggle aren’t struggling because their paywalls are bad. They’re struggling because not enough users find the product valuable enough to pay for it.
57.7% of new subscription apps never cross $1,000 in total revenue. The instinct, when conversion is low, is to reach for the paywall — new copy, new design, new pricing. That instinct is often wrong.
No amount of paywall optimization rescues an app that users don’t find valuable enough to pay for. And the data on what a high-performing paywall actually looks like only matters once you have product-market fit.This is the most uncomfortable line in the report, and it’s worth sitting with.
The inflection point is roughly $100K in revenue. Below that threshold, paywall experiments, trial length tests, and pricing tweaks tend to have low signal. There aren’t enough users for results to be statistically meaningful, and the underlying problem is usually upstream of the paywall entirely.
Above $100K, the calculus changes. Now you have a monetization problem, and now the tactics start to matter. The 62.3% LTV uplift from localization. The 18.7x revenue difference between apps that run 50+ experiments and apps that run one. But those numbers don’t help you if users aren’t converting because the product doesn’t solve a real problem.
The bottom line: If you’re below $100K in revenue, your highest-ROI activity is probably not a paywall test.
Myth #2: You need a better strategy
| THE MYTH | THE DATA |
| I need to figure out the right approach — the right plan structure, the right trial setup, the right pricing — and then execute it. | Apps running 50+ experiments earn 18.7x more than apps running one. The strategy is the experimentation, not what comes before it. |
There’s a persistent belief that the top-performing apps figured something out — a strategy, a framework, a formula — and then executed it well. The data doesn’t support that.
Apps that run 50 or more experiments earn 18.7 times more revenue than apps that run just one. That’s not a marginal difference.
The apps winning in 2026 aren’t running one smart test per quarter. They’re running a continuous experimentation system. They publish paywall changes without app store reviews. They test plan structures, trial setups, and localization in parallel. They know which test types actually move revenue.
Here’s what that hierarchy looks like across test types:
- Localization tests: 62.3% win rate
- Trial setup tests: 59.6% win rate
- Plan duration tests: 58.7% win rate
- Visual and copy changes: 34.6% win rate
Most growth teams start with visual changes because they’re fast and require no engineering. They’re also the least likely to move meaningful revenue. The tests that actually compound — localization, trial structure, plan duration — are structural. They require more coordination, but they win at nearly double the rate.
90% of trial starts happen on the day of install. Your onboarding paywall isn’t one part of your monetization strategy. For most users, it’s the only part. The user opens the app, hits the paywall, and decides. There’s no “I’ll think about it and come back.”
The bottom line: The question isn’t what’s the right strategy. It’s how fast can you find out what works for your app and your users. Experimentation velocity is the strategy.
Myth #3: You need a better price
| THE MYTH | THE DATA |
| My LTV is low. I should test a lower price to convert more users, or a higher price to capture more value per subscriber. | Localization delivers more LTV uplift than repricing. And the paywall setup that maximizes Day 0 LTV is often different from the one that maximizes 12-month LTV. |
Pricing tests are the default move when LTV stalls. They’re also, per the data, one of the lower-ROI moves available.
Localization — translating your paywall for specific markets and adjusting pricing to match regional purchasing power — delivers more LTV uplift than repricing in the majority of cases. It wins 62.3% of the time in experiments. Pricing structure tests win at roughly half that rate.
Regional pricing also matters more than most teams realize. The global median subscription prices in 2025: $7.48/week, $12.99/month, $38.42/year. But those medians mask enormous variation.
- Switzerland generates the highest median 12-month LTV globally at $28.50 per user
- Qatar sits at $27.50, Israel at $27.00
- The US is at $19.90 — below all three
- Top Latin American markets generate LTV roughly 35% lower than top European ones
- Europe rose 18% year-over-year in subscription pricing
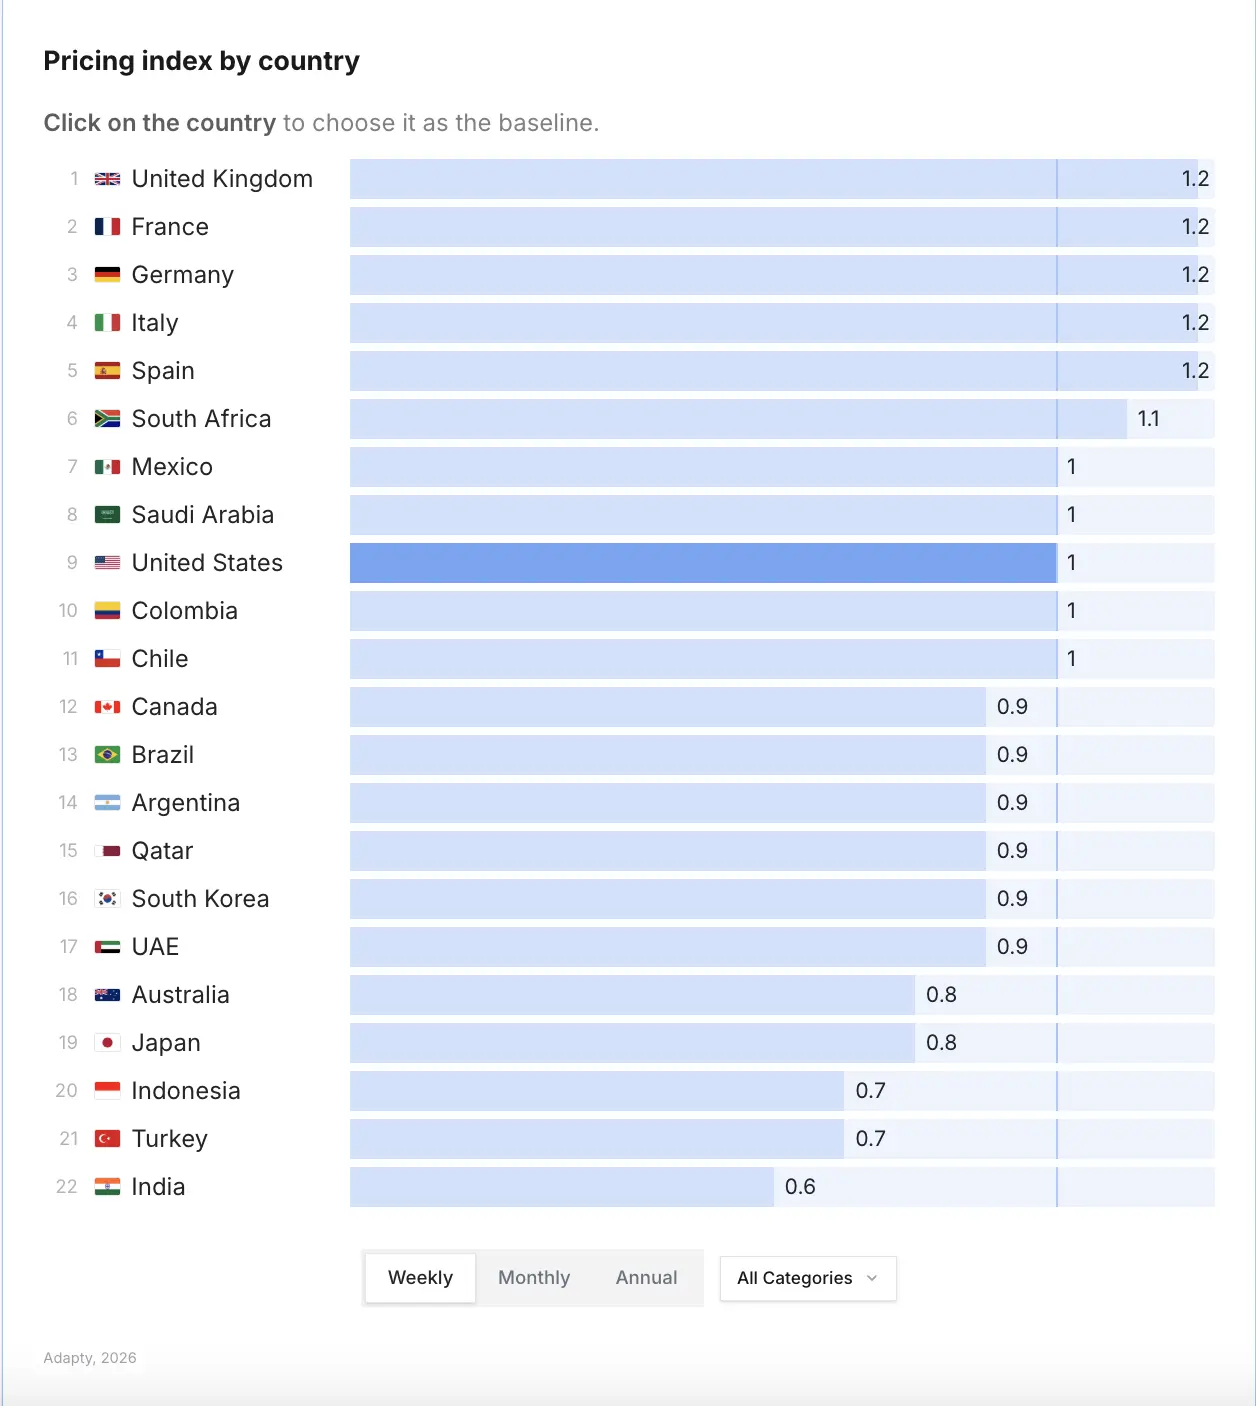
If you’re charging the same price in Germany and Brazil, you’re almost certainly underpricing one market and creating friction in another. Adapty’s pricing index puts the UK, France, Germany, Italy, and Spain all at 1.2x relative to the US baseline. India sits at 0.6x, Turkey at 0.7x.
The other pricing nuance the data surfaces: optimizing for Day 0 LTV and optimizing for 12-month LTV are not the same thing. The paywall configuration with the lowest Day 0 conversion often produces the highest 12-month LTV. Most teams are measuring the wrong metric.
Weekly plans now account for 55.5% of all subscription revenue, up from 43.3% just two years ago. Monthly lost nearly half its revenue share in the same period. Annual dropped too. Weekly didn’t just grow — it cannibalized both simultaneously. The plan that gets you the most conversions today may not be the plan that delivers the most revenue over 12 months.
The bottom line: Before your next pricing test, run a localization test. And make sure you’re measuring 12-month LTV, not just Day 0 conversion.
What does success actually look like in 2026?
The revenue concentration numbers set the context for everything else. The top 10% of apps now capture 95% of all subscription revenue, up from 92.7% in 2023. Newer apps already earn roughly 25% less at the median than apps launched a few years ago.
More apps, more competition, lower median revenue per app. The market is maturing and consolidating at the same time.
The apps that are pulling away share a few structural patterns that show up consistently in the data:
- They have product-market fit before they optimize monetization. This sounds obvious. The data suggests it’s not widely practiced.
- They run experiments at high velocity. 50+ per year, not 4. They’ve built the infrastructure to test without app store reviews.
- They’ve localized pricing for key markets. Not just translated the UI — actually adjusted pricing to match regional purchasing power.
- They measure 12-month LTV, not just Day 0 conversion. These metrics often point in different directions, and most teams default to the one that’s easier to see.
- They run structural tests first. Trial setup, plan duration, localization — before visual changes or copy tweaks.
None of this is secret. The benchmarks are public. The patterns are documented. The question is whether you use them.
The State of In-App Subscriptions 2026 covers LTV by category and region, conversion benchmarks by plan type and trial setup, pricing data across 22 countries, paywall performance across 105,000 paywalls, and experiment win rates by test type. It’s interactive — filter any chart by your category, region, and plan to see where your app ranks.
If you’re ready to run the tests: Adapty’s A/B testing tools let you test paywall structure, plan combinations, trial length, and pricing without app store releases.