How to lower Apple Ads CPA: diagnostic guide for 2026

TL;DR:
- Apple Ads CPA is ad spend divided by installs.
- There are only two ways to lower it: pay less per tap, or convert more taps into installs.
- The 2026 Adapty Apple Ads report shows the spread across 90 countries. CPT varies 14× from market to market; conversion rate varies from sub-40% to 78% across niches.
- The diagnostic: compare your CPT to the median, then compare your CR to the median. The one further from the median is the lever to pull.
- High CPA isn't always a problem. In markets where conversion justifies the cost, the right move is to keep spending.
Apple Ads cost-per-acquisition (CPA) is the cost of acquiring one installed user.
You apply a simple formula: divide ad spend by installs. Or equivalently, you can divide your cost per tap (CPT) by how often the taps converted (CR).
If you want to run profitable Apple Ads at scale, you need to lower CPA in one of two ways:
- Pay less per tap, which means you improve your tap-through rate, so Apple auction gives you cheaper bids.
- Convert more of the taps you’re already paying for. For this, you need to improve your App Store product page so more visitors install.
Everything else, including keyword strategy, bid management, paywall design, and country mix, is a sub-lever of one of these two.
This article walks through how to diagnose which one is yours, using the country-level data from Adapty's 2026 Apple Ads for subscription apps report.
ℹ️CPA in this article means cost per download. On most ad platforms, including some Apple Ads documentation, CPA is also used to mean cost per action, which is a broader term covering any tracked event. This report measures cost per download specifically: what an advertiser pays when a user downloads the app from a paid ad. Download is also not the same as install. A download is when the user taps Get and the app downloads to their device. An install is when they open the app for the first time. There's typically a 10% gap between the two. This report's CR and CPA figures are based on downloads, not installs.
What should you do to lower Apple Ads CPA?
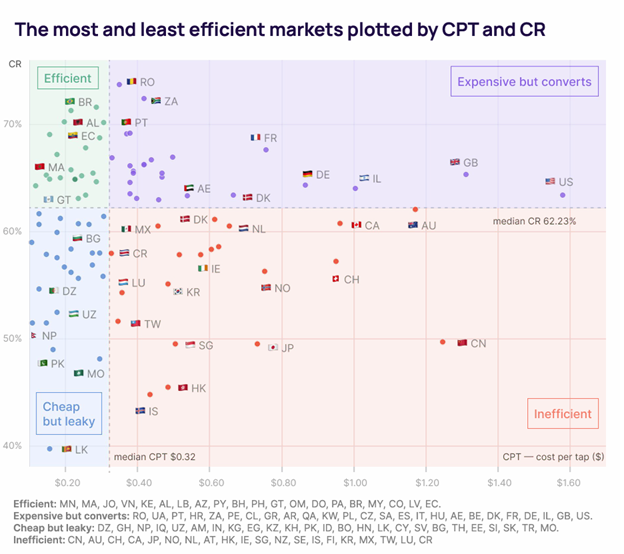
The best way to diagnose this is to look at two different numbers within the same market: Your cost-per-download (CPA) and conversion rate:
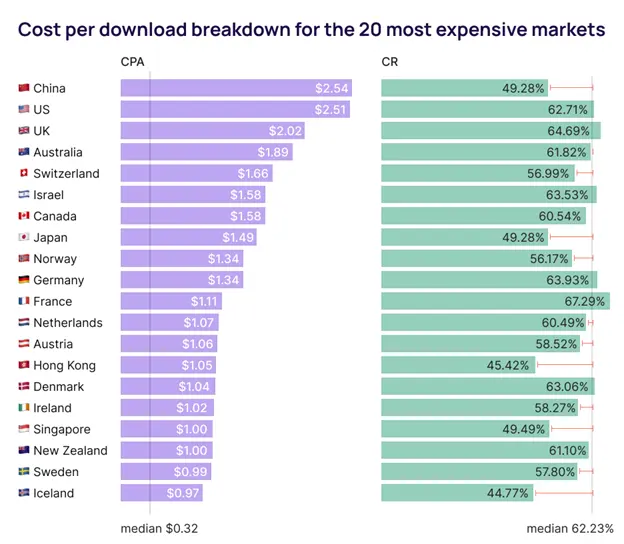
Three examples from the chart:
China and the US. Both pay nearly identical CPAs, $2.54 and $2.51. Their conversion rates are 13 points apart. The US converts at 62.71%, just above the global median. China converts at 49.28%, well below. Same auction price, very different funnel performance. In the US, the high CPA is the auction. In China, the high CPA is the funnel.
France. Pays $1.11 per acquisition, converts at 67.29%, well above the median. France's CPA isn't a problem. The auction is expensive, but the funnel earns it back. If you're running ads in France with a CPA in this range, the diagnostic says: don't change anything.
Iceland. Pays $0.97 per acquisition with the worst conversion rate in the dataset, 44.77%. Both levers are broken. Fix the funnel first, because as the CR improves, the auction tends to follow.
The pattern holds regardless of which market you're in.
What you can do: Compare your CPT to the median for your country. Compare your CR to the median for your niche. The number further from the median is where the opportunity is.
How to lower Apple Ads CPA by lowering your cost per tap (CPT)
Cost per tap is set by Apple's auction.
The auction prices your bid against two things: how much you're willing to pay, and how relevant your ad appears to be. Relevance is often overlooked.
Tap-through rate is the clearest relevance signal. An ad that gets tapped more often is more relevant to the search, and ad platforms reward relevance with cheaper bids.
If your CPT is high, the answer is usually to be more relevant. The sub-levers worth pulling are below, but for the deeper tactical guide, see our Apple Ads best practices article, too.
Keyword specificity
Broad keywords like "AI" attract a wide audience but rarely deliver high TTR because the user's intent is unclear.
Specific keywords like "AI video generator" attract a narrower audience that's more likely to tap.
Apply Apple's match types: exact match for high-intent keywords you want to own, broad match only where you're explicitly discovering new terms.
Country mix
The five most expensive auction markets: the US, UK, China, Australia, and Israel, account for most of global Apple Ads spend.
If your blended CPT is high, expanding into mid-tier markets with strong conversion drops the blended cost without changing anything about your campaigns.
Negative keywords
Filter out searches that drag down your TTR.
A "free VPN" search rarely converts into a paid app, because the searcher is filtering for price.
Including it in your match types pulls your TTR down for the auction and raises your effective bid on the keywords that do convert.
Bid strategy
If you're using max CPT bids without a target CPA, you're paying for tap volume regardless of efficiency.
Setting target CPAs lets Apple's algorithm find the efficient bid for you. The auto-bidder uses TTR and conversion signals to optimize.
How to lower Apple Ads CPA by raising your conversion rate
Conversion rate is set by your App Store product page. Every tap lands there, and what the user sees determines whether they install.
The 2026 report shows how much conversion varies.
- Across 59 sub-categories, conversion rates range from under 40% to over 78%.
- PDF Reader, Remote Control, and Screen Recorder lead at 77-78%.
- Driver License and Flight Tracking apps sit below 50%.
The range is wider than the CPT range in most markets, which is why conversion is often the bigger opportunity.
The principle behind product page conversion is one that CRO teams have worked with for decades.
If your ad promises one thing and your store listing shows something different, trust drops and conversion drops with it.
The same principle applies on the web. Unbounce's analysis of 464 million visits to 41,000 landing pages found that messaging-page match is one of the top three variables driving conversion rate variance.
The key levers to pull:
Custom Product Pages
Match the product page to the specific keyword that triggered the ad.
A user searching "AI animation" sees a page about motion and character generation. A user searching for "AI photo editor" sees a page about image editing.
💡Our report shows Custom Product Pages (CPP) lift TTR by 12% and CR by 9.6%, compounding to 23% more installs from the same spend.
First screenshot
Most users decide whether to install based on what's visible above the fold.
On the App Store, this means the first one to three screenshots on your page.
The first screenshot does more conversion work than the rest of the listing combined. If it doesn't deliver the value the user searched for, the page doesn't convert.
Subtitle
Thirty characters are visible directly in the search result. Part of the ad creative.
A subtitle that names the specific benefit ("AI Video Generator for Animations") outconverts one that lists features ("Powerful Video Tools").
Localization
A market with strong CPT but weak CR often has a localization mismatch. The user searched in their language and landed on a page in English.
Localize the product page. At a minimum, you should localize the screenshots, subtitles, and first lines of the description for the markets where you're spending.
Paywall personalization
Conversion at the product page is the install rate. Conversion past the install, trial-to-paid, is where revenue actually comes from.
Paywall personalization isn't strictly a CR lever, but it's the underrated CPA lever because it affects cost-per-paying-user, which is what most teams care about.
The report shows tailored paywalls lift trial-to-paid conversion by 24%, with the gap widening over the cohort's life.
How to know when high CPA isn't the problem?
A CPA without an LTV context is half a metric.
The US's $2.51 CPA is high in absolute terms and fine if your blended US lifetime value (LTV) is $8. Optimizing it down to $1.80 by shifting spend to cheaper markets gives you a lower number, but probably lower-LTV users.
The metric that matters is ROAS or payback period, not CPA on its own.
High-conversion markets with high CPAs often have the best ROAS. France's $1.11 CPT looks expensive until you remember the 67% conversion rate, which means the funnel economics work.
The report's CPT-vs-CR quadrant view makes this visible: the markets in the "high CPT, high CR" quadrant aren't problems to solve. They're priced correctly.
The question to ask before optimizing is whether the CPA is high relative to the value the channel returns, or just high in absolute terms.
The diagnostic in the chart above tells you which quadrant you're in.
Why is Apple's own dashboard not enough to do a CPA diagnosis?
Apple Ads gives you the data to start the diagnostic. It doesn't give you enough to finish it.
The dashboard shows CPT, CR, and CPA per campaign and per keyword. That's the input side of the framework.
What it doesn't show is what those installs are worth after they land in your app, which is the half of the equation that decides whether a high CPA is a problem or a price you should be happy to pay.
A user from France with a $1.11 CPT might convert to a paying subscriber at 12% and stay for 14 months. A user from Japan with the same $1.11 CPT might convert at 4% and churn in three.
Apple's dashboard shows the same install in both cases. The downstream economics live in your subscription analytics, not in the ad platform
That's where Adapty Analytics comes in.
Every Apple Ads keyword, campaign, country, and paywall variant connects through to the trial, the subscription, the renewal, and the churn event. The CPT you paid is visible alongside the LTV it bought.
The diagnostic you can run with Apple's dashboard alone is a partial one. The full one needs both halves of the funnel in the same view. Try Adapty for free.