Apple Ads benchmarks for subscription apps 2026
The only Apple Ads benchmarks built on real subscription data
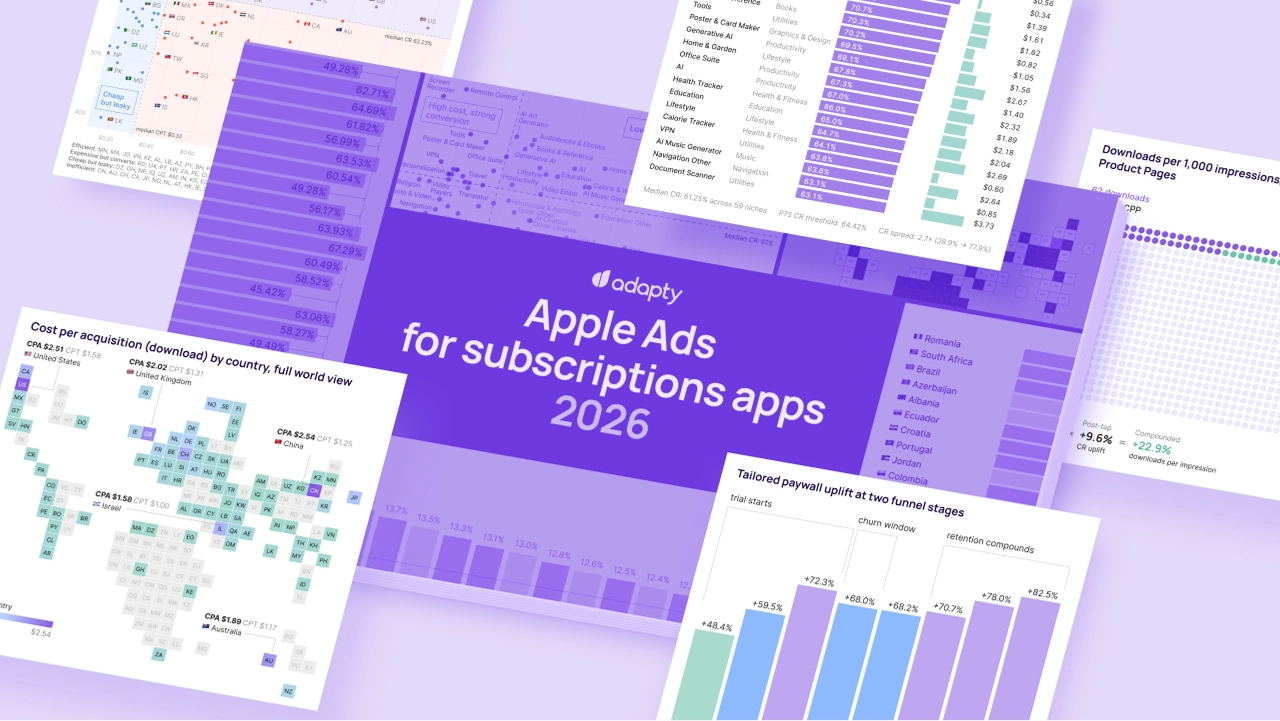
Acquisition cost swings 14x between markets.
Subscriber value barely moves
$1,000 buys 65 paying subscribers in Brazil and 15 in the US
Apple Ads converts 2× better than other paid channels
Apple Ads converts to paid better by 5% in the US and 4× in Indonesia
Matched product pages turn the same impressions into 23%+ installs
A paywall matched to the user's search lifts ROAS 82% by day 92
A tap in the US costs 14x more than a tap in Algeria
 US
US UK
UK China
China Australia
 Israel
 Canada
 Switzerland
 Germany
 Norway
 France
PDF Reader and Screen Recorder convert at 78%. One costs 12x more
See what Apple Ads
pays back
plus install-to-paid and LTV benchmarks.

Frequently asked
What's a good cost per install on Apple Ads?
The median cost per install across 90 markets is $0.51. The blended average, weighted by ad spend, is $1.34. In the US it’s $2.51. The right benchmark depends on your country, your sub-niche, and where in the funnel you measure. The full report breaks the data down by all three.
Which countries are cheapest for Apple Ads?
Algeria and Nepal both come in at $0.11 per tap, the lowest in the dataset. 85 of the 90 countries we analyzed cost under $1 per acquisition. The five most expensive auctions (US, UK, China, Australia, and Israel) take most of the global ad spend, but they’re not always the most efficient on a cost-to-conversion basis. The report ranks all 90.
Do Custom Product Pages actually improve conversion?
Yes, by more than most teams expect. Apps using Custom Product Pages get 12% more taps per impression and 9.6% more installs per tap. Compounded, that’s 23% more installs from the same ad spend. Same bids, same keywords, same budget.
What conversion rate should I expect from Apple Ads?
The global median is 62%, meaning 62 out of every 100 taps become installs. By sub-niche, conversion ranges from under 40% to 78%, with PDF Reader, Remote Control, and Screen Recorder leading. If your conversion rate is below 50%, the issue is usually the product page or the country mix, not the bid.
Are tailored paywalls worth setting up on Apple Ads?
Tailored paywalls lift install-to-trial conversion by 41% and trial-to-paid conversion by 24%. By day 92 of subscriber retention, the ROAS gap between tailored and default paywalls reaches 82%. The full curve from day 0 to day 92 is in the report.
How was this report built?
The report draws on Apple Ads performance data from 8,000+ apps running campaigns through Adapty in 2025, across 1M+ ad groups, 90 countries, and 59 sub-niches. Data was anonymized before aggregation so we don’t expose individual app, campaign, or account-level performance.