Apple Ads install-to-paid rate benchmarks 2026

TL;DR:
There's no single "good" rate. Install-to-paid depends on your market and category: top countries reach 9-17%, top US categories run 3-8%.
The three numbers in this article measure three different populations. Compare your rate against your own market-and-category cell, not a global average.
Intent-heavy categories like Health & Fitness and Education convert far better than time-fill ones like Music and Games.
You check your Apple Ads install-to-paid rate and you see it’s 2%.
Is that good or a disaster? You have no idea.
There's no benchmark in front of you to judge it against, so you’re looking at a number you can’t fully read.
The real answer is that 2% means nothing without context. It's excellent in one market and mediocre in another.
This article gives the install-to-paid benchmarks from 1M+ Apple Ads ad groups in our 2026 report. More usefully, shows how to find the one number that actually applies to your app.
What's the average Apple Ads install-to-paid rate?
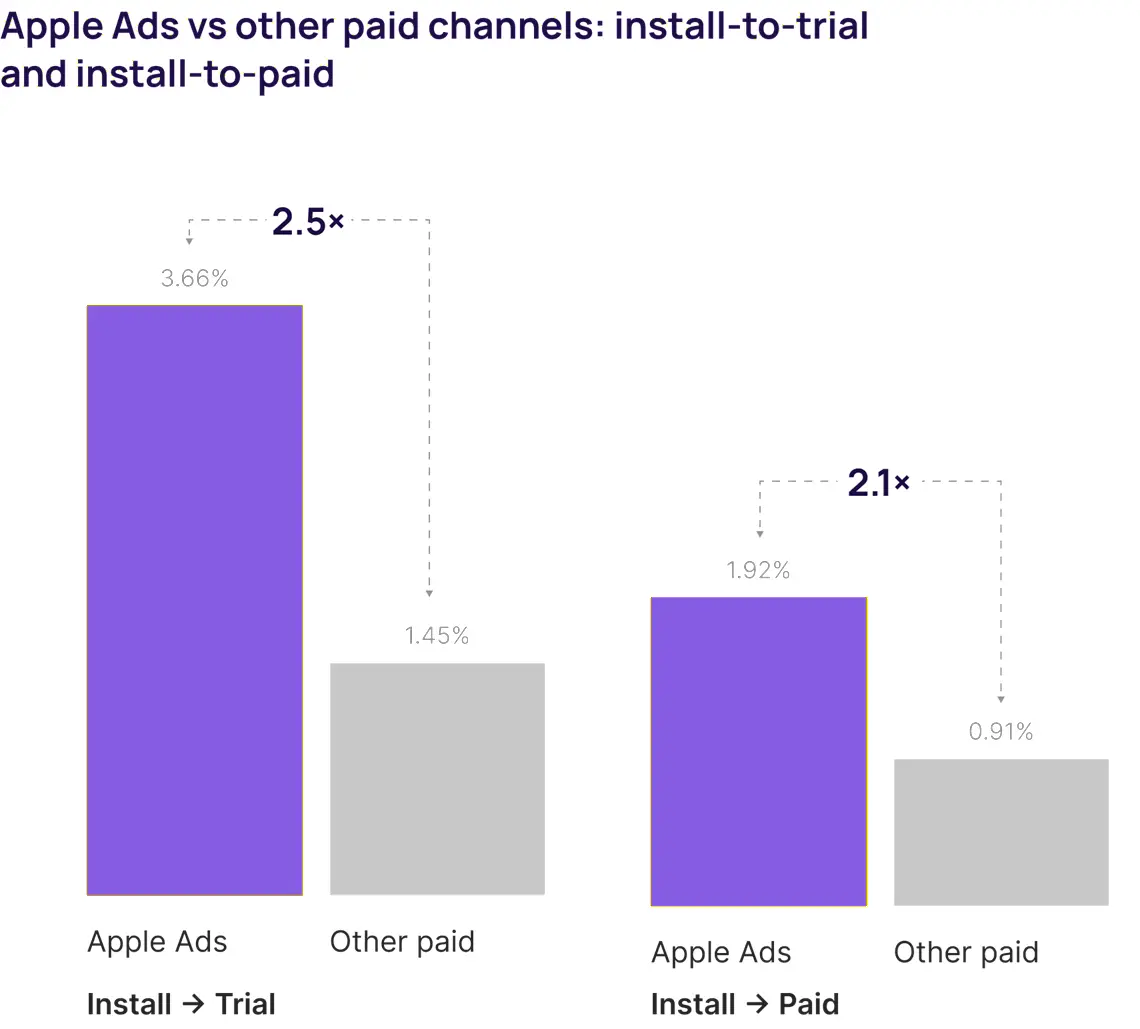
Across the dataset, Apple Ads converts installs to paid at 1.92%, compared to 0.91% for other paid channels. That's a 2.1× advantage.
It’s wider at the trial stage: 3.66% of Apple Ads installs start a trial versus 1.45% for other paid, a 2.5× difference.
The reason? Intent.
When you tap an Apple Ad result, you tap it because you searched for something specific. A user who typed “AI photo editor” is closer to paying than one who saw an ad mid-scroll on Meta.
That search intent shows up at trial start and carries through to the paid conversion.
It's the one number you can fairly call the channel average. Everything after this is a breakdown that moves it up or down.
ℹ️What to do with this: If you run both Apple Ads and Meta or TikTok, judge them on separate install-to-paid baselines, not a blended number. Apple Ads traffic should convert roughly 2× better. If it isn't, don’t blame the channel. It’s usually your paywall or post-install experience. Our comparison of Apple Ads vs other paid channels goes deeper on the difference.
How does the install-to-paid rate vary by country?
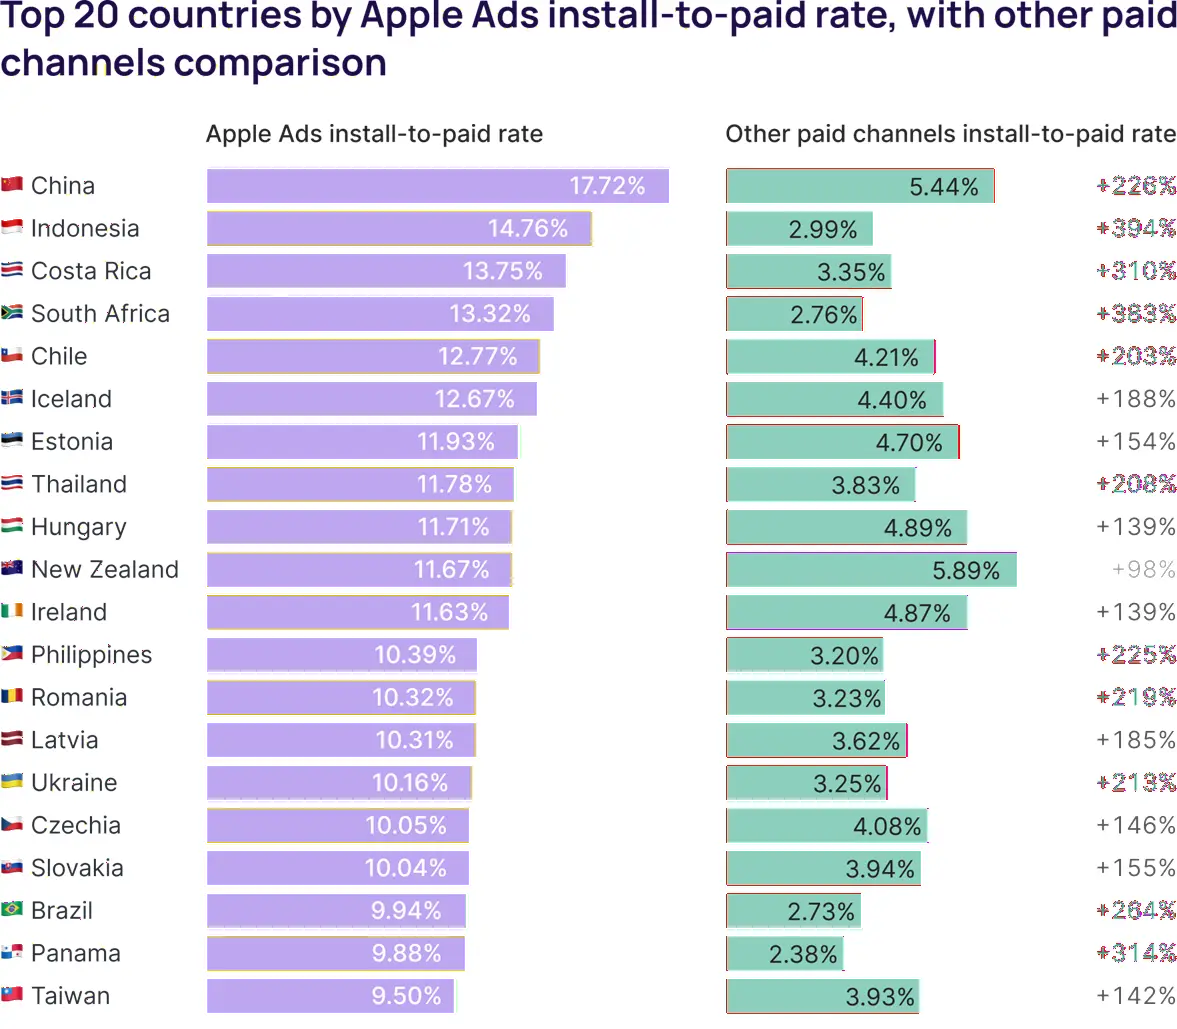
Enormously. The top 20 countries by Apple Ads install-to-paid rate run from 9.50% to 17.72%, many times the dataset average.
China leads at 17.72%, followed by Indonesia (14.76%), Costa Rica (13.75%), South Africa (13.32%), and Chile (12.77%), down to Taiwan at 9.50%.
Two things to read carefully here:
- This is the top 20 of 90 markets, so these are above the typical figure. A market that isn't on the list doesn’t have to be underperforming. It just isn’t top tier.
- The Apple Ads advantage over other paid is biggest in emerging markets and compresses to single digits in high-tier markets like the US and Norway. There, the auction has already been bid up enough to erase most of the edge.
How to use this data: Don't judge your install-to-paid rate against the US or a global figure if you're spending in emerging markets.
The Apple Ads advantage is largest exactly where most teams underspend, so a market posting a high install-to-paid rate is a signal to test more budget there, not less.
ℹ️🗺️ We break down which markets pay back in our look at the cheapest and most expensive countries for Apple Ads.
How does the install-to-paid rate vary by category?
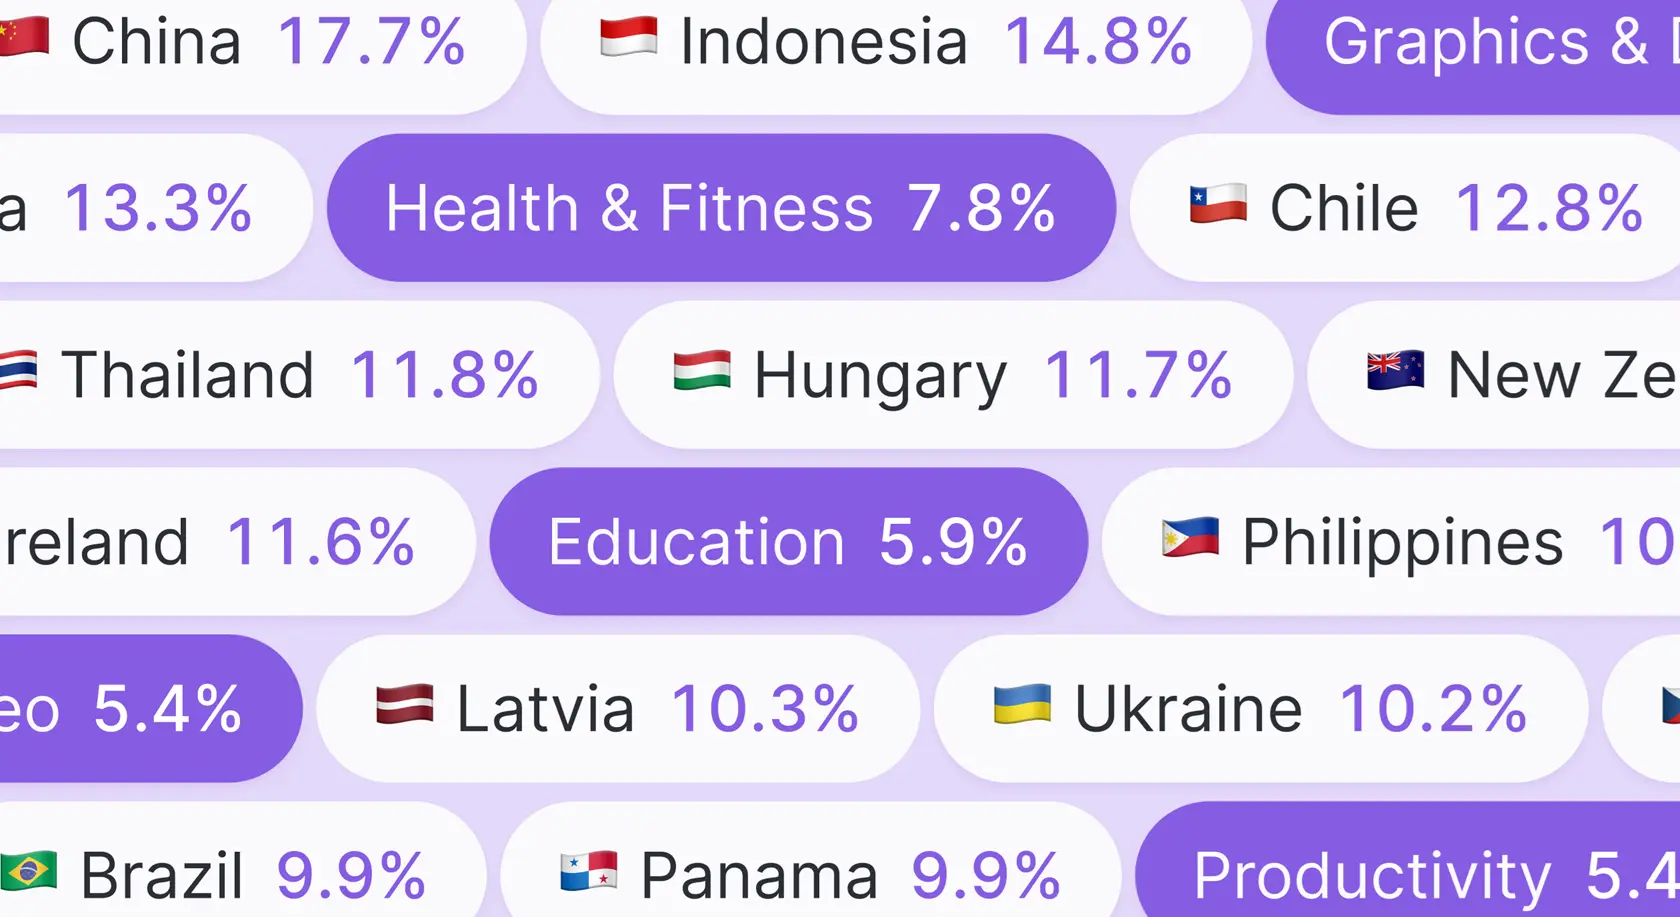
The top 10 US categories run from 3.19% to 7.80%.
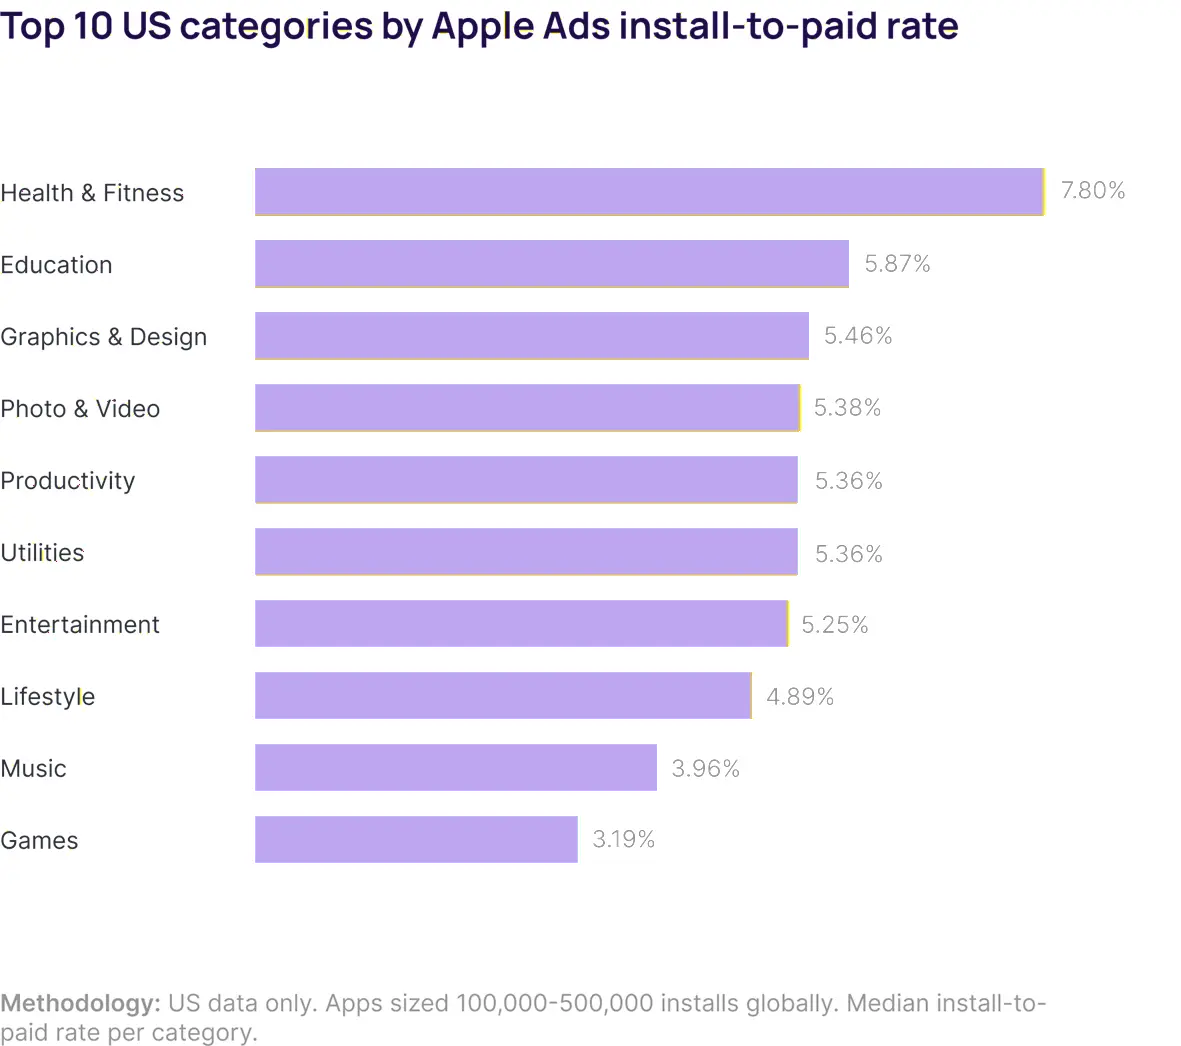
- Health & Fitness leads at 7.80%, followed by Education (5.87%), Graphics & Design (5.46%), Photo & Video (5.38%), Productivity and Utilities (both 5.36%).
- The bottom of the top 10 is Music at 3.96% and Games at 3.19%.
- The top seven all sit between 5% and 8%.
The same intent pattern holds. Users tap Health & Fitness, Education, and Productivity apps with a specific outcome in mind, so they convert.
They tap Music and Games to fill time, so they don't, at least not at the same rate.
A note on population here: this chart is US apps sized 100k-500k installs, which are mature funnels in a single market. That's why these category figures sit above the 1.92% dataset average. It's a more sophisticated slice, not proof that every category beats the channel mean.
Find your category's typical rate before you judge your own. A 4% install-to-paid rate is underperforming for a Health & Fitness app and strong for a gaming one. If you're in an intent-heavy category and converting below the 5-8% band, the headroom is usually in the paywall, not the ad account. Our niche-level benchmarks break this down further than category.
So what's actually a good install-to-paid rate for your app?
The three numbers above don't stack into a single ladder.
- 1.92% is the dataset-wide average across all apps and markets.
- The 9-17% country figures are the top 20 markets, the high end of 90.
- The 3-8% category figures are established US apps in one market.
They measure three different populations, so comparing your rate to whichever one looks most flattering, or most alarming, tells you nothing.
The benchmark that matters is your own market-and-category cell.
A US Health & Fitness app should expect to clear 5%, so 4% means work to do. A gaming app in a competitive Tier-1 market converting at 4% is doing well.
A rough way to self-assess: above 1.92% means you're beating the channel-wide median, which is a low bar. Where you land inside your specific category and market is the number that actually tells you whether to optimize or scale. Start there, not from a global average that describes no real app.
For the CPT, CPA, and conversion side of the same dataset, see the full Apple Ads benchmarks 2026 breakdown.
How Adapty helps you measure your real install-to-paid rate
Install-to-paid is a hard number to see in Apple's own dashboard, because the dashboard stops at the install.
It shows you taps and downloads. But the paid conversion happens inside your app days or weeks later, and Apple can't connect the two.
Adapty Apple Ads Manager extends attribution past the install to the trial and the subscription, so it can report install-to-paid by keyword, campaign, and country.
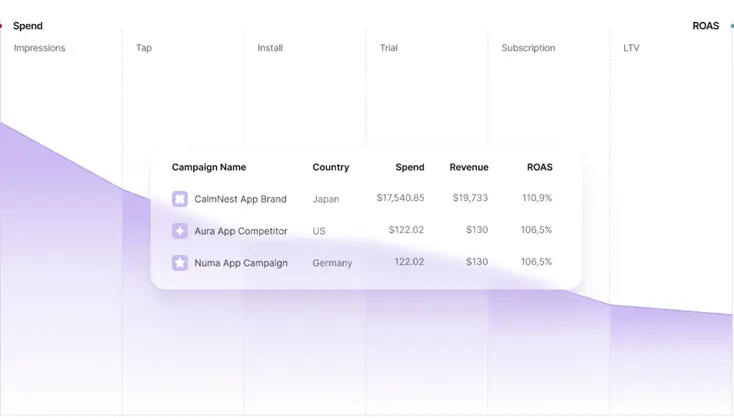
That's what lets you compare your rate against the cell that matters, your category in your markets, instead of a blended figure that hides where the funnel is actually converting.
Adapty's Apple Ads Manager ties each Apple Ads install to the trial and subscription it produced, so you can measure your real install-to-paid rate against the market and category that apply to you.
Make decisions against your own benchmarks
The most common mistake is judging your install-to-paid rate against the wrong benchmark.
There's no universal good number. There's the dataset average, the top-market figures, the category figures, and the only one that matters for you is your own market-and-category cell.
Find that cell first, then decide whether your rate means optimize or scale.
To measure your real install-to-paid rate by keyword, country, and category instead of guessing from a blended number, try Adapty for free.