Apple Ads benchmarks by niche: why category benchmarks aren't enough
TL;DR:
- App Store categories are too broad to benchmark against. Two apps in the same category can differ 12.7× in cost per acquisition.
- The 2026 Adapty report breaks Apple Ads benchmarks by niche. A PDF Reader and a Screen Recorder are both Utilities, convert almost identically (77.9% vs 76.3%), and cost $4.31 vs $0.34 per acquisition.
- Across all niches, CPA spans 30×, from Exam Preparation at $10.34 to Screen Recorder at $0.34. A category average describes no real app.
- Find your niche, benchmark against it, and stop optimizing toward a category number that doesn't fit your app.
A common scenario we encounter with Apple Ads users:
- You check your Apple Ads CPT against your category benchmark.
- You see that your cost is too high.
- You start cutting bids to fix it.
In theory, you were right. But that’s because you worked with partial data.
What can actually happen is that your app niche within that category is always going to cost more than the category average. The category benchmark led you astray.
Our internal analytics keep showing that category benchmarks are imprecise and misleading.
To prove it, we’ve compared 58 niches within Apple Ads categories. The results might help you spend your ad budget more efficiently.
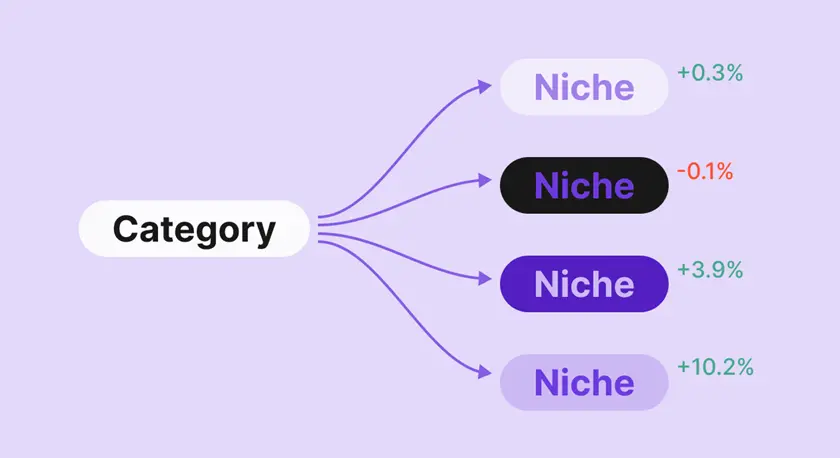
How can App Store category benchmarks mislead you?
The main purpose of App Store categories is to streamline browsing.
So when you benchmark ads in the “Utilities” category, you’ll compare metrics between PDF readers, screen recorders, VPNs, remote controls, and more.
What do they have in common at the auction? Not much. A category average blends all of them into a number that describes none of them.
Take two different Utilities apps:
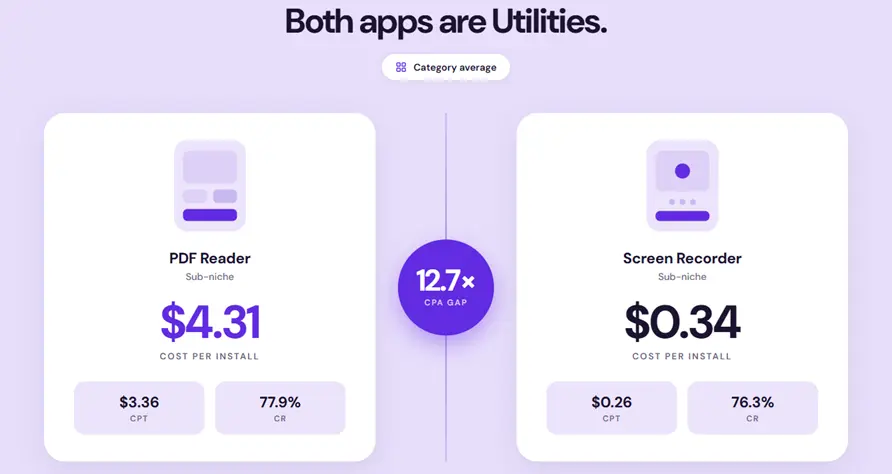
They convert almost identically: 77.9% versus 76.3%. But PDF Reader costs 12.7 more per acquisition and 12.9 more per tap.
The cost gap has nothing to do with funnel quality. Both funnels work.
The difference is auction competition: far more advertisers bid on PDF and document keywords than on screen recording, and that competition sets the price.
A category-level "Utilities" benchmark may sit somewhere between these two and describe neither. The entire metric can be a vanity metric unless you go more in depth.
How much Apple Ads category benchmarks vary?
The PDF Reader versus Screen Recorder gap above isn't an outlier. That's the normal state of the data once you look below the category level.
The cost spread between Apple Ads niches
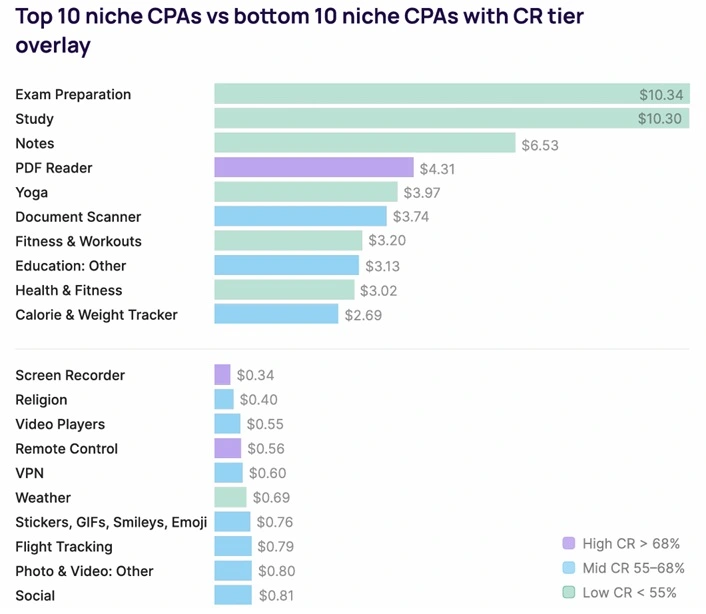
Across 58 niches, cost per install (CPA) spans 30×.
The median is $1.43, but Exam Preparation tops the list at $10.34. Screen Recorder sits at the bottom at $0.34.
Cost per tap (CPT) can differ 14×, from Exam Preparation at $3.45 to Religion at $0.24, with a median of $0.94.
Two things drive the spread:
- How many advertisers compete for the same keywords
- How much those advertisers can afford to pay
Exam Preparation and Study sit at the top ($10.34 and $10.30) because they share a small pool of high-intent keywords, the kind a crowd of well-funded test-prep companies all bid on.
The keywords are few, the bidders are many, and every one of them monetizes hard. That combination pushes the auction price up.
Screen Recorder sits at the bottom for the opposite reason.
The keywords are plentiful, fewer competitors monetize aggressively, and the apps convert on volume rather than premium pricing.
Low competition plus low monetization pressure equals a cheap auction.
💡What to do with this: Before you judge your CPA, find the two or three niches whose keywords overlap with yours and look at their cost band. If you're competing for keywords that test-prep money also wants, a high CPA is the market reality. If your keywords sit in a low-competition band and your CPA is still high, the problem is your funnel
The conversion rate difference between Apple Ads niches
Conversion rate varies almost as widely.
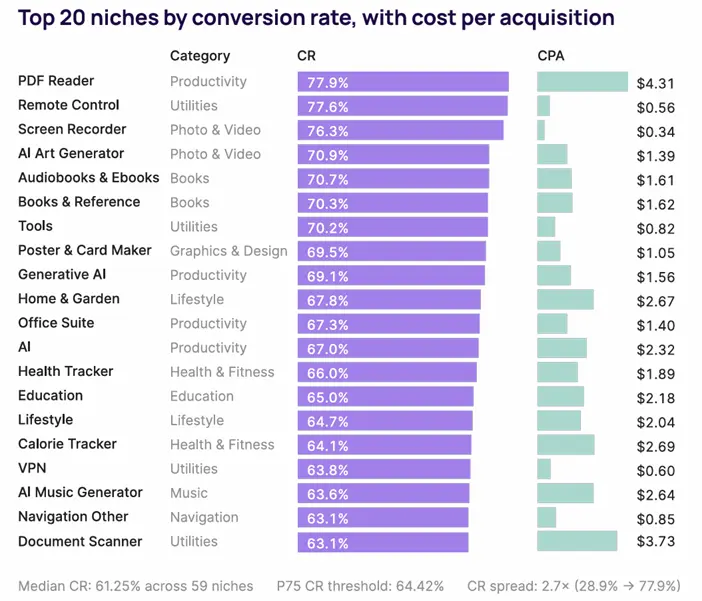
The median is 61.2%. However, PDF Reader converts taps to downloads at 77.9% while Time Planner converts at 28.9%.
Conversion rate on the App Store is mostly a function of how well the product page matches the intent behind the search, and some niches have a structural advantage there.
- PDF Reader, Remote Control, and Screen Recorder all convert above 76% because the user's need is concrete and the app obviously fills it.
- Time Planner (28.9%) and Exam Preparation (33.3%) ask the user to believe the app will change a behavior, like getting organized or passing a test. A hard promise to make on a product page.
Someone searching "screen recorder" wants one thing, sees a screenshot that shows exactly that, and installs. There's no persuasion gap to cross.
Niches at the bottom convert poorly for the opposite reason.
💡What to do with this: A low conversion rate isn't automatically a problem to fix. If your niche is one where the app has to sell a behavior change, a 40-50% conversion rate may be normal for your peers. Compare against your niche's typical range before you rebuild your product page. If you're in a concrete-need niche and converting below 70%, that's where a product-page fix has real headroom.
What can benchmarking against category cost you?
Using a category average instead of your niche benchmark leads to three specific mistakes.
Misreading a healthy funnel as broken
Your niche runs more expensive than the category average by design.
You see your CPT above the category line, assume something's wrong, and cut bids or rebuild a product page that was converting fine.
You've spent effort fixing a problem that didn't exist and lost auction volume in the process.
Misreading a broken funnel as healthy
Your niche should convert at 78%, but you're at 61%.
The category average is also around 61%, so you conclude you're performing normally. You're not.
You're underperforming your actual peers by 17 points, and the category benchmark hid it.
Setting bid caps against the wrong ceiling
You cap your bids at the category-average CPT, but your niche commands a premium because the keywords are more contested.
Your cap is below the market-clearing price, so you stop winning the auctions you should be winning, and volume dries up for no reason you can see in the category data.
How do you find and use your real niche benchmark?
Three steps to benchmark against a number that actually describes your app.
Step 1: Identify your niche instead of just category
A meditation app isn't Health & Fitness. It behaves more like Yoga ($3.97 CPA) than like Calorie & Weight Tracker ($2.69 CPA), even though all three share the category.
Start from what your app actually does and the keywords it actually competes on, not the category dropdown you picked at submission.
Step 2: Benchmark against the niche
Once you know your niche, find its row in the report and compare your CPT and CR against that, not against the category.
If your numbers are close to the niche benchmark, you're competing normally. If they're far off, you have a specific lever to investigate, and now you know which one.
Our Apple Ads best practices guide covers how to act on each lever.
Step 3: Re-run the CPA diagnostic at niche level
The mechanism behind the cost spread is tap-through rate.
TTR and CPT move inversely: Screen Recorder's 27.0% TTR earns it a $0.26 CPT, while Exam Preparation's 1.3% TTR drives its $3.45 CPT.
A low tap-through rate means you fight harder in the auction for every tap.
Apply the CPA diagnostic at the niche level: compare your CPT and CR against your niche's numbers, and the metric further from the benchmark is the one to fix.
That's the deeper reading of an unaffordable CPT: it often points to a lifetime value gap.
The cost per tap on a niche's core head terms is really a readout of what your competitors' LTV can tolerate. When several of them consistently outbid you over months, that's a signal your monetization is sitting behind theirs — a cost per tap you can't afford usually traces back to an LTV you haven't built yet.
When is the category benchmark still useful?
Category benchmarks aren't useless. They're the wrong tool for one specific job, not every job.
For market sizing, category-level trend tracking, and rough competitive framing across an entire vertical, the category number is fine.
It tells you how a broad slice of the market is moving.
The problem only appears when you use it for your own app's optimization decisions, where the niche is the unit that matters.
Bottom line: Use the category number to understand the market. Use the niche number to run your campaigns.
How Adapty helps you benchmark against your exact niche
Knowing your niche benchmark is step one.
The harder problem is knowing whether your own numbers beat it, in real time, by keyword, all the way through to revenue.
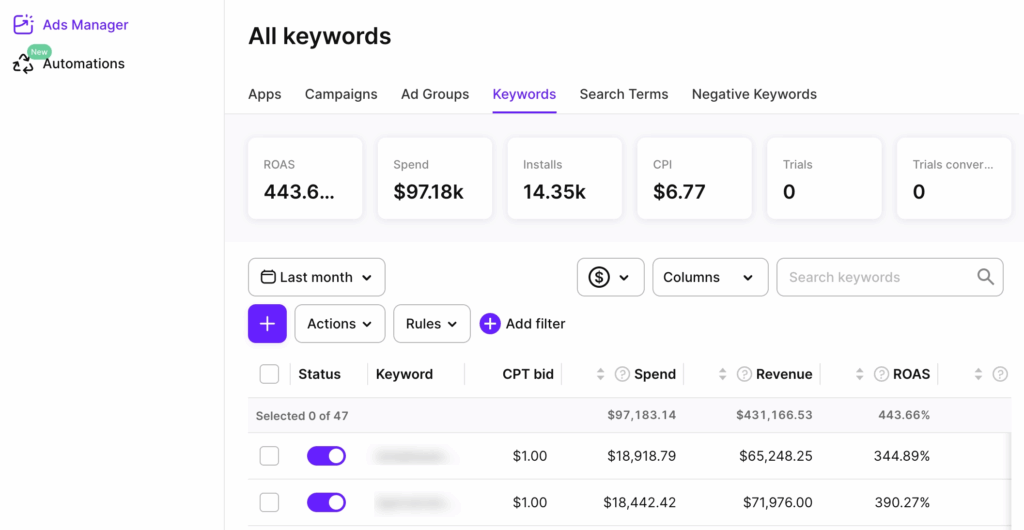
The problem: Apple's dashboard shows you CPT, CR, and CPA. It doesn't tell you how those compare to your niche, and it stops at the install.
This is where you can use Adapty Apple Ads Manager. Every Apple Ads keyword, campaign, and country connects through to the trial, the subscription, and the renewal, so you can see not just what you paid per tap, but what each niche's traffic is actually worth once it's inside your app.
That changes how you read a benchmark. A $4 CPA in a high-cost niche looks alarming against a category average and fine against your niche. But the number that settles it is what those installs become: if your niche's traffic converts to paying subscribers and retains, the $4 CPA is a bargain.
Apple Ads Manager supplies the revenue side, so you're weighing the right CPA against the right LTV instead of guessing.
The niche benchmark tells you whether your cost is normal. Whether that cost is worth paying depends on what the traffic does after the install, which is your own data, not a benchmark.
Compare your Apple Ads performance against the niche benchmark first, then see whether that traffic pays back after install.
ℹ️Adapty Apple Ads Manager ties Apple Ads keywords, campaigns, and countries to installs, trials, subscriptions, revenue, ROAS, and cohort LTV, so you can compare your acquisition costs with your niche benchmark and see whether that traffic actually pays back.
What this means for your benchmarking
The category average describes no real app.
It's a midpoint between niches that compete in different auctions, convert at different rates, and tolerate different costs.
Your niche describes your app. Benchmark against that, and your numbers start telling you something you can act on.
The full niche breakdown across CPA, CPT, conversion, and tap-through rate is in the 2026 Apple Ads Benchmarks report.
Try Adapty for free to measure your own funnel against it.