Apple Ads benchmarks 2026: CPT, TTR, CPA, and more across 90 countries
TL;DR:
- 85 of 90 countries cost under $1 to acquire a user on Apple Ads. The other 5 absorb most of the global spend.
- Cost per tap varies 14x worldwide. A tap in the US costs $1.58. A tap in Algeria costs $0.11.
- Cost per download spreads 30x across niches. Screen Recorder users come in at $0.34. Exam Prep users cost $10.34.
- Cheap doesn't mean better. Expensive doesn't mean broken. CPA is just a benchmark.
- Every category has a viable economic shape if you know which one you're playing.
In discussions with subscription app owners, two questions often come up:
- Which markets outside the top-tier are worth testing?
- How category economics looks on this channel?
We went looking for benchmarks that answered either. Nothing did.
Why you might be reading Apple Ads benchmarks wrong?
Most reports either average the whole world into one number that hides a huge cost spread between markets, or they cover the same top countries every advertiser already runs ads in.
None of them break out niches at a useful level. Apple's "Productivity" category alone covers AI Chatbots at $2.32 CPA and PDF Reader at $4.31.
The category average tells you nothing about either.
So we ran the analysis ourselves. Our Apple Ads For Subscription Apps 2026 report draws on 1M+ ad groups across 90 countries and 59 niches over the last year.
We see what happens after the install, too, all the way through trial and paid conversion, the data that doesn't show up in Apple's native dashboard.
Small note on how to read this: The country and niche benchmarks below are test signals. A low CPA market may be worth a small test budget, but it’s not automatically a better market than the US. A high CPA niche may still be a strong business if the LTV supports it.
Two traps to avoid
- Treating country benchmarks as a rebudget signal instead of a test recommendation.
- Treating niche CPA as a profitability verdict instead of an economic signal.
This article will avoid both.
ℹ️A note on terminology: CPA in this report means cost per download, not cost per install. This matters because the two diverge: • Download is what Apple Ads reports: the user tapped “Get” and the app downloaded to their device. • Install is what your MMP reports: the user downloaded and opened the app at least once. Roughly 10% of downloads never become installs. If you're comparing your internal CPI against this report's CPA, expect your CPI to run ~10% higher than the equivalent CPA benchmark here.
How much does an Apple Ads install cost in 2026?
Two numbers tell the story:
- The median country CPA is $0.51.
- The blended CPA, weighted by ad spend, is $1.34.
Most countries are cheap. Most spend goes to expensive ones.
Both can be true because the acquisition budget concentrates where high-LTV users live, not where the auction is least competitive.
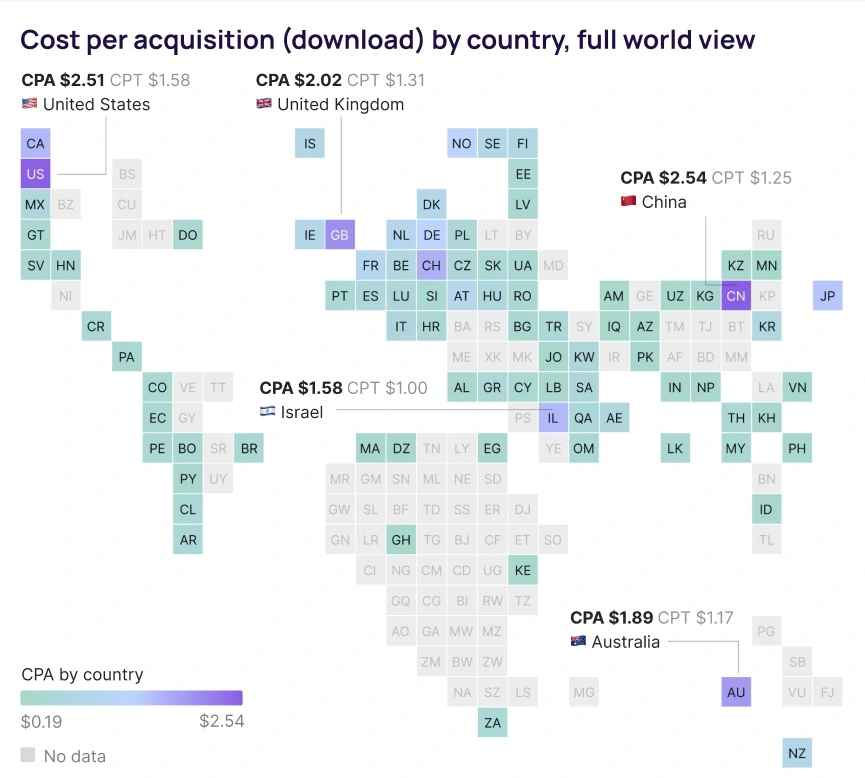
The five most competitive markets sit four to five times above the median:
- The US ($1.58 CPT, $2.51 CPA),
- Great Britain ($1.31 CPT, $2.02 CPA),
- China ($1.25 CPT, $2.54 CPA),
- Australia ($1.17 CPT, $1.89 CPA),
- Israel ($1.00 CPT, $1.58 CPA).
They're expensive because revenue per user is also higher there. The auction reflects what advertisers are willing to pay and, in return, what they expect to earn back.
To get an even better scope of Apple Ads markets, here's the full table:
| # | Country | CPA | TTR |
| 1 | China | $2.54 | 4.8% |
| 2 | United States | $2.51 | 9.0% |
| 3 | United Kingdom | $2.02 | 9.0% |
| 4 | Australia | $1.89 | 8.7% |
| 5 | Switzerland | $1.66 | 7.8% |
| 6 | Israel | $1.58 | 7.4% |
| 7 | Canada | $1.58 | 8.6% |
| 8 | Japan | $1.49 | 9.2% |
| 9 | Germany | $1.34 | 11.5% |
| 10 | Norway | $1.34 | 7.3% |
| 11 | France | $1.11 | 11.6% |
| 12 | Netherlands | $1.07 | 7.7% |
| 13 | Austria | $1.06 | 7.5% |
| 14 | Hong Kong | $1.05 | 6.0% |
| 15 | Denmark | $1.04 | 9.0% |
| 16 | Ireland | $1.02 | 3.9% |
| 17 | Singapore | $1.00 | 5.1% |
| 18 | New Zealand | $1.00 | 7.5% |
| 19 | Sweden | $0.99 | 6.9% |
| 20 | Iceland | $0.97 | 6.1% |
The implication for benchmarking: if you're comparing your own CPA against this report, the relevant number is the one that matches your market mix.
A US-heavy app should be measuring against the $2.51 US figure, not the global $0.51 median.
Practical tip: Pull your trailing 90-day CPA by country. Compare each market to its row in this report, not to a global average. The variance is where your next test budget might go.
Why do Apple ads in cheaper markets convert better than in high-tier ones?
The top 20 countries by tap-through rate all sit above the 11.5% TTR mark.
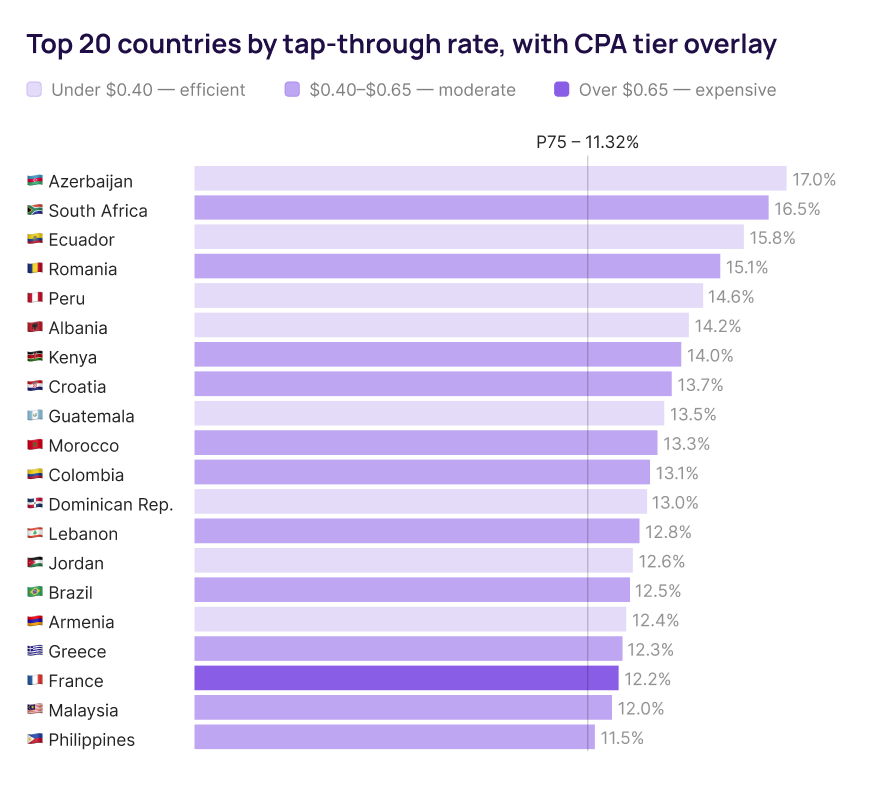
Azerbaijan leads at 17%, followed by South Africa, Ecuador, Romania, and Peru. Most of them also sit in the cheap cost-per-download tier, under $0.40 per download.
Why this pattern? Two things:
- Auctions are thinner because fewer advertisers compete there.
- Users in those markets see fewer ads overall, which makes the ones they do see more effective.
A "free PDF reader" ad in Azerbaijan doesn't have to break through ten competing offers.
Conversion rates follow a similar shape: Jordan and France both convert at 67% of taps to installs. Jordan costs $0.24 per download. France costs $1.11.
The funnel performs the same. The auction does not.
Does it mean you should shift the budget from the US to Azerbaijan? Not really.
Its LTV is lower than the US, the user base is smaller, and the categories that perform there may not match the app's positioning.
Think like this instead. Azerbaijan is a candidate for a test campaign, sized small, with success measured against its specific LTV. Not against US benchmarks.
The concern is that non-US geos may not deliver comparable LTV. But lower LTV is consistently offset by even lower acquisition costs. At the end of the day, the only thing you need is ROAS above 100% – and ad campaigns targeting non-US markets are perfectly suited for that
Takeaway: Of the top 20 TTR markets, only France has a CPA above $0.65. Every other market in that list delivers installs in the moderate or efficient cost tier.
If you've never tested outside tier-1, the top 20 is your shortlist.
What you can do: Pick 2-3 markets from the top 20 TTR list where your category has product-market fit. Run small validation campaigns for a month and decide on retention, not CPA.
What is Apple Ads CPT, country by country?
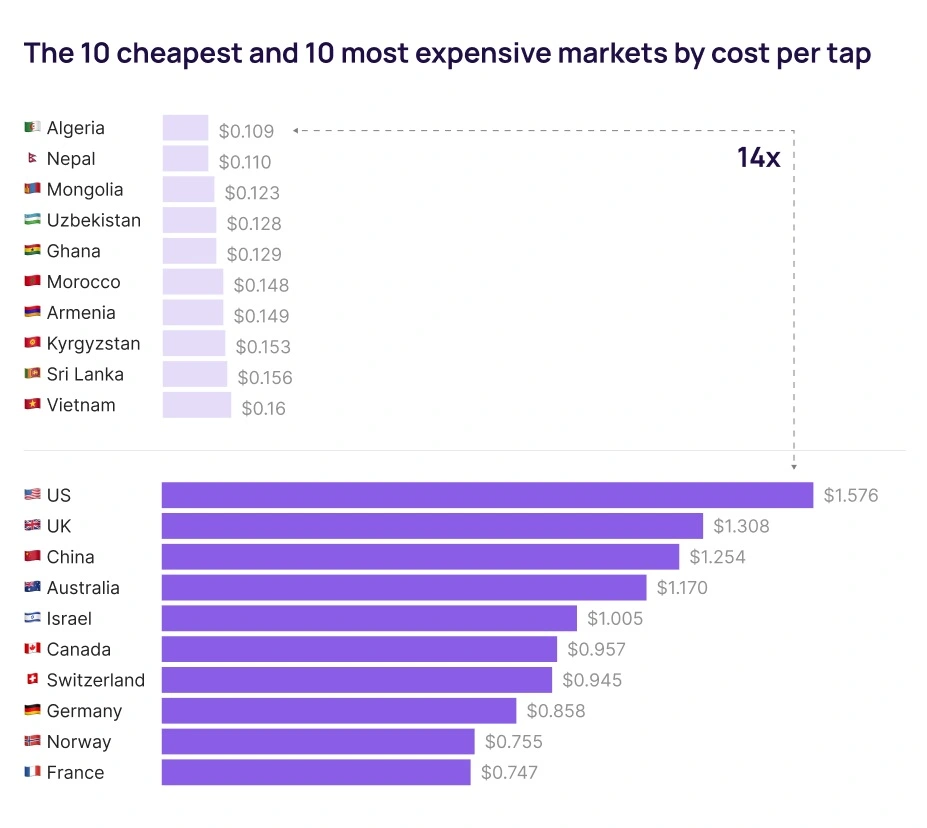
CPT spreads 14x across 90 markets.
- The cheapest taps are in Algeria and Nepal at $0.11.
- The most expensive are in the US at $1.58.
In Apple Ads, what you pay per tap determines what you pay per download.
Apple's surface is already high-intent. Conversion rate matters less than bid in most markets, because the App Store product page does most of the conversion work for you.
And this has a practical consequence: If you're trying to lower CPA in a high-intent, expensive market, your best move is bid reduction and not creative or product page work.
For most of the top 20 most expensive markets, the auction explains 90%+ of the cost.
The exceptions are the markets where conversion is broken, which we’ll cover in the following section.
The flip side: in cheap markets, the bid is solved for you. There's no room to bid down on a $0.11 CPT.
Here, you should focus on volume and targeting precision, finding more of the keywords that already work.
What to do with this: If your CPA is high in a tier-1 market, audit your bids and keyword match types before rebuilding your product page. Our CPA diagnostic guide walks through exactly this call.
The math says the bid is probably the issue.
Here's a table of the top 20 most expensive countries by CPT according to our data:
| Rank | Country | CPT | CPA | CR |
| 1 | US | $1.58 | $2.51 | 62.71% |
| 2 | UK | $1.31 | $2.02 | 64.69% |
| 3 | China | $1.25 | $2.54 | 49.28% |
| 4 | Australia | $1.17 | $1.89 | 61.82% |
| 5 | Israel | $1.00 | $1.58 | 63.53% |
| 6 | Canada | $0.96 | $1.58 | 60.54% |
| 7 | Switzerland | $0.95 | $1.66 | 56.99% |
| 8 | Germany | $0.86 | $1.34 | 63.93% |
| 9 | Norway | $0.75 | $1.34 | 56.17% |
| 10 | France | $0.75 | $1.11 | 67.29% |
| 11 | Japan | $0.73 | $1.49 | 49.28% |
| 12 | Denmark | $0.66 | $1.04 | 63.06% |
| 13 | Netherlands | $0.65 | $1.07 | 60.49% |
| 14 | Austria | $0.62 | $1.06 | 58.52% |
| 15 | New Zealand | $0.61 | $1.00 | 61.10% |
| 16 | Ireland | $0.60 | $1.02 | 58.27% |
| 17 | Sweden | $0.57 | $0.99 | 57.80% |
| 18 | Belgium | $0.53 | $0.84 | 63.00% |
| 19 | Finland | $0.51 | $0.89 | 57.84% |
| 20 | Singapore | $0.50 | $1.00 | 49.49% |
Why do high-tier markets cost what they cost?
The 20 highest CPA markets on Apple Ads behave like a single category from a distance.
Up close, they are all “tier-1.” But if you zoom out, it’s an uneven story.
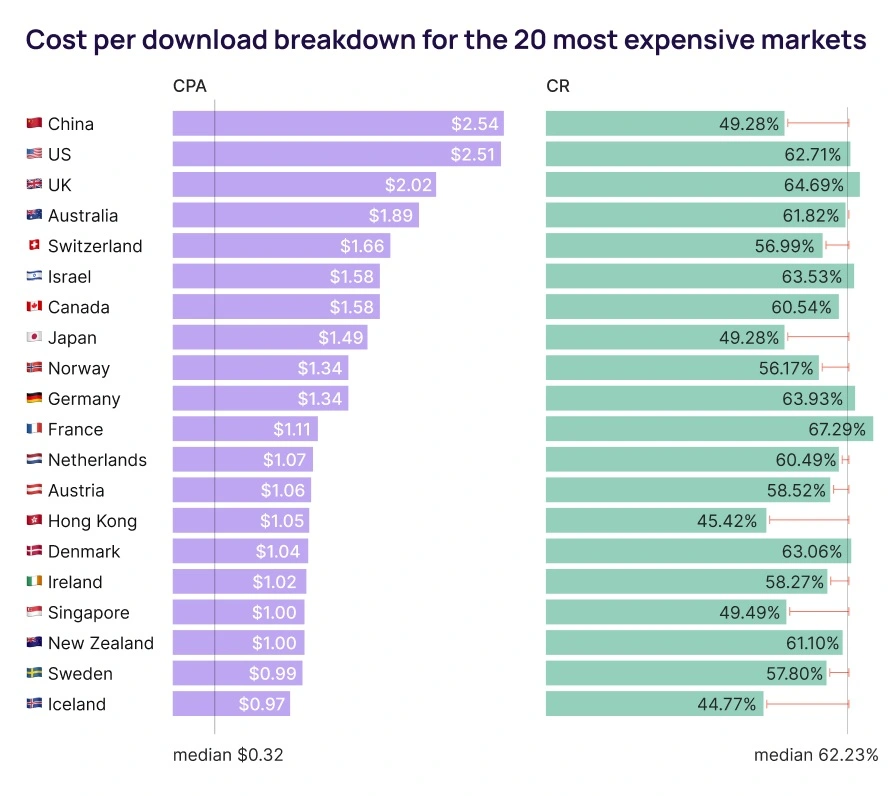
- China and the US pay almost exactly the same per download:$2.54 in China, $2.51 in the US.
- The tap prices are also nearly identical: $1.25 vs $1.58, close enough that the auction is in the same range.
What separates them is conversion. The US converts 62.7% of taps into installs. China converts 49.3%. The auction tier is the same, but the funnel differs at not-so-small 13%.
France is the reverse case. $1.11 CPA, less than half of what the US and China cost, and a conversion rate of 67.3%, higher than either of them. The auction in France is genuinely cheaper, but the funnel does additional work on top of that.
Iceland sits at the other extreme: a $0.97 tap that converts at 44.8%, the worst of the top 20.
The pattern in the data: only 6 of the 20 most expensive markets convert above the global median of 62%. The US, UK, Germany, France, Israel, and Denmark. These are the markets where the auction price is justified by funnel performance.
The other 14 markets cost premium prices without premium conversion rates. China, Japan, Iceland, Hong Kong, Singapore, Ireland, and Sweden all sit below 60% conversion despite top-20 tap prices.
This matters for budget planning. The auction price tells you what the entry costs. The conversion rate tells you what you're actually getting for it.
In markets where the two align, expensive is fair. In markets where they don't, expensive is just expensive. The App Store page is leaking downloads that the auction has already paid for.
What to do with this: Cross-reference your top-spend markets against the conversion column. If your CR is below 62% in a market where you're paying $1+ per tap, focus on the funnel first.
Which niche you're in matters more than which country you target
It’s not only countries that can determine your strategy.
Your niche (or subcategory) can influence how you’ll bid and how your Apple Ads will perform. Across 59 niches, CPA spreads 30x.
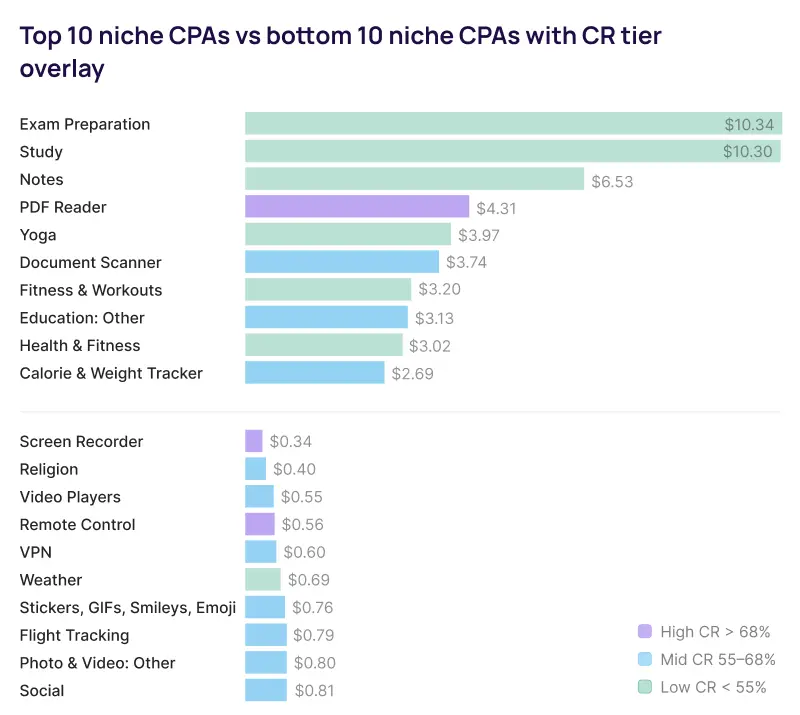
Screen Recorder delivers a user for $0.34. Exam Preparation costs $10.34 for the same outcome.
Your first instinct might be to read this as a leaderboard. But it isn’t. CPA without LTV is an incomplete equation.
Here’s our logic:
- Exam Prep users may subscribe for $40–$80 for a multi-month plan because they have an actual deadline. A 60% trial-to-paid conversion at that price point produces $24–$48 per converted user. A $10 CPA on that math is a strong return.
- Screen Recorder users churn faster because the problem they bought the app to solve is one-time. A $0.34 CPA looks great until you measure 90-day revenue per user.
Every category can work on Apple Ads. They have different economies. The benchmark tells you what kind of math you're solving for and not whether your business is viable.
What we can't show you in this report is per-niche LTV. That data sits inside each app's analytics, not in the cross-app benchmark.
But what we can show is install-to-trial and trial-to-paid context for high-CPA categories, and there's a pattern there too.
- PDF Reader sits in the expensive cluster at $4.31 CPA, but its 78% install conversion plus typical 12-15% install-to-trial rates make the unit economics work.
- Yoga, a Health & Fitness app, sits nearby at $3.97 CPA, but with a 54% install conversion and weaker trial conversion, the same price becomes a problem.
Two categories with the same auction price, but different businesses.
What you can do: Before judging your niche CPA, calculate your break-even:
CPA ÷ (install-to-trial rate × trial-to-paid rate × ARPU × expected months retained).
The benchmark is just the input, and your math is the answer.
We break down why category-level benchmarks mislead—and what to compare against instead—in the niche deep dive.
Here's the full breakdown of the most expensive Apple Ads niches:
| Rank | Niche | Apple category | CPT | CR | CPA |
| 1 | Study | Education | $3.45 | 33.45% | $10.30 |
| 2 | Exam Preparation | Education | $3.45 | 33.35% | $10.34 |
| 3 | PDF Reader | Productivity | $3.36 | 77.91% | $4.31 |
| 4 | Notes | Productivity | $3.08 | 47.25% | $6.53 |
| 5 | Document Scanner | Utilities | $2.36 | 63.14% | $3.74 |
| 6 | Yoga | Health & Fitness | $2.16 | 54.46% | $3.97 |
| 7 | Education: Other | Education | $1.85 | 58.97% | $3.13 |
| 8 | Home & Garden | Lifestyle | $1.81 | 67.75% | $2.67 |
| 9 | Calorie & Weight Tracker | Health & Fitness | $1.72 | 64.11% | $2.69 |
| 10 | AI Music Generator | Music | $1.68 | 63.56% | $2.64 |
| 11 | Health & Fitness | Health & Fitness | $1.64 | 54.21% | $3.02 |
| 12 | Fitness & Workouts | Health & Fitness | $1.60 | 49.95% | $3.20 |
| 13 | AI | Productivity | $1.55 | 67.00% | $2.32 |
| 14 | Education | Education | $1.42 | 65.02% | $2.18 |
| 15 | Lifestyle | Lifestyle | $1.32 | 64.73% | $2.04 |
| 16 | Video Editor | Photo & Video | $1.32 | 60.74% | $2.17 |
| 17 | Driver License | Education | $1.29 | 56.44% | $2.28 |
| 18 | AI Chatbot | Productivity | $1.28 | 56.18% | $2.28 |
| 19 | Health Tracker | Health & Fitness | $1.25 | 66.04% | $1.89 |
| 20 | Auto & Vehicles | Lifestyle | $1.20 | 53.98% | $2.21 |
Which niches actually convert taps into installs?
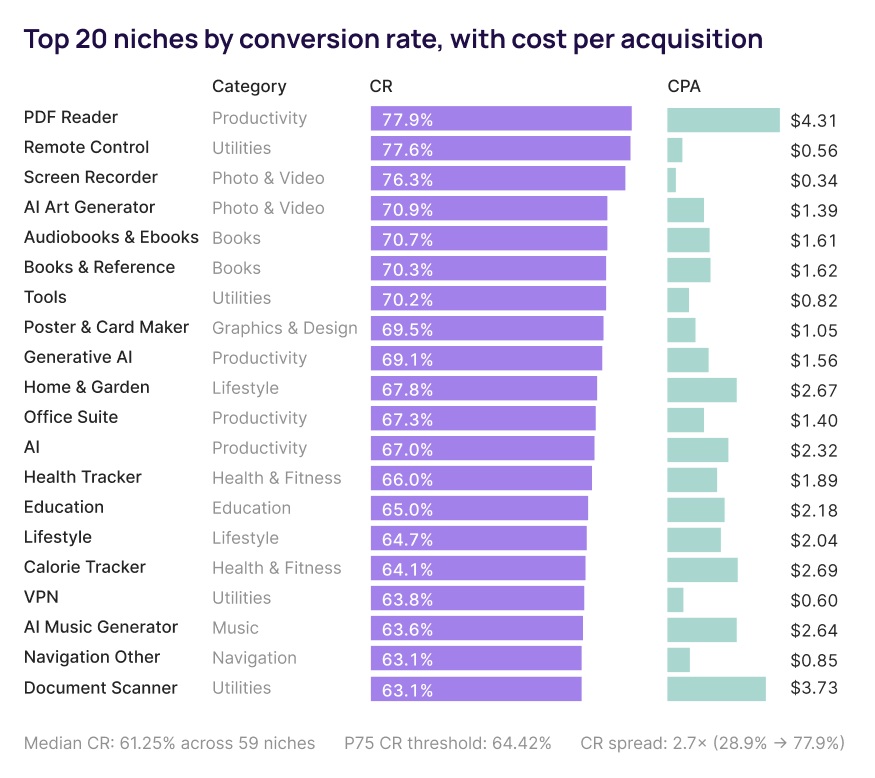
Remote Control and PDF Reader are two niches from the same Apple Ads category (Utilities).
Both convert taps into downloads at the same rate: 77.6%. However, Remote Control costs $0.56 per download, while the PDF reader costs $4.31. The same funnel, but 8 times the cost.
Here’s the full breakdown:
These numbers show us what conversion rate actually means: intent.
A user who taps a Remote Control ad and a user who taps a PDF Reader ad download the app at the same rate because both already know they want it.
What differs is what the advertisers in each niche can afford to pay.
PDF Reader apps mostly run subscription models, with most paid tiers landing somewhere between $2 and $15 per month. Remote Control apps mostly run one-time purchases or low-tier subscriptions at a fraction of that price.
The auction reflects what each category's business model can sustain, not what each user is worth in the abstract.
The middle of the top 20 is interesting:
- Audiobooks & Ebooks (70.7% conversion, $1.61 CPA)
- Books & Reference (70.3%, $1.62)
- Generative AI (69.1%, $1.56)
They convert almost as well as the cheap utilities but cost a fraction of what the expensive ones do.
What to do with this: If your category sits in the high-CR mid-cost middle (AI niches, Books, Office Suite), the cost ceiling is low enough to scale aggressively without LTV-grade economics. Confirm your install-to-trial rate matches the conversion rate before sizing budget.
Here's the full table of the top 20 niches by conversion rate:
| Rank | Niche | CR |
| 1 | PDF Reader | 77.91% |
| 2 | Remote Control | 77.62% |
| 3 | Screen Recorder | 76.28% |
| 4 | AI Art Generator | 70.87% |
| 5 | Audiobooks & Ebooks | 70.67% |
| 6 | Books & Reference | 70.26% |
| 7 | Tools | 70.15% |
| 8 | Poster & Card Maker | 69.49% |
| 9 | Generative AI | 69.06% |
| 10 | Home & Garden | 67.75% |
| 11 | Office Suite | 67.33% |
| 12 | AI | 67.00% |
| 13 | Health Tracker | 66.04% |
| 14 | Education | 65.02% |
| 15 | Lifestyle | 64.73% |
| 16 | Calorie & Weight Tracker | 64.11% |
| 17 | Apps | 63.91% |
| 18 | VPN | 63.81% |
| 19 | AI Music Generator | 63.56% |
| 20 | Tools (Photo & Video) | 63.14% |
Why do utilities dominate both ends of the cost spectrum?
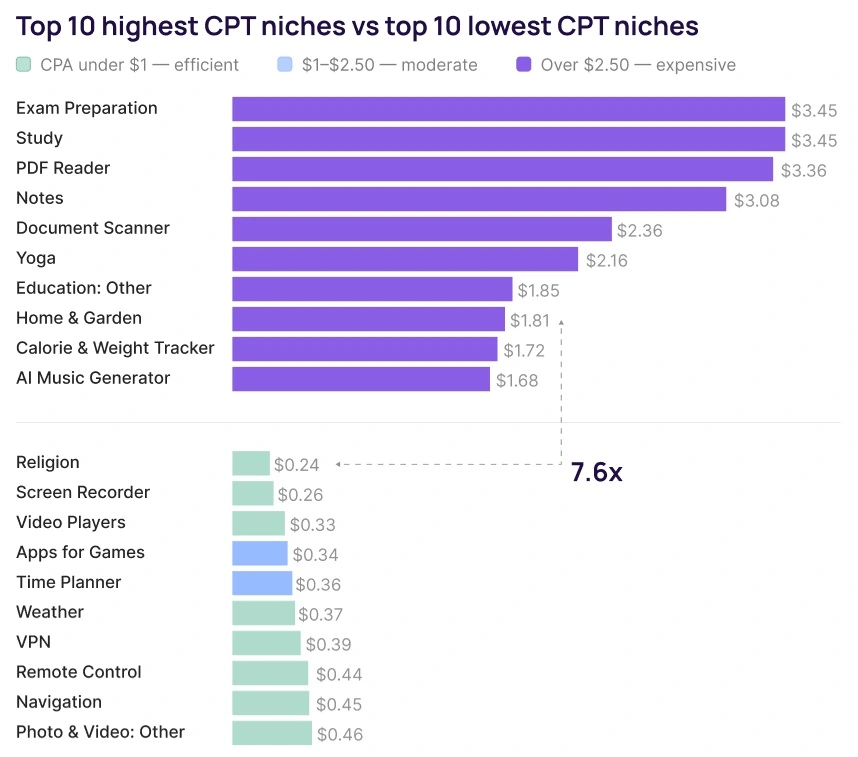
The cheapest niche on Apple Ads? Religion at $0.24 per tap.
The most expensive? Exam Preparation at $3.45.
A 14x spread between two categories that both sell subscriptions to motivated users with specific intent. The auction isn't pricing the user, but a business model behind the bid.
Our take: A user searching "screen recorder" wants to record their screen in the next 30 seconds. A user searching "PDF reader" might be making a tool choice they'll use for years.
The auction dismisses the value of the app and prices the urgency of the search.
Niches answering immediate needs (Screen Recorder, Weather, Remote Control, VPN) cluster cheaply. Niches answering longer commitments (Exam Prep, Yoga, Fitness, Notes) are expensive.
This explains the Religion niche too, which is the cheapest CPT in the entire dataset at $0.24. The intent is specific, the search volume is consistent, and the competitive set is small.
None of the giant subscription app companies bid against religion apps. The auction stays cheap.
What this shows:
- If you're in an urgency-pricing niche, your model is volume. Cheap installs, fast monetization, churn-aware retention.
- If you're in a commitment-pricing niche, your model is LTV. Expensive installs, higher prices, longer retention windows.
Trying to run a Yoga app like a VPN app, or vice versa, is where most cross-category benchmark mistakes happen.
What to do with this: Identify whether your niche prices urgency or commitment. Build your bidding strategy and retention model to match.
The auction will tell you which one you're in.
Check where your niche ranks:
| Rank | Niche | CPT |
| 1 | Study | $3.45 |
| 2 | Exam Preparation | $3.45 |
| 3 | PDF Reader | $3.36 |
| 4 | Notes | $3.08 |
| 5 | Document Scanner | $2.36 |
| 6 | Yoga | $2.16 |
| 7 | Education: Other | $1.85 |
| 8 | Home & Garden | $1.81 |
| 9 | Calorie & Weight Tracker | $1.72 |
| 10 | AI Music Generator | $1.68 |
| 11 | Health & Fitness | $1.64 |
| 12 | Fitness & Workouts | $1.60 |
| 13 | AI | $1.55 |
| 14 | Education | $1.42 |
| 15 | Lifestyle | $1.32 |
| 16 | Video Editor | $1.32 |
| 17 | Driver License | $1.29 |
| 18 | AI Chatbot | $1.28 |
| 19 | Health Tracker | $1.25 |
| 20 | Auto & Vehicles | $1.20 |
How much does an Apple Ads paying subscriber actually cost?
CPA tells you what an install costs. Cost per paying subscriber tells you what a customer costs.
The latter determines whether a channel is actually profitable, and on Apple Ads, it varies by 25× across markets.
The formula: country CPA divided by install-to-paid rate.
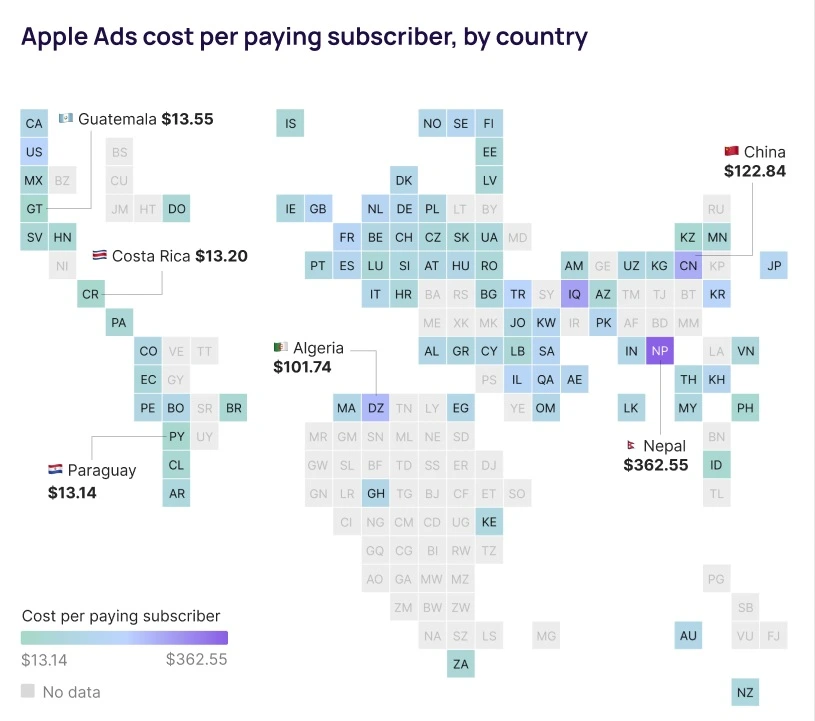
Here’s one example:
- Brazil sits at $15.36 per paying subscriber: cheap CPA, decent conversion.
- Nepal sits at $362.55 — cheap CPA on paper, terrible funnel performance in practice.
The cheapest-CPA country isn't always the cheapest-paying-subscriber country, which is why post-install measurement matters more than install-side measurement.
What to do with this: It depends on your LTV. If your blended LTV is above $40, every country in the green band and most of the light-green band can be a profitable test ground. If your LTV is closer to $80, even the most expensive markets may work.
Most Apple Ad campaigns spend almost nothing in the cheapest band (Latin America and Eastern Europe), even though that's where the most efficient acquisition economics live.
💡For the full market-selection framework (including the cost/conversion quadrants), see our cheapest and most expensive countries for Apple Ads.'
What's a good Apple Ads install-to-paid rate by category?
Install-to-paid rate varies more by category than by paywall design or pricing.
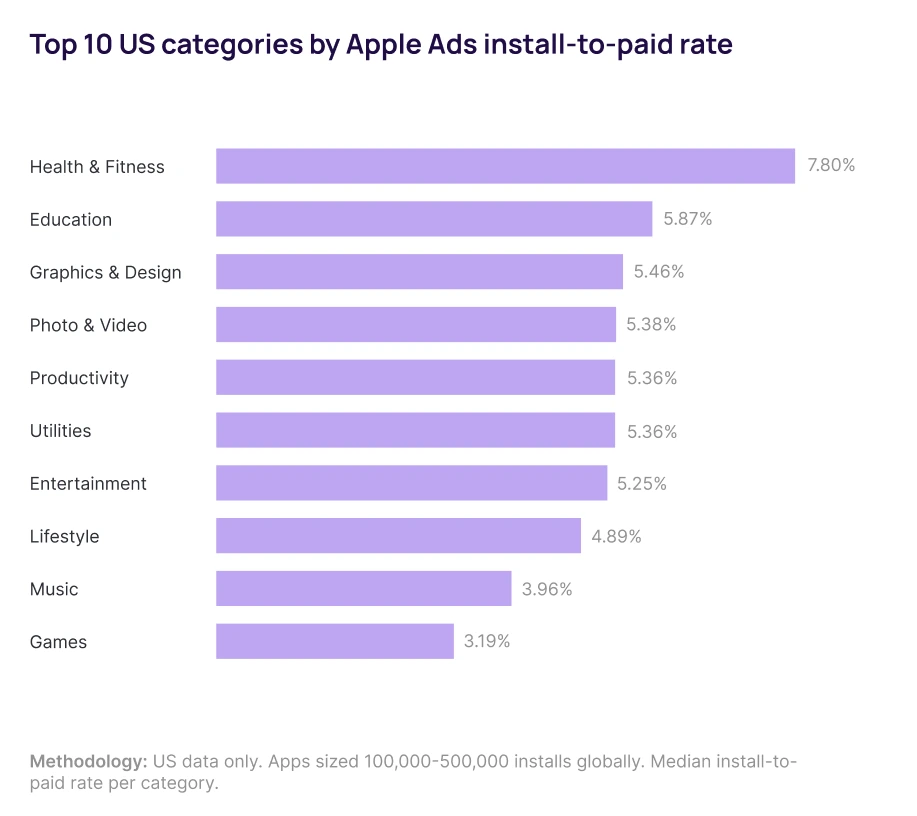
- At the top end, Health & Fitness apps convert installs to paid at 7.80%.
- Education follows at 5.87%, Graphics & Design at 5.46%.
- The top seven categories all sit between 5% and 8%.
- At the bottom of the top 10, Games apps convert at 3.19%.
What this tells us: Users tap Health & Fitness, Education, and Productivity with a specific outcome in mind. They tap Music and Games to fill time. The funnel rewards intent.
What to do with this: Compare your install-to-paid rate against apps in your category, not against a single channel-wide number.
A 4% rate is below the median for a Health & Fitness app and well above the median for a gaming app. The same number can have a different verdict depending on the category.
ℹ️About this data: The median Apple Ads install to trial rate is 1.92% according to our data. The chart shows median install-to-paid rates across US apps sized 100,000-500,000 installs globally, which is the volume bracket where most subscription apps in Adapty's dataset sit. Smaller apps and apps outside the US can show different conversion rates depending on funnel maturity, market dynamics, and pricing strategy. Add: 'For more in-depth data, check the breakdown by country and category in our install-to-paid rate benchmarks.'
How much can product page matching move these numbers?
Plot twist: every CPA in this report might be wrong by roughly 19%, but the data isn’t off.
The data just assumes a generic App Store product page.
However, if you match the product page to the keyword that triggered the ad, and the $2.51 US install becomes $2.03. The $10.34 Exam Prep install becomes $8.37.
The auction doesn't change. The math that follows it does.
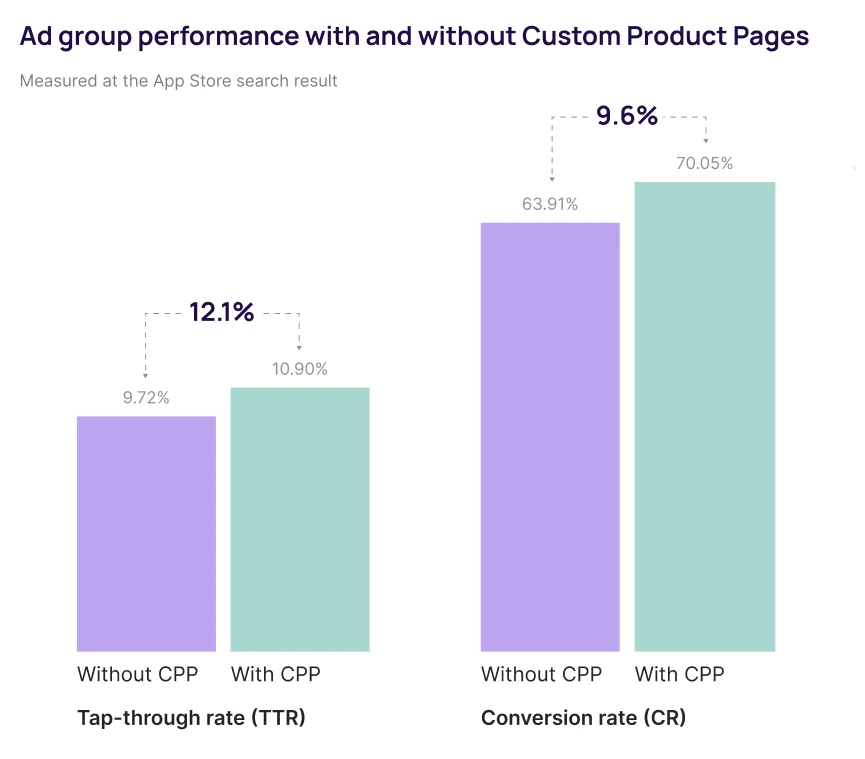
Across the same dataset, ad groups using Custom Product Pages (CPP) saw 12.1% higher tap-through rates than ad groups using the default App Store page.
Of the users who tapped, 9.6% more installed.
The two lifts compound. 22.9% more installs per impression, from changing nothing except the App Store page users land on.
Now, without CPP, Apple Ads already convert higher than other acquisition channels due to their high-intent surface. And a 9.6% relative lift on a 63.9% baseline pushes conversion to 70%.
The math holds across categories and markets: At 1000 impressions, the same campaign produces 62 installs without CPP and 76 installs with it. You don’t touch spend, bid, or keywords.
This doesn’t show up in the country or niche charts because the data assumes a generic product page. Apply CPP, and every CPA in this report can shift down to something close to 19%, regardless of your market. Or your niche.
What to do with this: Audit your top 10 keywords by spend. For each, check whether the App Store page users land on after the tap actually mentions the thing they searched for. If it doesn't, that's where the next round of optimization starts.
What should you do with these benchmarks?
Two practical takeaways:
Treat country benchmarks as a test list, not a rebudget plan. The cheapest, highest-converting markets in the dataset (Brazil, Colombia, the Philippines, Romania, Azerbaijan, Jordan, Morocco) are where small test budgets earn the most learning per dollar.
They don't replace your US or UK spend. They give you optionality. Pick 2-3 that match your category positioning, validate over 30 days, measure on retention rather than install volume, and decide whether to scale from there.
Treat niche benchmarks as economic signals, not profitability verdicts. The 14x CPT spread between Religion and Exam Preparation isn't a 14x quality gap. It's a 14x difference in what the bidders in each category can afford to pay, which reflects how each category monetizes.
A $10 CPA in Exam Prep can be more profitable than a $0.50 CPA in a low-LTV utility. The benchmark tells you what shape of business the auction expects you to be running. Your break-even calculation tells you whether you're winning at it.
The full benchmark dataset, including all 90 countries and 59 niches with CPA, CPT, CR, and TTR, lives in the Apple Ads for Subscription Apps 2026 report.