Creative-funnel match: Why your ads and your onboarding need to tell the same story
TL;DR:
- Under Meta's Andromeda algorithm, the creative selects the audience before the click. Andromeda reads what the creative signals (visual style, hook, narrative) and matches it to users it thinks will respond.
- The funnel is where you find out which users were. Run the same funnel against five creatives, and you'll see five different conversion rates, because each creative brought in a different audience.
- CTR and CPC don't distinguish a curiosity-driven audience from a paying one. The funnel does, but only if you read it creatively.
- The architecture most teams run, one funnel for every ad, is the dominant source of wasted spend in 2026.
You launch a new creative. CTR is high, CPC is low, and the algorithm is spending. Two weeks in, you pull the funnel: Visits up, purchases flat. Same product, same paywall, same onboarding flow. Only the creative changed, and the funnel numbers fell apart.
The funnel didn't fail. It worked exactly as designed, on users who were never going to buy. The creative brought them in. Nobody on the team asked who, or whether the funnel was built for them.
That's the consistency problem. What used to be a copy review (does the tone match, does the messaging match) is now the biggest preventable leak in paid UA for subscription apps. The reason has a name: Meta rolled out a new algorithm in late 2025, and it changed how the creative decides who clicks.
What does the ideal creative-funnel setup look like?
Some teams don't have this problem. Their creative and funnel stay aligned with very little intervention, and naming what that setup looks like matters, because most teams aren't there, and treating the ideal case as the baseline leads you to fix things that aren't broken.
Four things are true at the same time:
- The product has product-market fit. The team isn't still testing whether the value proposition lands.
- UA is past the learning phase. Spend goes to creatives the algorithm has clean data on, and CAC stays in a predictable range week to week.
- A handful of top creatives keep bringing in a paying audience, at enough volume that the team can describe who's coming in and how they behave.
- The team can describe the ideal buyer in concrete detail. The funnel reflects that buyer back: The pains the creative names show up in the first onboarding screens, and the paywall references the framing the user came in with.
Teams running this setup ship faster and hold conversion steady. New creatives land on a known audience profile and a funnel built around the same pains, which gives Meta a clean conversion signal to optimize against.
What does the reality look like for most teams?
Most teams are somewhere earlier in the build, and the conditions that would make creative-funnel consistency easy aren't there yet. The common pattern:
- PMF is still a hypothesis. The product exists, but the team is testing whether the value proposition lands and who's responding to which version of the pitch.
- The ideal buyer is fuzzy. The team has a working description of the audience, but not one sharp enough to forecast payment behavior.
- The buying algorithm hasn't accumulated enough signal. Conversions are too few or too noisy for Meta to optimize against the target event, so spend gets allocated against weaker proxy events instead.
- Creative testing is chaotic. New narratives and promises ship in parallel, without a clear plan for what comes next or why.
- A meaningful share of spend goes to creative tests with unpredictable performance. You can't forecast what a new creative will pull in until it's been live for a week.
In that environment, the funnel can't show you anything stable. You can build it to match the right pain. You can build it to warm up the right audience. The purchase line still goes flat, because the algorithm is sending users the team didn't design the funnel for, and the funnel alone can't tell you which problem you're looking at.
The data below shows pCVR (predicted conversion rate, results from FB-click) on the same fully-performing funnel, day by day, before and after a stable-volume top creative was found. Only the creative changed, and with it the audience the creative was selecting.
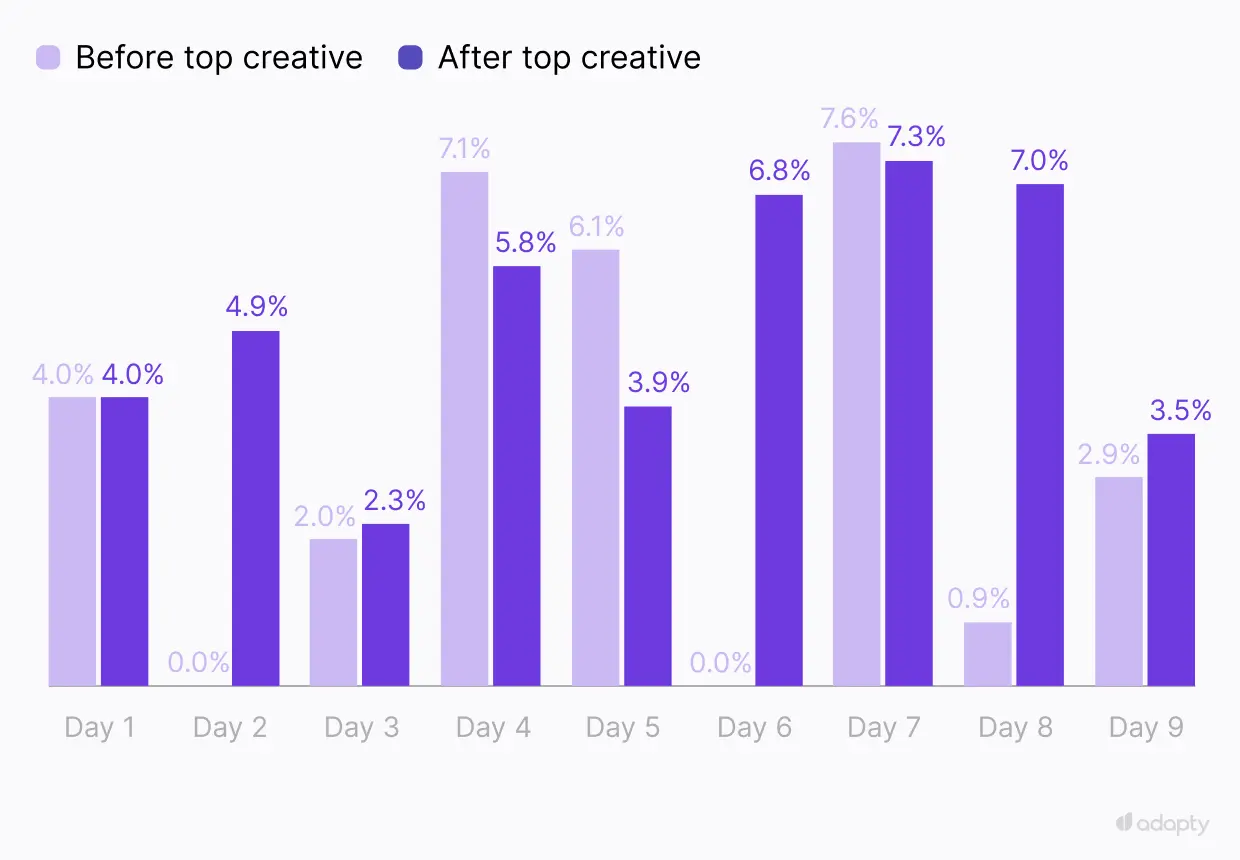
Before the top creative, the numbers look like a broken funnel: three days at 0%, swings from 0.89% to 7.55%. A team optimizing this in isolation would spend two weeks trying to fix something that wasn't the problem. After the top creative ran long enough to stabilize volume, the floor lifted off the worst days, and the range tightened. The funnel hadn't changed. The audience Meta was sending it had.
Same product, same funnel, radically different results
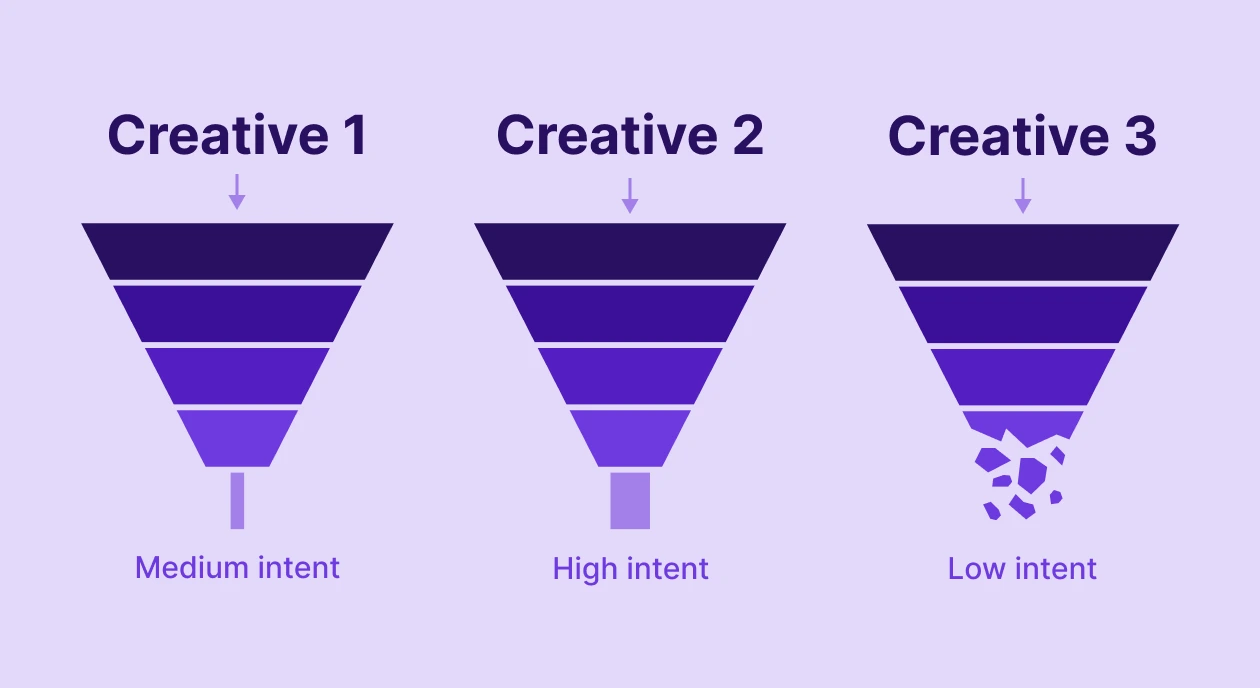
Run different creatives against an identical product, paywall, and onboarding flow, and the conversion rates can look like they're from different apps. Two patterns explain most of what shows up:
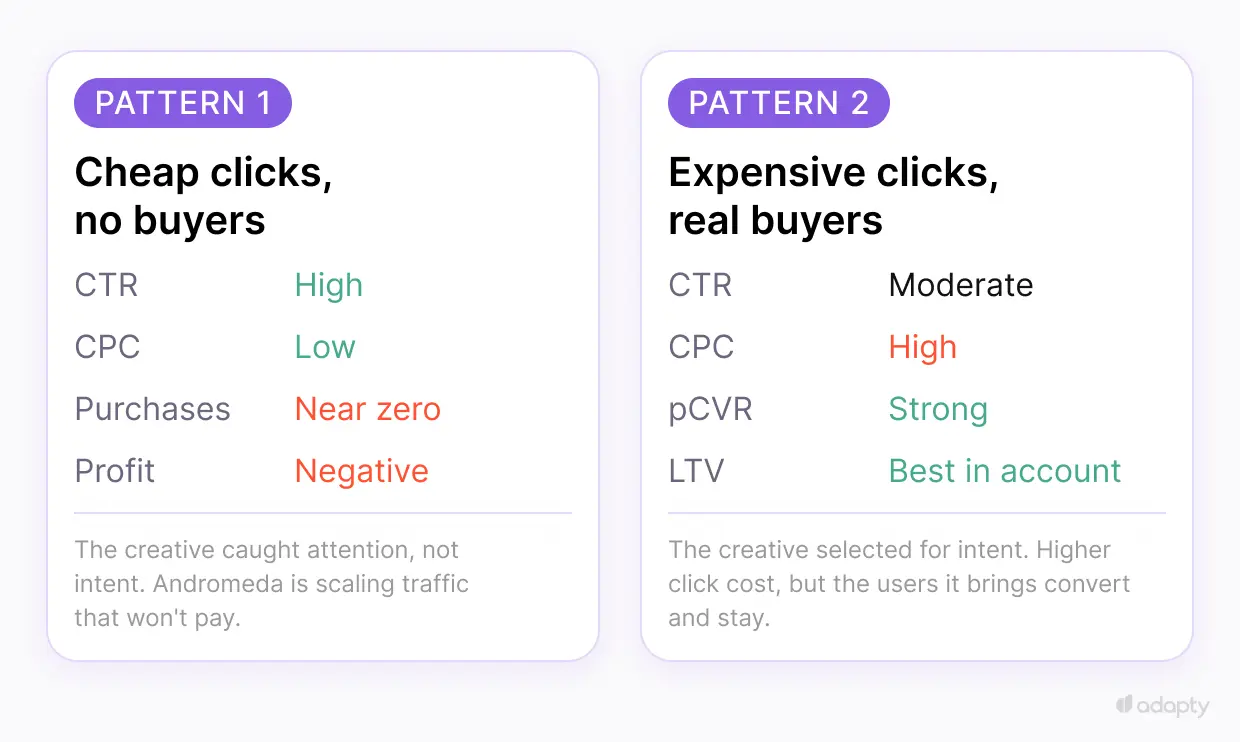
Both patterns can run inside one campaign with identical targeting and event optimization. The numbers are split because the creatives are selecting different audiences.
The chart below shows pCVR by individual creative inside one campaign. Each pair of bars is one ad: The lighter bar shows how many users engaged enough to enter the funnel, the darker bar shows how many of them completed a purchase.
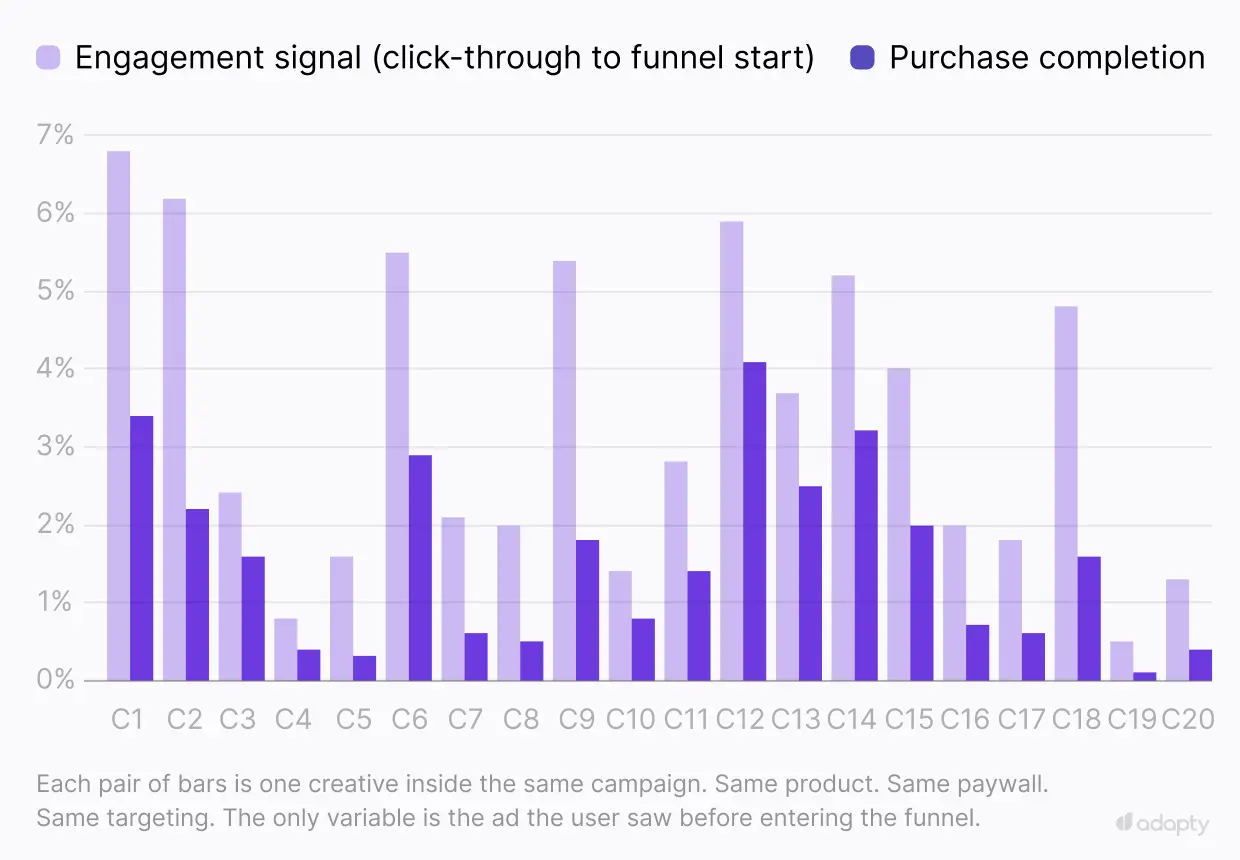
The purchase line moves from near-zero to over four percent, and the gap between engagement and purchase shifts with every creative. A few ads pull in heavy engagement and convert almost none of it. A few others pull in less traffic, but a higher share of that traffic pays.
Most teams aren't measuring this. CTR and CPC live in one dashboard, owned by UA. Funnel completion and pCVR live in another, owned by the product. The two views rarely sit next to each other, which is why the answer to "which creative should we scale" usually depends on whose dashboard you opened first.
So why does it happen?
The creative is the first filter, the funnel is the second
Under Andromeda, your creative does the work that targeting used to do. It selects which users see the campaign before anyone clicks anything. Andromeda matches users to ads about 100x faster than the previous infrastructure, and it reads each creative across multiple dimensions at once: what the visual signals, what the hook implies, what the emotional register suggests about the kind of user who'd respond. We covered the full mechanics in our ad testing guide for 2026.
The practical consequence is straightforward. The creative becomes the input signal Andromeda uses to decide who clicks, what they expect when they do, and how willing they are to pay. Two ads for one product, with identical budgets and targeting, can pull in completely different audiences.
A good creative does two things at once. It pulls in the people who fit your product and pushes the rest away. The filtering happens through a few specific elements:
- It speaks to your product's ideal user, not the broader adjacent crowd around them.
- It names a specific pain the user recognizes.
- It shows a clear solution.
- It makes the product format obvious (quiz, plan, tracker, coach) so the user knows what they're clicking into.
- It avoids "freebie" promises, which select for users optimizing for cost.
A creative that hits all five attracts a buyer. A creative that misses two or three attracts a clicker.
| User type | What hooks them in the ad | Funnel behavior | Purchase |
| The curious | "Take this test," "find out which type you are." | Fast and shallow. Taps through, doesn't read. | Rarely |
| The solution-seeker | A specific pain they recognize | Slow and considered. Reads and completes the flow. | Sometimes |
| The ready-to-pay | Result, outcome, value demonstrated | Completes the flow. Examines pricing closely. | Yes |
| The price-sensitive | Discount, free, limited offer | Drops at the pricing screen. | Rarely |
The four types show up in every account in different ratios, depending on which creatives are running. CTR and CPC don't distinguish between them. A curiosity-driven creative and a solution-seeking creative can post the same click cost and the same engagement signal, with completely different downstream behavior.
That's what makes the funnel the second filter. The creative sets the user's expectation before the click; the funnel surfaces what that expectation was. By the third onboarding screen, you can tell whether someone came in looking for a solution or for entertainment. By the paywall, you can tell whether they came in willing to pay or hoping for a free version.
For every creative, the funnel exposes a behavioral signature: how the user moves through the questions, how they react to complexity and price, and whether they were inclined to subscribe in the first place. None of that is visible at the click. All of it is visible in the funnel — once you read the funnel by creative instead of in aggregate.
The creative selects who shows up. The funnel surfaces who they were all along. Teams that read both halves of the signal find their top creatives faster and stop spending against audiences that don't pay.
How the creative-funnel mismatch shows up and how to diagnose it
Once the creative is selecting the audience and the funnel is reading it, the next question is operational: how do you tell when there's a mismatch, and where exactly it broke? Mismatch shows up in two ways.
Content mismatch
The creative promises a particular conversation; the funnel delivers a different one. Three common shapes:
- The creative focuses on a narrow pain. The funnel opens with broad onboarding questions that ignore it entirely.
- The creative speaks to a wider problem than the funnel solves. The user expected a general program; the product turns out to be narrower than the ad implied.
- The creative promises a specific format (a personal plan, a 14-day challenge, a daily coach). The funnel doesn't reflect that format, and the user notices on screen one.
The user clicked, expecting one conversation and got another. They don't articulate the mismatch. They leave.
Audience mismatch
The creative pulled in users who don't match the product's ideal buyer. Three common shapes:
- The tone and visual style of the creative resonate with a demographic outside the product's actual ICP.
- The creative misleads by overstating outcomes, oversimplifying the product, or implying something it can't deliver.
- The creative is clickbait. The hook drives engagement, but the expectations it sets are ones the funnel can't meet.
The signature is different from the content mismatch. Content mismatch drops users in the first three screens — they leave before committing. Audience mismatch sends users all the way through the funnel and stalls them at the paywall — they engaged with the experience, but won't pay for it.
The funnel tells you which version you're dealing with. Pull it by creative, and you can see who showed up, where they dropped, and which messages aren't surviving contact with the experience the product delivers.
How to read the data
Most teams look at CTR, start rate, and pCVR in isolation. Each metric is true on its own and incomplete on its own.
For every creative, pull the full chain — view, click, start, complete, purchase, and LTV if you have it. Then check three things:
- Do the answers match the message? A creative about sleep tracking should produce funnels where users concentrate their answers around sleep, not spread them evenly across weight loss, energy, focus, and sleep.
- Does the intent match the framing? A creative promising a serious program shouldn't produce funnels full of low-effort, formulaic answers.
- Does the audience match your ICP? How much overlap is there between who the creative attracted and the user profile the product is built for?
A note on volume. The analysis works once enough users from a creative have moved through the funnel to read the signal. Below a few hundred, you're reading noise.
| Segment | Reach | Spend | CPM | CPC | CTR | CR to purchase |
| Female | 14,096 | $3,972 | $229.10 | $10.80 | 3.0 | 1.81% |
| Male | 6,595 | $1,110 | $134.70 | $4.20 | 3.9 | 0.73% |
The data is from a real app, same creative, two demographic segments. Women cost $10.80 per click, men cost $4.20. By CPC, the male segment looks like the better buy. By conversion to purchase, the comparison inverts: women converted at 1.81%, men at 0.73%. The two segments roughly break even on CAC, and once LTV is included, the female segment wins outright.
CPC and CTR couldn't tell you which segment was worth scaling. The funnel did.
The diagnostic checklist
When you suspect a creative is underperforming, work through the checklist in order. About 30 minutes per creative, and you'll come out with either a fix to apply or a kill decision.
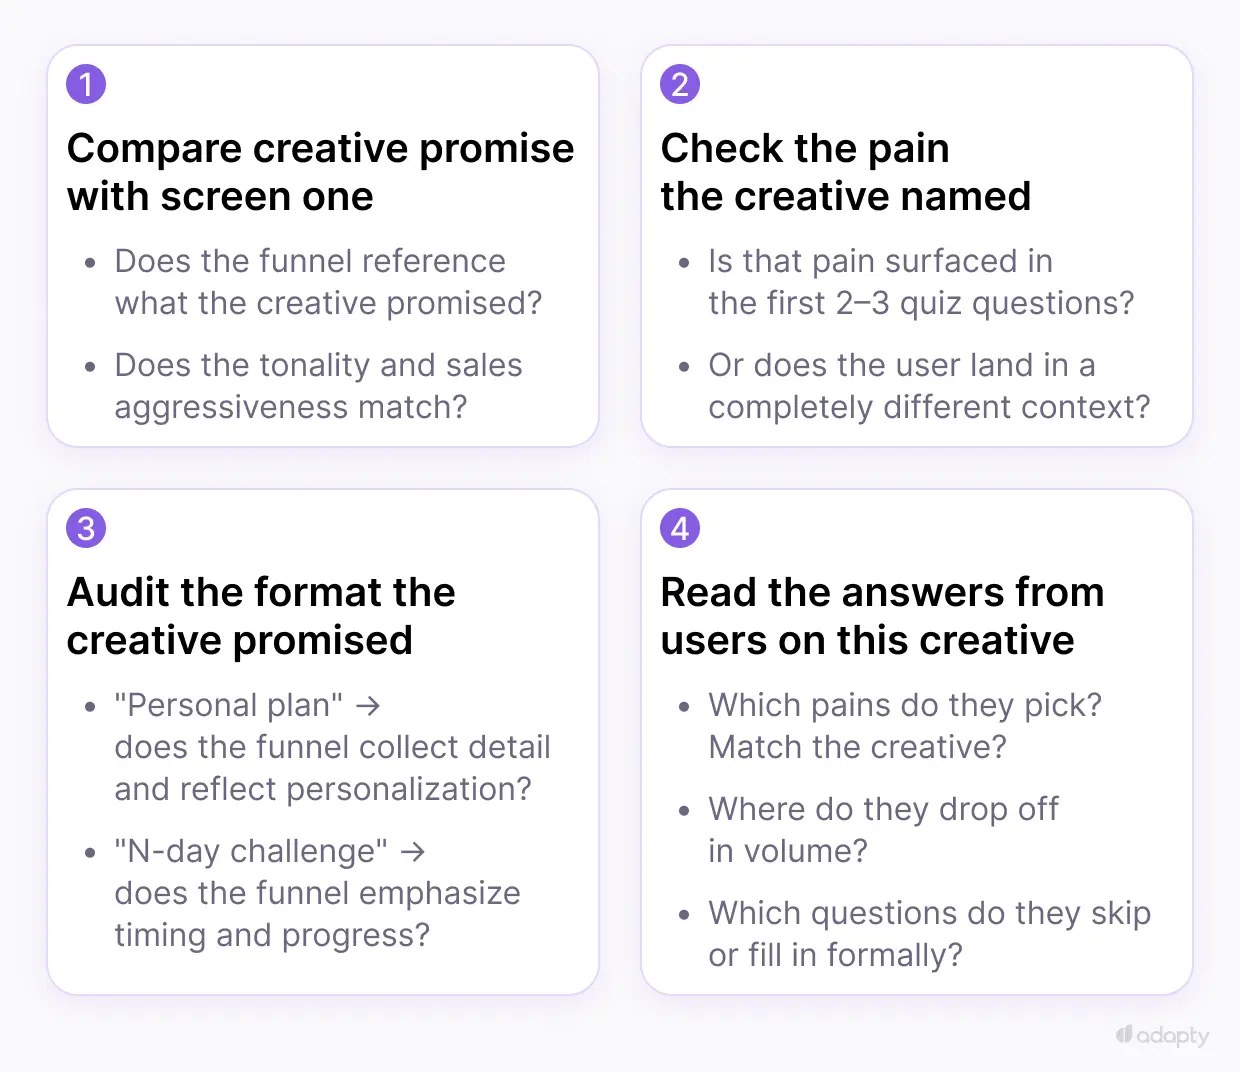
If steps 1-3 point at a gap between what the creative promises and what the funnel delivers, the fix is on the funnel side. If step 4 shows the audience the creative attracts doesn't match your ICP, the fix is on the creative side. Most cases are 70/30: Both ends need work, but one carries more weight.
What to do about it in practice
Diagnosing the problem is the easy part. The harder question is what to do about it on Monday morning, when the UA team is asking for new funnel variants, and engineering is booked for the next six weeks.
Four moves, in rough priority order.
Move 1: Get the UA signal from the algorithm itself
Talk to your UA team and track which creatives Meta keeps scaling. Not which ones started strong, but which ones the algorithm keeps spending against week after week. Two things to extract:
- Which messages and narratives keep getting impressions, and which die after the first few hundred dollars?
- How long do the top creatives stay top? Andromeda churns creatives fast: A creative that holds volume for three weeks is telling you something a creative that peaks in two days can't.
Read that pattern as a signal about who the algorithm is currently bringing in. If your three best-scaling creatives share the same emotional register or the same problem framing, you haven't won the creative game. Andromeda is telling you who's available to be acquired right now.
Move 2: Analyze conversions and behavior by creative, and feed it back
The data you get from looking at creative and funnel together is the fuel for your next round of hypotheses. Three places it goes:
- Narrative refinement. Creative messages that survive contact with the funnel are the ones worth expanding. Messages producing strong engagement but weak conversion are flagging an audience-fit problem that the next creative iteration needs to address.
- New creative angles. Funnel answer patterns (which pain users from a creative pick, which they skip) point to angles the creative isn't surfacing yet. Sometimes the right next creative is built from a behavior pattern you noticed two weeks ago.
- ICP refinement. Sometimes the data shows the ideal buyer isn't who the team assumed. The female-vs-male segment example earlier is the most direct version of this: the funnel surfaced something the targeting brief had missed.
The goal is alignment across UA, product, and design on who's paying and why.
Move 3: Build sub-versions of the funnel for your top creative narratives
This is where most teams hit the wall. The diagnosis points to a clear fix: Different creatives need different funnels. The execution is a sprint, a release cycle, and an argument with engineering about priority. Most teams don't do it. They write a Slack message about narrative consistency instead.
Skipping it has the biggest revenue cost of any move in this list. The creatives already pulling your top spend are the ones whose funnel mismatch is doing the most damage, and getting them their own variant is where the lift actually shows up.
Adapty's Flow & Paywall Builder was built for this. Three pieces matter for the creative-funnel problem.
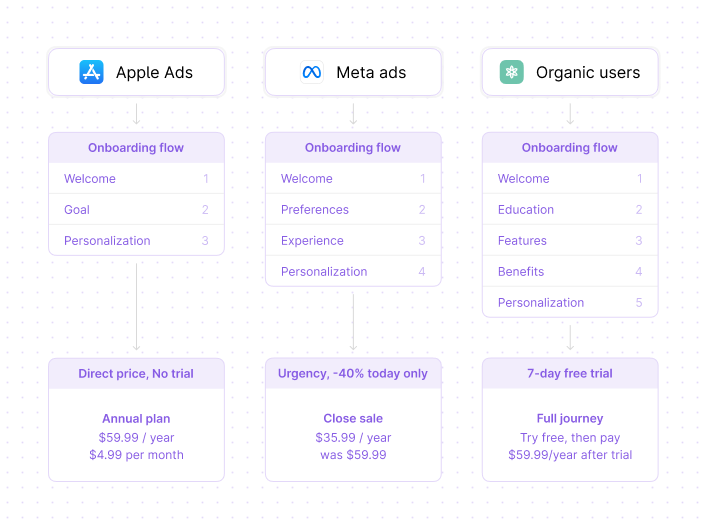
Attribution-powered targeting. Flow Builder reads from Adapty's attribution data, which means you can target a flow by channel (Meta vs. Apple Ads vs. organic) or further down by specific Meta ad creative, by specific Apple Ads keyword. A user who clicks your transformation-story video lands on a different opening screen than a user who clicks your feature-list static. Same product, same paywall logic, different framing, and the platform tracks which user saw which ad, so the routing happens automatically.
Branching onboarding inside one flow. Users route to different screens based on their answers. A solution-seeker who picks a specific pain in question one takes one path through the onboarding; a curious user picking a generic answer takes a different one. The flow stores the answers as variables and references them later in the paywall copy, in the offer, in the screens that follow, without engineering touching the app code.
Flow-level A/B testing. Flow & Paywall Builder tests the journey, not just the paywall. When a variant ships, the onboarding questions and the paywall framing move together. That matters because conversion lifts rarely come from one screen alone. They come from a sequence that adds up. Paywall-only tests can't show you that. They tune the price while the onboarding sells someone else's product.
Flow & Paywall Builder tests the journey, not just the paywall. Onboarding questions, paywall framing, and the offer move together as one experiment, so you can tell whether the lift came from the new opening or the new pricing. Run the same onboarding underneath every paywall test, and you'll never find out — the numbers stay flat, and the reason stays hidden.
Here's what that looks like in practice. An A/B test on welcome-screen adaptation to top-performing creatives:
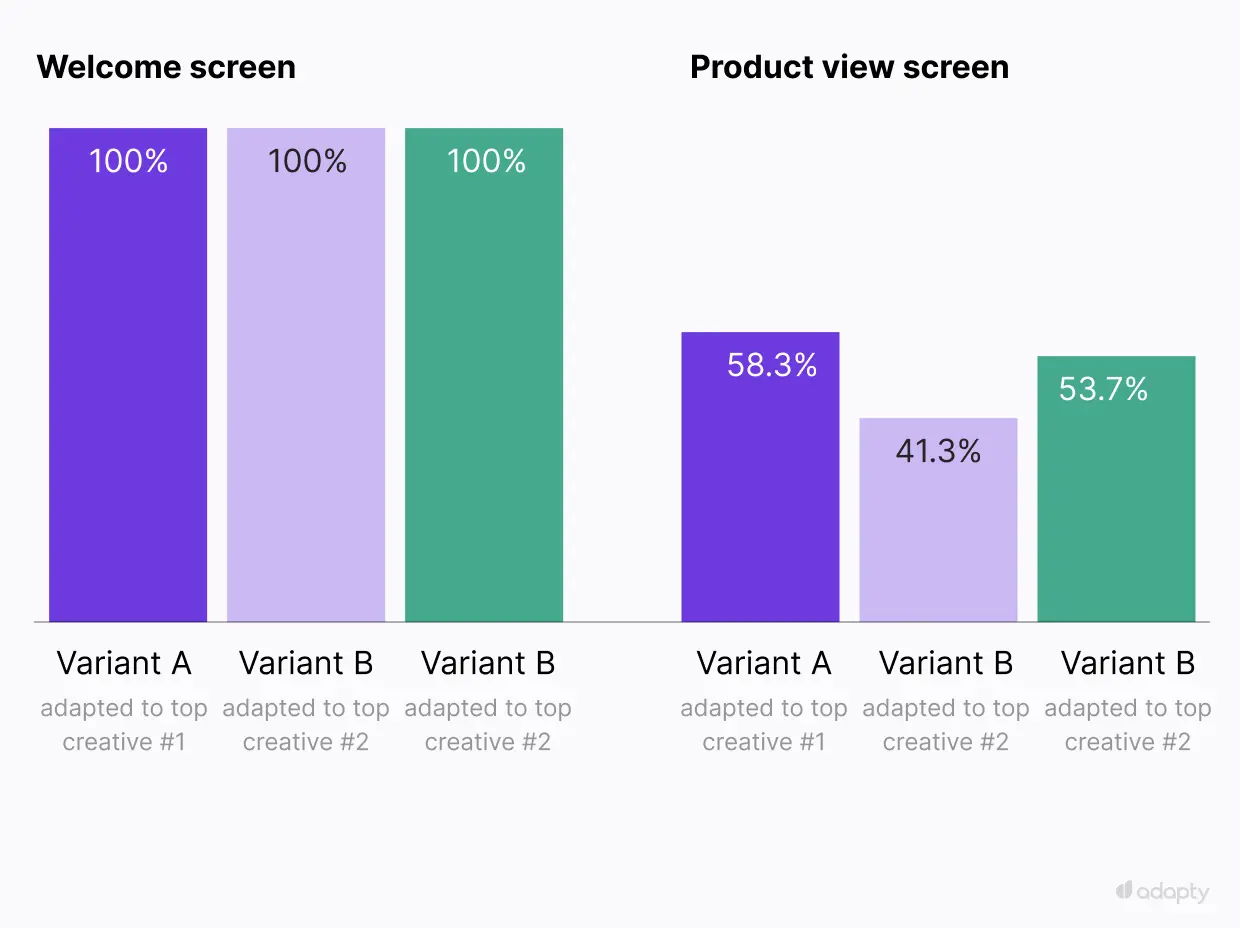
Three variants of the welcome screen, each adapted to a top-performing creative. All three got 100% of their cohort to the welcome screen itself. By the second product-view screen, the spread had opened to 58.3%, 41.3%, and 53.7%. Only the first screen changed between variants; the paywall, offer, and downstream funnel were identical. Seventeen percentage points of completion difference between the best and worst variant came from the opening alone.
Move 4: Share the funnel-creative insights across teams
The last move is also the one teams skip most often. Funnel behavior by creative is useful data for UA, but the same data answers questions for product and design, too. UA learns which audiences are showing up. The product learns which user expectations the product is failing to meet. Design learns where the onboarding is breaking the promise the ad made.
Teams that hold this conversation weekly ship better creatives, funnels, and products in parallel. Teams that don't end up running UA, product, and design as three separate operations, with three separate views of what's working and three different theories about why the numbers won't move.
The bottom line
Most teams running paid UA are still optimizing the click and the conversion as separate problems. CTR teams ship better creatives, funnel teams ship better paywalls, and the leak between them gets blamed on either side, depending on who's in the room.
Under Andromeda, that split is the highest preventable cost in your account. The creative selects the audience. The funnel reveals what kind of audience it was. Teams pulling ahead have stopped chasing CTR, start rate, and pCVR in isolation. They read each creative as a signal of who it's bringing in, and they build the funnel to match.
If your funnel is the same for every creative, you're paying Meta to send you four different audiences and giving them the same experience. The math on that gets worse every quarter.
Run a different funnel for every top creative without engineering
Flow & Paywall Builder reads from Adapty's attribution data, which lets you route users to different onboarding flows and paywalls based on the exact Meta creative or Apple Ads keyword they clicked. Test the journey, not the button.