Mobile app analytics stack: UA, monetization & product metrics explained

Scaling a subscription app means guesswork stops working. Every dollar you invest in user acquisition, every pricing test, and every feature you ship needs data-driven decision-making.
But here's where most teams go wrong: they track metrics in silos, without looking at a complete picture. Every metric actively influences another. Track them separately, and you miss the compound effects that accelerate or sabotage growth.
In this article, we break down the key metrics for mobile apps, explain how they work together, and provide current benchmarks.
What are the key metric types in mobile app analytics?
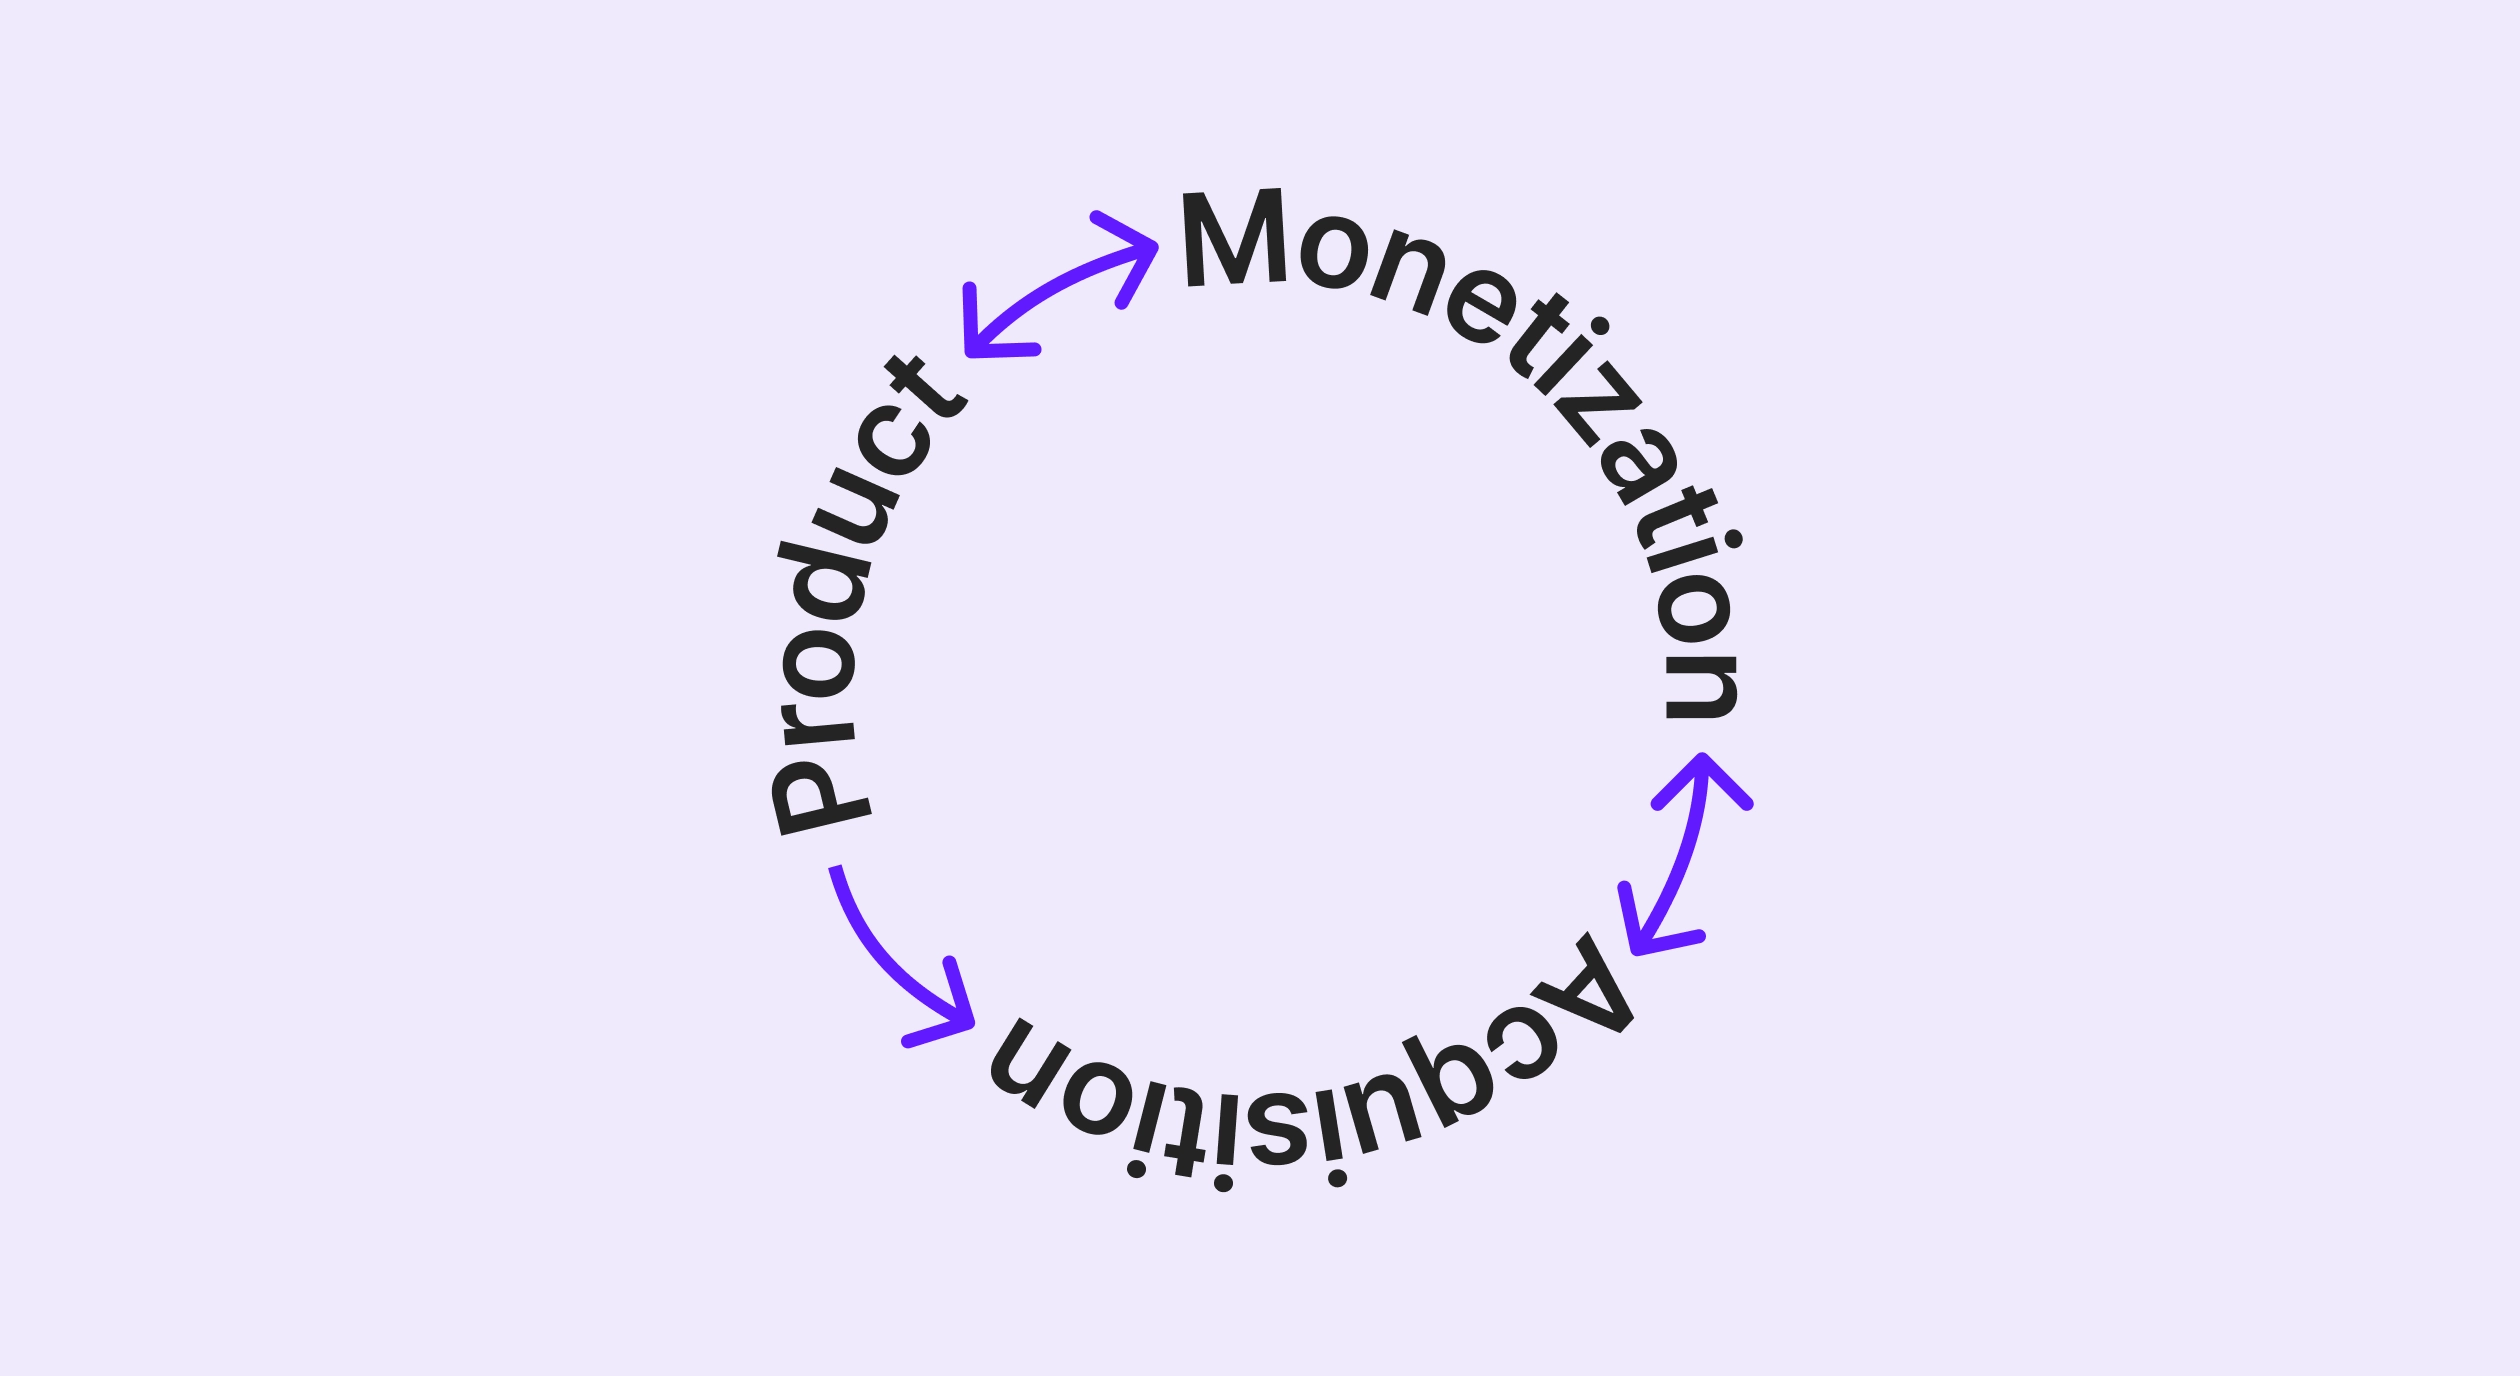
Complete app analytics requires three interconnected pillars:
- User acquisition (UA) analytics – How people discover and install your app
- Monetization analytics – How installs translate into revenue
- Product analytics – How users behave inside your app
Each pillar informs the other two. Let's break them down one by one.
What's UA analytics and how it works
User acquisition analytics shows whether your marketing spend is efficient, which channels work, and where traffic quality breaks down.
Core UA metrics
| Name | Why track it | Avg benchmarks | If below the benchmark |
| CPM (Cost Per Mille — thousand impressions) | Ad cost efficiency | US: Meta $30–70. Global: $10–20. TikTok usually lower. | Fix targeting, test formats |
| CTR (Click-Through Rate) | Creative strength and relevance | Weak <0.6%, solid ~0.8–1%, excellent >2%. | Refresh creatives, refine audience |
| CPI (Cost Per Install) | User acquisition cost | iOS — $3–5, Android — $2–3 | Optimize funnel, cut weak channels |
| Impression-to-Install rate | Funnel health | 3–4% is good | Improve creatives, fix store page |
Levels of setup
There are three ways to setup UA analytics for your app:
- Lightweight — relying on manual tracking from ad managers and App Store Console
- Partnered — adding to Mobile Measurement Partners (MMPs; e.g., Adjust, AppsFlyer) to attribute traffic to channels
- Centralized — using tools like Tableau or Looker to centralize all cruical metrics (not only UA) in one place
What's monetization analytics and how it works
Monetization validates whether UA spend makes sense and reveals how your subscription model earns and retains revenue.
Core monetization metrics
| Name | Why track it | Avg benchmarks | If below the benchmark/ drops |
| MRR | Core revenue growth | Steady monthly increase | Audit pricing, boost retention |
| CAC | Cost per paying user | Varies significantly by app and market.In the US: $30–70. | Improve targeting, cut spend |
| ARPU/ARPPU | User monetization | Varies strongly | Rework paywall, upsell offers |
| ROAS | Ad spend efficiency | 200–400% is healthy | Pause/optimize campaigns |
| LTV | Long-term user value | >2× CAC | Fix churn, raise ARPU |
| Refunds rate | Revenue quality check | 4–7% typical | Review flows, flag fraud |
What's product analytics and how it works
Product analytics tracks what happens from the first tap onward. For subscription apps, this is where conversion and retention are won or lost.
Core product metrics
| Name | Why track it | Avg benchmarks | If below the benchmark/ drops |
| Retention (D1, D7, D30) | User stickiness | Varies strongly | Improve onboarding, add hooks |
| DAU/MAU ratio | Engagement intensity | 20–30% healthy | Add features, boost stickiness |
| Session length/depth | Usage quality | Varies by category | Simplify UX, add value |
| Funnel conversion | Revenue path | 30-50% Day 0 conversion into trial | Fix onboarding, test paywalls |
| Feature adoption | Impacts retention | Key features widely used | Promote features, refine UX |
The unified loop: how metrics types interconnect
UA, monetization, and product metrics form a feedback loop. Changes in one ripple through the others. Here's how:
- Product → Monetization – Better onboarding, retention, and funnel conversion lift ARPU and LTV.
- Monetization → Product – Refunds, churn, and paywall test results guide your roadmap. Revenue data reveals which features keep users paying.
- Monetization → Acquisition – High LTV and ROAS allow you to bid higher and expand reach. Stable cash flow funds aggressive reinvestment.
- Acquisition → Monetization – Traffic quality determines conversion. Low-intent users from weak targeting raise CAC and lower ARPU/LTV.
- Product → Acquisition – A sticky product delivers organic growth and reduces CAC. Strong retention amplifies paid campaigns.
- Acquisition → Product – Poor targeting attracts users who churn fast and send false signals that your product doesn’t work.
Conclusion
Tracking metrics in isolation means you optimize locally but miss systemic issues. You might celebrate dropping CPI without realizing those cheaper users have terrible LTV. You might build features while ignoring a broken paywall.
The goal is alignment. When UA brings high-intent users, product delivers fast value, and monetization captures it effectively, growth becomes self-sustaining.
For a deeper look at how analytics can help your app reach $100K MRR, download our full ebook.