The 10 key mobile app metrics you need to track
What are the mobile app metrics that you must be tracking? When it comes to measuring how your mobile app business is doing, the Apple App Store and Google Play collect several metrics. With third-party app analytics tools, you can unlock even more data. Throw in a few more solutions from your app stack – like the one you use to power your in-app purchases – and you’ll be looking at several dozen mobile app metrics. You could easily end up tracking a hundred of them.
But measuring all the metrics all the time isn’t practical or essential. Trying to do so actually throws you into the “you-have-too-many-metrics” problem. It’s real. Too much data (of which a significant part is just information that doesn’t translate to actionable insights or learnings) adds more overhead to the already overwhelming problem of collecting, processing, and analyzing data. Did you know that most of the data that even enterprises collect – up to 73% of it– remains unused? Don’t let this happen to you.
Instead, focus on a few key metrics that tell you everything you need to know about how your app is doing. Start with the mobile app metrics listed here to get a head start.
1. App installs
Installs are the #1 metric you want to be measuring. This fundamental metric captures the number of install events your app sees. Simply put: It’s the number of times your app gets installed.
Google calls this metric “Installs” and defines it as the “number of times your app was installed,” but also explains that this number includes reinstalls. So if a user uninstalled your app and then reinstalled it, the reinstall is captured as an install.
The App Store, on the other hand, tracks this information using the “Downloads” metric. Apple explains that download data includes both first-time downloads and redownloads:
“When a user downloads your app to their device for the first time, it’s counted as a First-Time Download.” “A Redownload occurs when a user who previously downloaded your app adds it to their device again.”
If you analyze your app install data over a period like a year, you’ll be able to discover periods that bring more users. For instance, many apps in categories like social, lifestyle, and payments see more downloads during the holidays. Such insights can help you plan better user acquisition campaigns.
2. App uninstalls
The Uninstalls metric shows the number of times that your app gets uninstalled.
Now, when it comes to the uninstall metric, Google Play actually gives you a (tentative) number. When it detects that a user has become inactive, it considers it an uninstall and reports the same. The App Store, however, doesn't give you this number directly. Instead, it uses retention to show you how you're retaining or engaging users rather than losing them (as there’s no way to report the number with a 100% accuracy). Third-party mobile app analytics solutions that report this number use tools like silent push notifications to capture/gauge the app uninstall events.
When analyzing the uninstalls metric, it’s important to note when the uninstalls peak:
- Do most users uninstall your app the first time they ever launch it? Investigate app crashes/freezes. App uninstalls can also hint at a mismatch between what users expected your app to do (based on your app store listings) and what it actually does.
- Do they uninstall your app somewhere along the app onboarding journey? Review your onboarding workflow. Review a few app session recordings using privacy-friendly app analytics tools to uncover potential issues. Find out if you’re looking like you’re asking for a lot of personal information to onboard new users. Are you asking for your users’ email? Could that be the problem?
- Do they uninstall your app after a few sessions? Double-check for performance issues like slow loading. If you use ads to monetize your app, assess if your advertising is coming off as too intrusive. Also, watch out for spamming users with too many push notifications – it can lead to uninstalls. Sometimes, your app happens to be one of the “few” apps a user downloaded to try. In this case, there’s nothing to do!
- Do they uninstall after their free trial ends (after canceling it)? Showing a special offer paywall while they're still trying the app may help avoid this churn.
- Do they uninstall after the second or third subscription period (if you offer a subscription app) or after a few weeks or months of using your app? Some user churn is inevitable. However, you should learn if strategies like launching new features more regularly can save some percent of this.
All in all, app uninstalls can hint at a host of things. Always keep monitoring and analyzing this metric.
3. User retention
In general, the app retention rate metric gives you the percentage of users that you managed to retain (and perhaps engage).
Note that there are several ways to approach the retention rate metric for a mobile app. For example, if you've a subscription-based app, you'll calculate your user retention rate by dividing the number of active users at the end of a period by the number of users who were active at the beginning of the same period. This metric is expressed as a percentage. As you can see, this is more like your subscription retention rate.
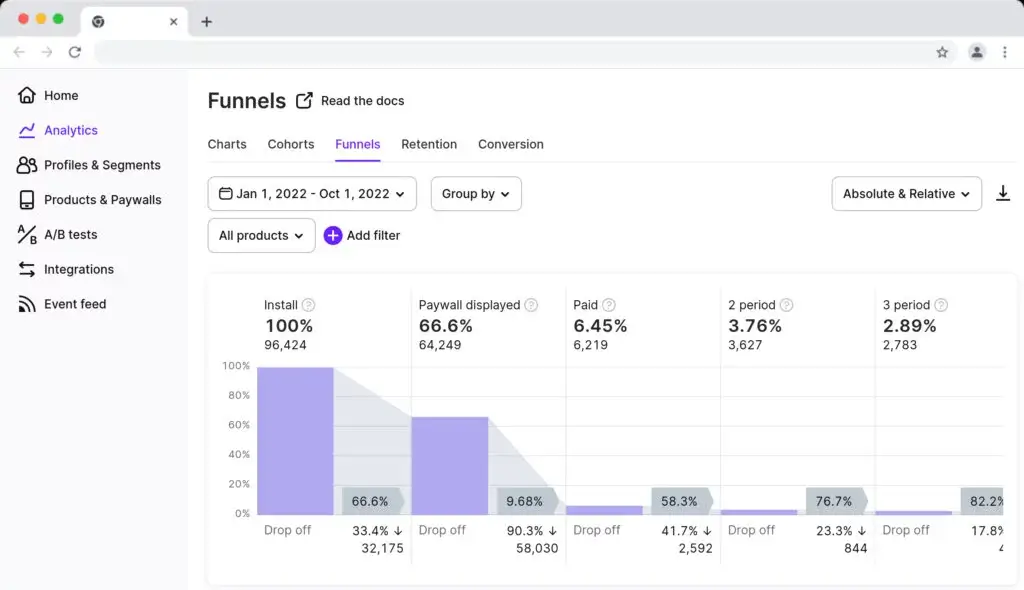
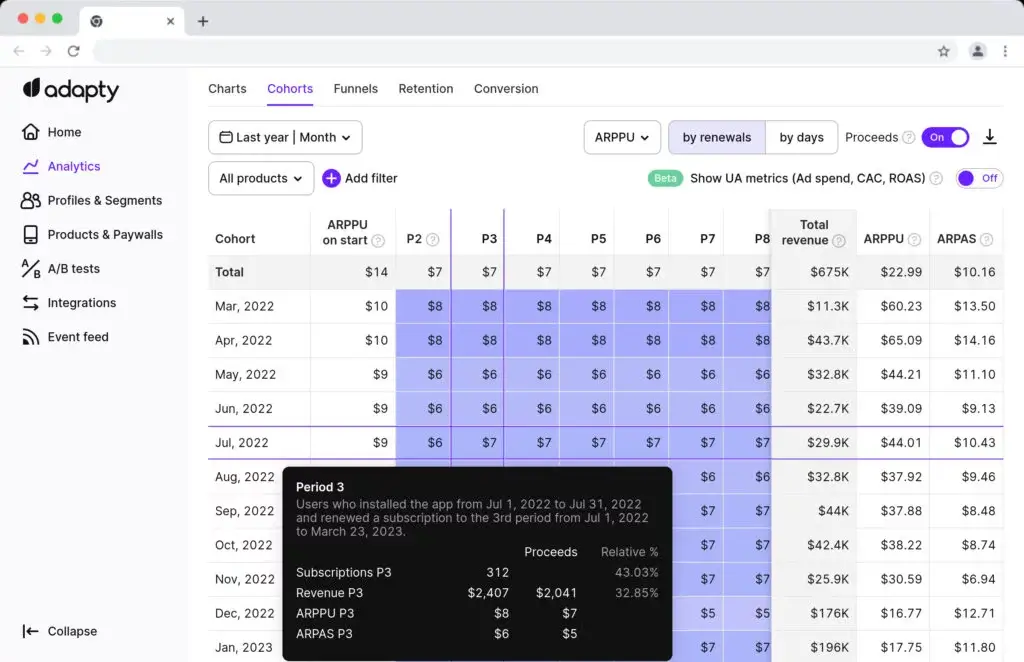
In the following funnel chart, Adapty shows you the retention rate for a subscription-based app for its first, second, and third subscription periods. You can see that the retention rate is gradually falling, which is typical for subscription-based mobile apps:
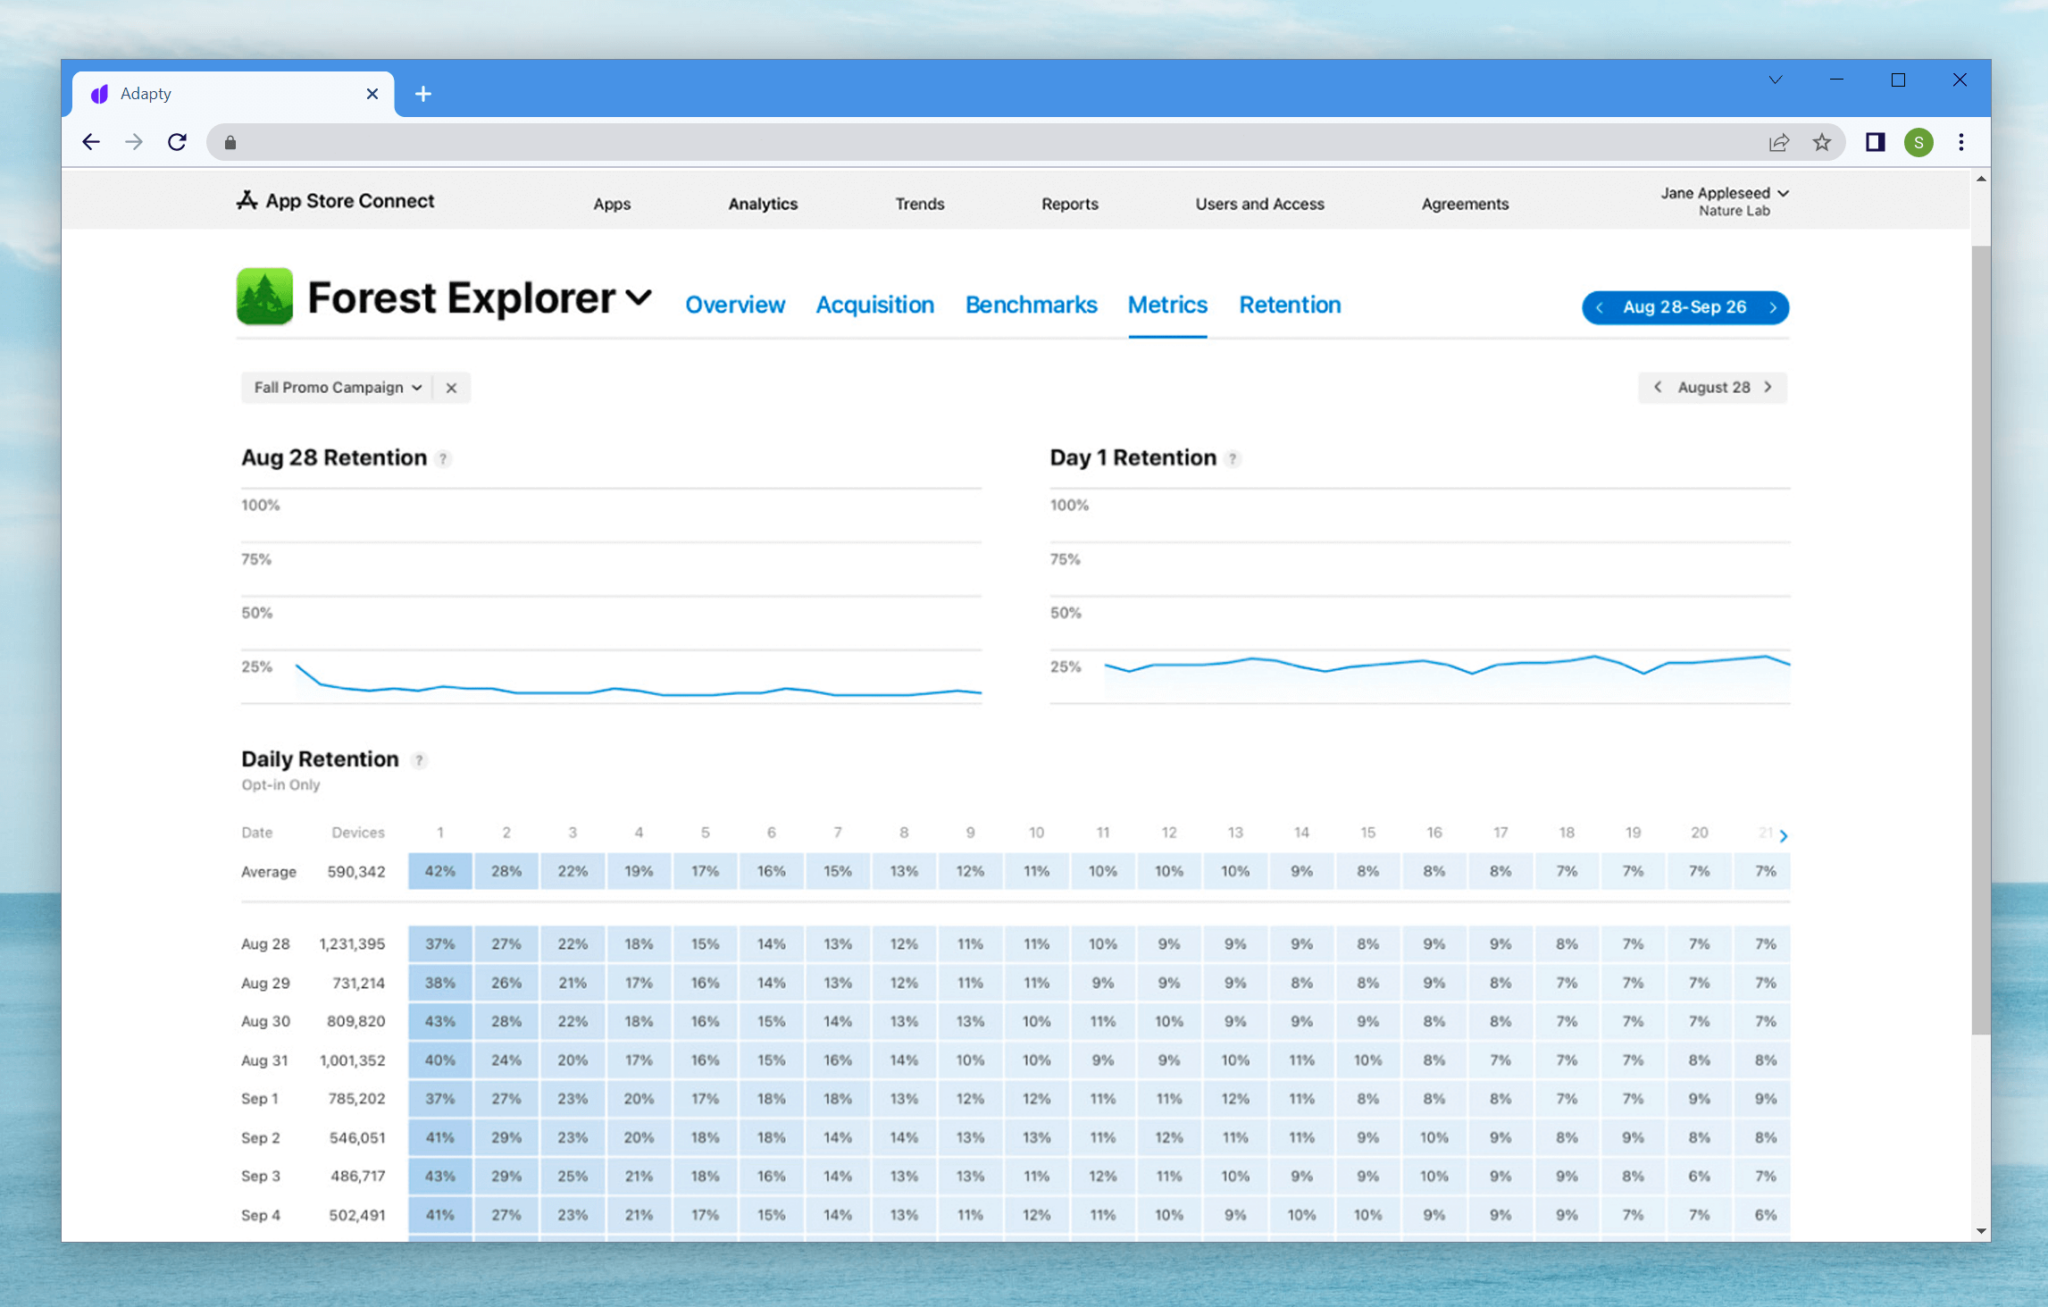
Now, this is an example of the retention rate metric in a subscription app. But even if you offer a freemium app or a free app or an app with non-subscription/one-time in-app purchases, you’d still want to see how you’re retaining your users, as your monetization potential ties directly to the volume of users you maintain. In this case, your app retention rate is about generating insights into app usage or engagement and seeing how often users return to your app. The App Store offers some excellent out-of-the-box reporting on the retention metric. The App Store explains that its retention metric gives you the data that can “help you understand whether users enjoy their initial app experience. If your retention rate is low, you might update your onboarding experience to help users better understand your app and see if retention rates improve.” Below, you can see an app's daily retention rate: (You can also see the average daily rate retention pinned at the top.)
The retention rate metric can be complex. We’ve only touched upon the basic idea here. Here’s more on how the mobile app retention rate metric works.
4. Daily active users (DAU)
The Daily Active Users (DAU) metric is the number of app users who open your app within a given day. This is one of the key metrics that you can use to measure your app engagement levels. However, this metric can be more or less important to you, depending on your app. For instance, if you've a workout app, you'd want to monitor this metric closely as it measures the “stickiness” or continued engagement that your app needs to see to succeed.
But if you've a rental app, there's no reason why you'd be obsessed with the daily active users metric. You'd not expect this metric to be your core engagement metric in this case.
Likewise, if you're a tax filing app, you'd expect your users only to check out your app during the filing season unless you also offer expense tracking, in which case, daily access of the app might be meaningful. You get the drift.
Session length and frequency are also engagement metrics that, like the DAU metric, can mean a lot to apps in some categories. For example, a shopping app might want its users to access it ever so frequently. It will also like its users to spend a lot of time browsing its products.
5. Conversion rates
So there are two kinds of conversion rates. Let’s talk about your app store listing conversion rate first. The app store listing conversion rate is (broadly) the number of times your app store listing is seen divided by the number of downloads it gets.
The App Store calls this the "App Store Conversion Rate". Every time your app is featured in the App Store (as a search result or as an ad or as a suggested listing on the Today tab, for instance), Apple counts it as an impression. If your app gets 100 impressions and 50 downloads, your conversion rate becomes 50%.
When it comes to Google Play, the Android app store keeps this simpler. It calls this metric the “store listing conversion rate” and defines it as the “percentage of store listing visitors that resulted in acquisitions.” Unlike the App Store, Google Play doesn’t get into the specifics of impressions.
One sure way to boost your app listing conversion rate is to run A/B tests on your app store listings. Both Google Play and the App Store let you test different listings to see which ones get you the most conversions.
Another way to boost app store listing conversions is to customize it from time to time. For example, during holidays, when the app stores are some of the busiest digital places, giving your app listing a “holidays” feel can improve your conversions.
Pricing, too, can be a factor here, so price testing can also help.
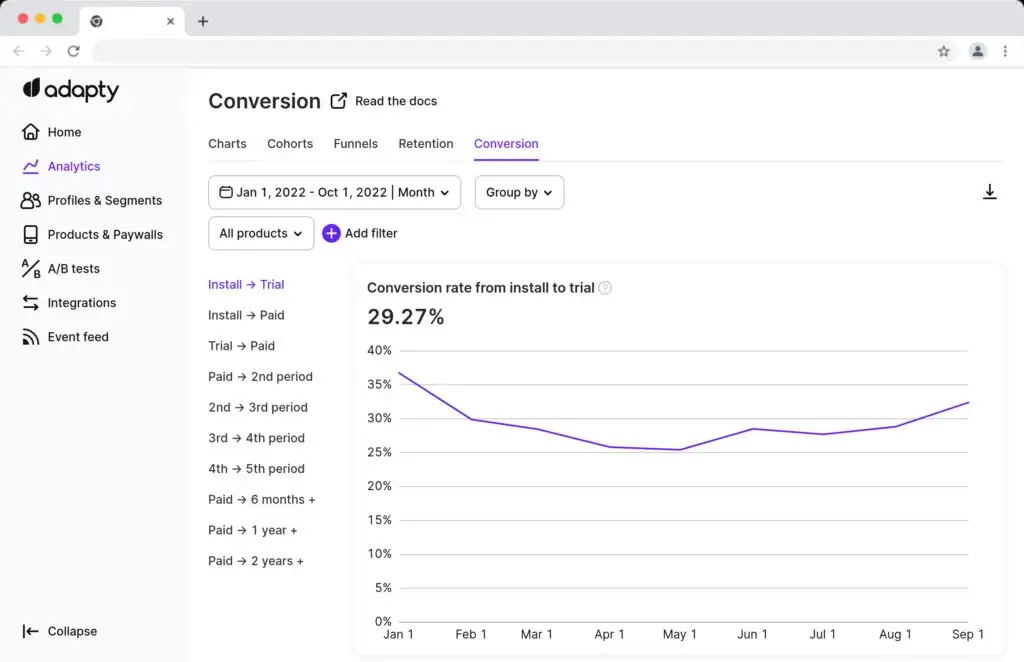
Now, let’s get to the second kind of conversion rates app businesses need to monitor. These are like your “in-app conversion rates” and matter post the download. So if your app is free to download but puts users on a free trial upon install after which they’re automatically put on a subscription plan, your actual conversion rate is the one that happens when users sign up for a free trial:
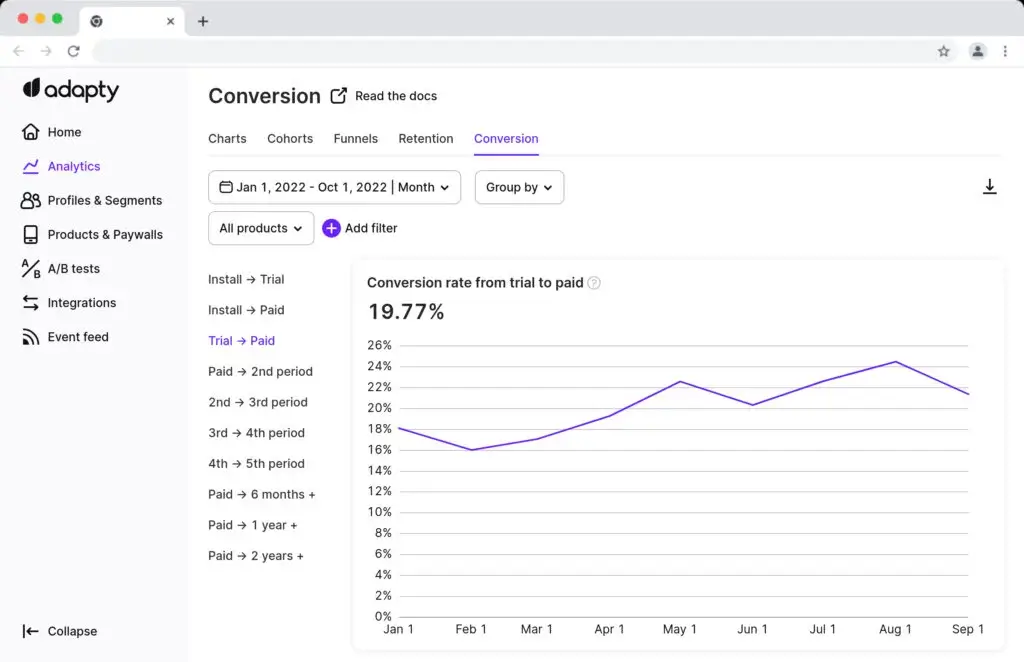
Moreover, at the end of the free trial, you’ll need to measure yet another conversion rate: the trial-to-paid conversion rate.
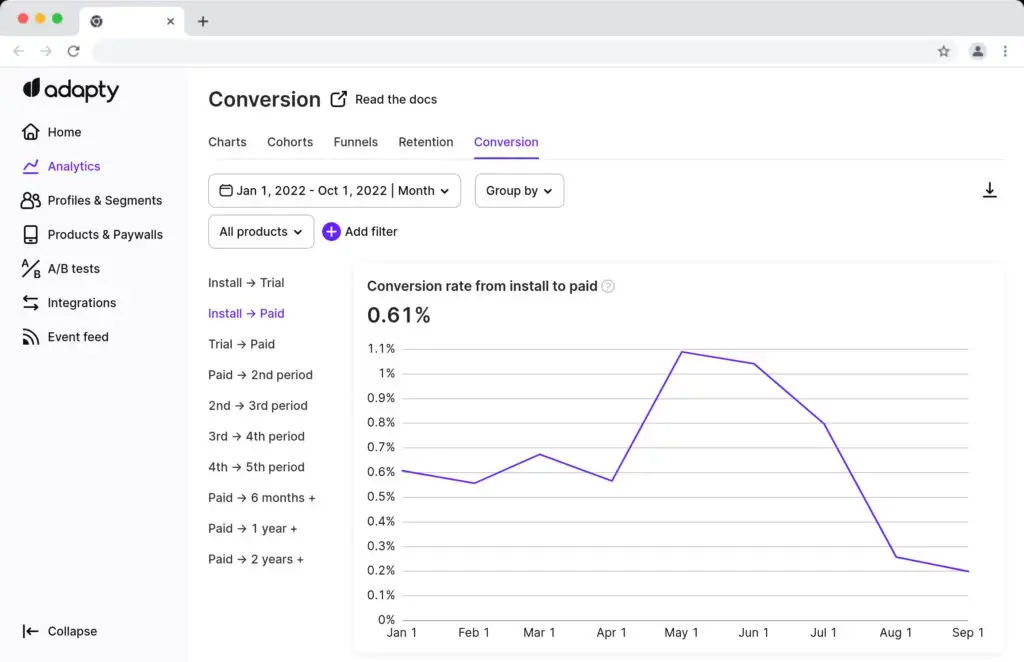
Likewise, if you offer a free-to-download/freemium app and show you users a paywall to unlock the app or your whole app, your actual conversion rate is your install-to-paid rate:
With a solution like Adapty, you get all this reporting right out of the box.
6. Average revenue per user (ARPU)
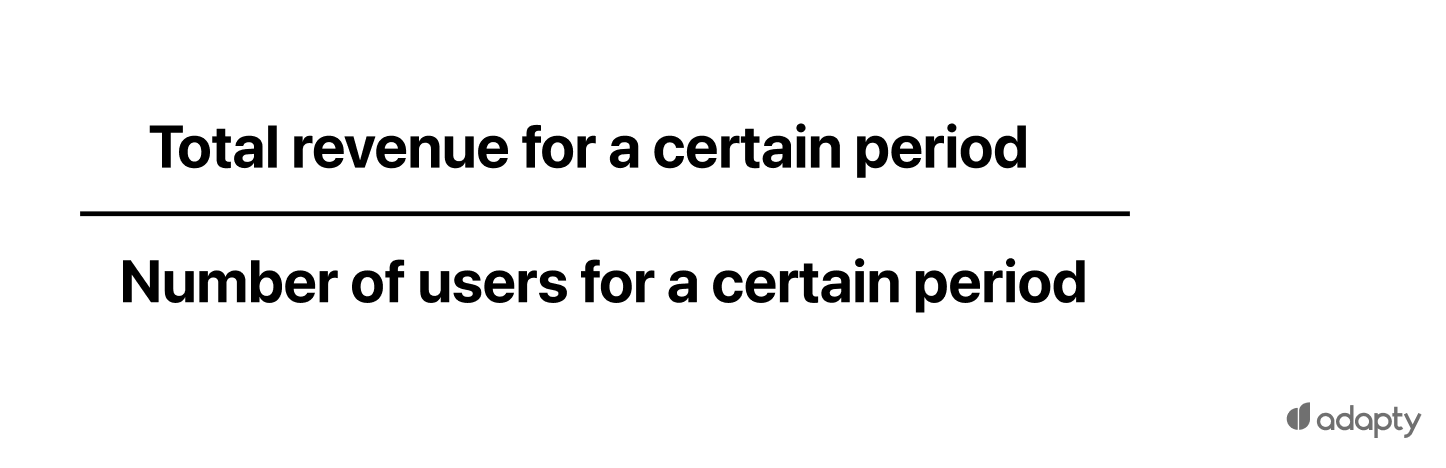
Another key metric to measure when you offer in-app purchases is the Average Revenue Per User or the ARPU metric. The ARPU metric gives you the average revenue that you make per user. So it shows you how your in-app purchases are doing. Roughly, if your app generates $10,000 in in-app purchases and you've 1000 app users, your ARPU is 10 (10000/1000).
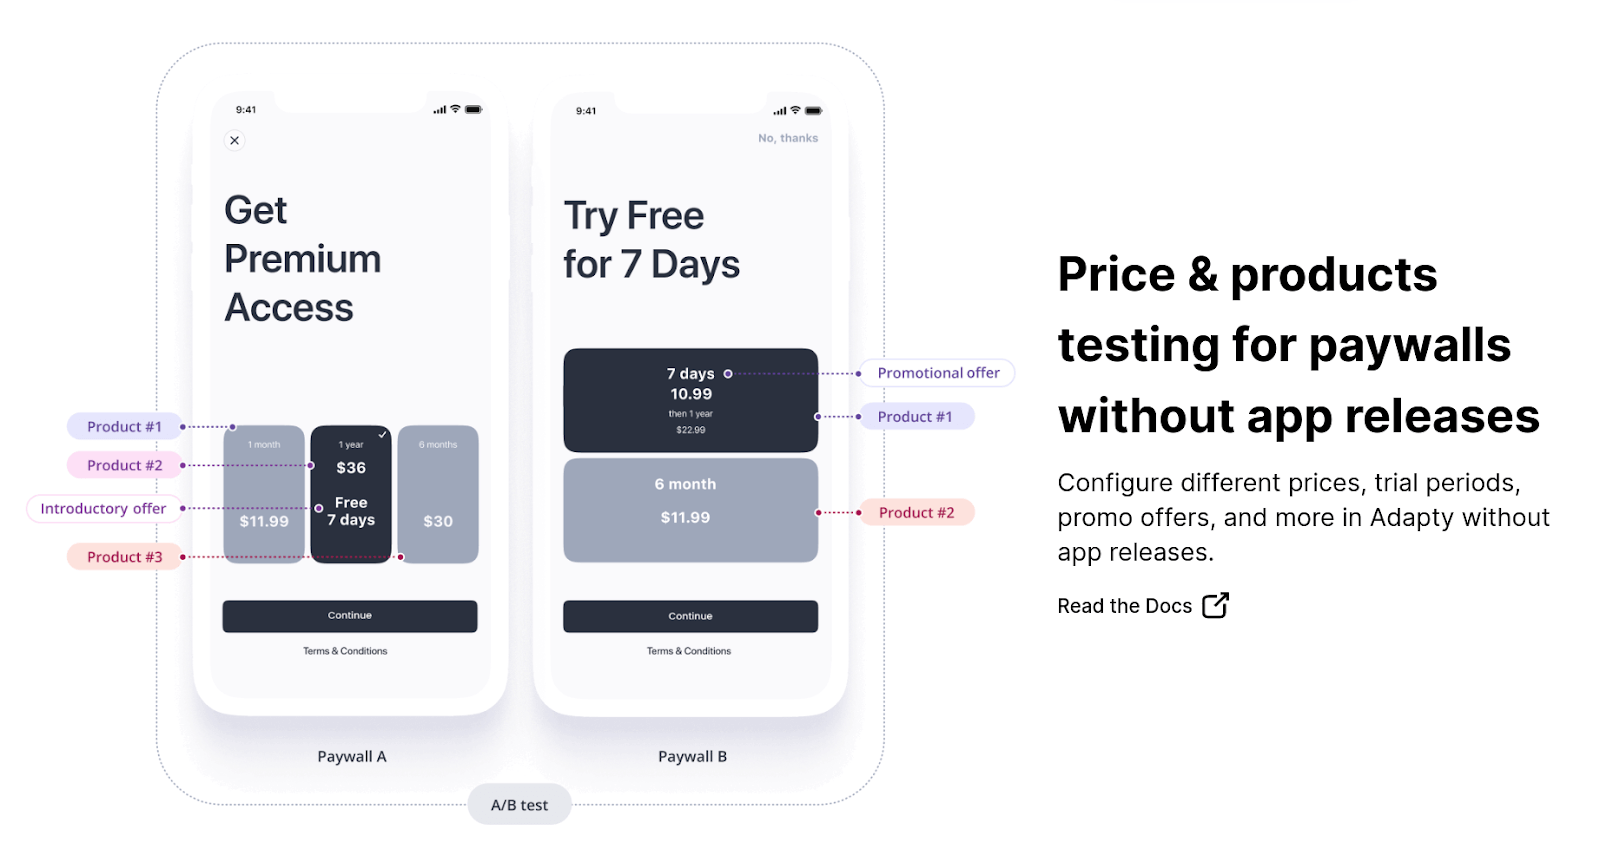
If you've a very low ARPU, it might indicate problems with your in-app purchase strategy. In this case, you can try experimenting with pricing or with your products. A solution like Adapty can help you run A/B tests on your paywall and test different price points and products to find the ones that convert the best:
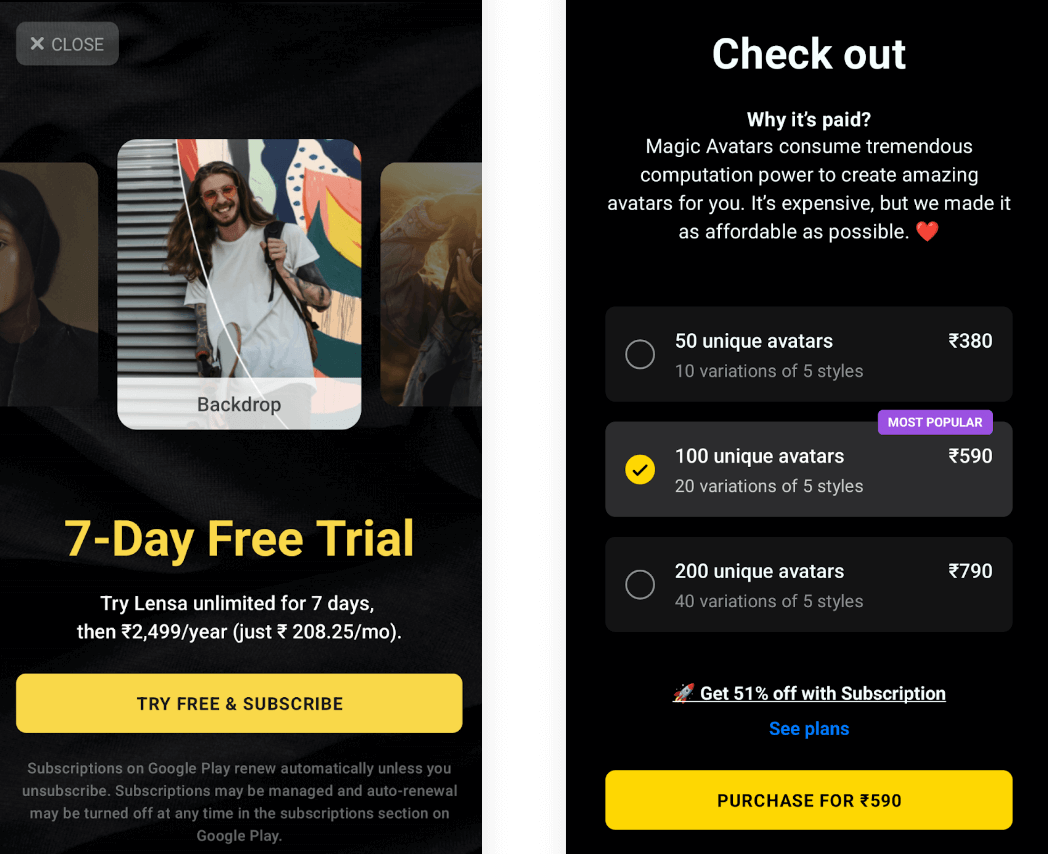
Using app monetization models that offer a mix of one-off products and subscriptions can also be one way to increase your ARPU metric. One-off products appeal to a wide range of users, while subscriptions bring predictable revenue (and naturally contribute to your ARPU). Check out our article on monetizing a mobile app to learn more about how you can boost your ARPU metric. Here’s the app photo editing app Lensa offering diverse offerings:
While we’re at it, let’s talk about ARPPU as well.
ARPPU stands for the Average Revenue Per Paying User metric. This metric only factors in paying users. It leaves out the majority of the non-paying users from the average revenue per user calculation.
So if your app generates $10,000 in in-app purchases and you've 100 app users (who have made a purchase with you), your ARPU is 100 (10000/100). The ARPPU will almost always be higher than the ARPU.
The ARPPU metric better reflects what a paying user means to you from the revenue perspective. It helps you focus on the paying user segment that you can leverage to generate even more revenue. Read up more on the ARPPU metric here.
7. Cost per install (CPI)
This metric is for you if you use ads to acquire users/app installs.
The cost per install metric is calculated by dividing your total advertising spend by the number of app installs generated from the advertising campaign. For example, if an advertising campaign costs $1,000 and generates 1,000 app installs, the CPI would be $1.
So if you want to measure the effectiveness of your advertising campaigns and find out the campaigns (and the creatives and keywords) that bring you the most installs, you need to measure this metric.
When you measure this metric to analyze your advertising channel, you should also measure how the leads you acquire through it translate to revenue in the long term. In other words, also monitor your paid leads' lifetime value.
8. Customer lifetime value (CLTV)
You can get your Customer Lifetime Value (CLTV) by multiplying your Average Revenue Per User metric with the expected user lifespan and subtracting the Cost of Acquisition. For example, if you make an average revenue of $5 from a user (per month) and your average customer lifespan is 6 months with the cost of acquiring being $5, your CLTV would be $25 ($5 x 6 - $5).

You could loosely say that your CLTV metric is your ARPPU metric, but seen over a really long timeline.
The Average Revenue Per User metric that we just saw can be calculated by analyzing the in-app purchases a user makes. You can also use ad revenue to calculate this metric. The expected user lifespan is typically based on historical user data and user retention rates. We already saw how to go about retention rates. Finally, the cost of acquiring the user can be calculated based on the channel. We just saw how the cost per install metric works for the paid channel. More on this in just a bit.
If you review your average Customer Lifetime Value (CLTV) on a segment level, you might even see which user segments bring you the most revenue.
9. Subscription churn rate
If you offer subscriptions as in-app purchases, this is one of your core metrics. It gives you the percentage of subscribers that you’re losing.
A mobile app’s subscription churn rate is calculated by dividing the number of subscribers who stop using an app during a specific period by the total number of active users at the beginning of that period. For example, if a mobile app had 1,000 active subscribers at the beginning of the month and 200 of those users stopped using the app during the month, the churn rate would be 20% (200/1,000).
App subscribers can abandon an app for a host of reasons. We saw some of these when we discussed the Uninstalls metric. To rehash some of it, note times when churn peaks. If you see that users abandon your app immediately after the first launch, it might be a performance issue or poor onboarding.
If it happens to be around the second month or so for an app that charges monthly, it might be that you’re failing to meet your users’ expectations. Perhaps your users are expecting to see more/newer features.
Also note that a percentage of churn is involuntary too. Check out our guide on how enabling grace periods on the App Store and Google Play can help avoid involuntary churn.
Reducing your app churn rate can involve a range of strategies, such as improving the user experience, adding new features, and implementing retention campaigns. For example, you might want to add a push notifications tool to your app stack and get users to use your app more often, thereby boosting engagement and reducing churn. You get the drift.
10. Customer acquisition cost (CAC)
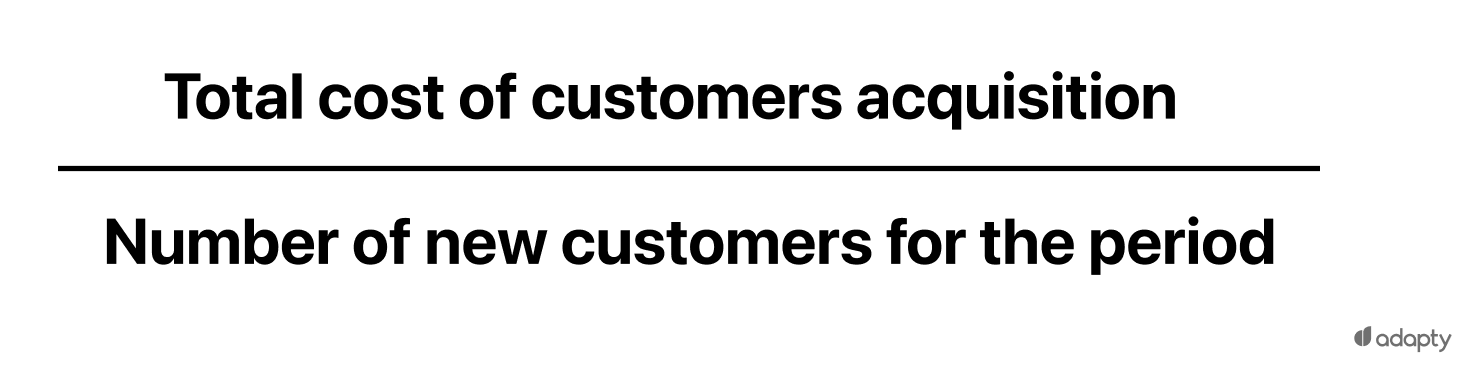
The Customer Acquisition Cost (CAC) is the cost you pay to acquire a user. The CAC metric is quite tricky to calculate as it can involve a lot of variables. To calculate your CAC, you need to divide the total costs associated with acquiring new users by the total number of new users acquired during the same time period.
For the sake of simplicity, here's a sample calculation. If you spend $10,000 on marketing in a month and acquire 1,000 new users during that same month, your CAC would be $10 per user.
You’d want to keep optimizing your acquisitions campaigns, so you have a lower CAC, allowing for even more acquisitions!
In addition to these ten core metrics, you’d also want to monitor your app for instances of freezes/crashes and errors. If you review app listings, you’ll see that most poor ratings are because of an app’s performance issues. So set up testing to catch and fix errors before they reach your app users!
Wrapping it up…
As a mobile app business, you want to know how you’re acquiring new app users (the channels that are getting you new users and the kind of money you’re spending on converting them). Metrics like Conversion Rates and Installs help you with this.
You also want to know how your users are using your app. Metrics like Session Length and Frequency and Daily Active Users (DAU) help to monitor your app usage and engagement.
Finally, you’d also want to get a handle on your app’s financial health. Metrics like the Average Revenue Per User (ARPU), Customer Lifetime Value (CLTV), and Cost of Customer Acquisition Cost (CAC) offer all the data you need on your revenue. As part of this, you also want to know how you lose your app users and what your app uninstall trends look like and what causes uninstalls, and so on. Metrics like churn rate and uninstalls help here.
Broadly, these metrics cover everything you need to measure. However, depending on your app, you should switch them with ones that make more sense. Just ensure that you're intentional with any metric that you add to your mobile app monitoring mix. Also, remember to tap benchmark data to see how you’re doing in your category.
About Adapty
Adapty is an in-app purchase solution that lets you enable in-app purchases inside your iOS and Android apps. Adapty also doubles up as an app analytics tool giving you answers to most of your revenue questions right out of the box. Check out how Adapty can help you automatically capture your mobile app’s key revenue metrics. Adapty doesn’t just measure these metrics for you but also helps you improve them with paywall customization, experimentation, and personalization.