With the global mobile app market now exceeding $600 billion in annual revenue, a question like “How much do apps make?” has become a legitimate business inquiry. The mobile app industry continues its remarkable growth trajectory, with projections showing it will reach $780+ billion by 2029 and potentially $1 trillion by 2034. New publishers and developers enter the market every day, seeking their share of this enormous opportunity.
That’s why we’ve developed this ultimate app revenue guide that answers all the essential questions about the industry in 2026. Adapty is the leading solution for growing mobile in-app subscriptions, and our expertise comes from thousands of clients using our platform, with millions of A/B tests launched monthly. With this guide, we aim to give you everything you need to build a sound business plan for your app.
In this comprehensive guide, we’ll cover: the difference between proceeds, revenue, and profits; how VAT and taxes affect your earnings; the dramatic changes to App Store commissions following the 2025 Epic Games ruling; modern strategies for reducing platform fees (including Web2App); and proven methods to boost your incoming cash flow. By the end, you’ll understand not just how much money an app can make, but how to make significantly more.
Revenue vs. proceeds: Understanding the difference
Adapty helps developers monitor and optimize their subscription-based business models, which is crucial for growing both mobile app revenue and proceeds. But first, we need to understand the critical difference between these two terms.
Revenue is the total amount of money your app earns from all sources: ads, in-app purchases, and subscriptions. It’s the gross income before any expenses are deducted.
Proceeds refer to the net amount you actually receive after all direct costs have been subtracted. The two primary direct costs are App Store commissions and taxes (VAT/sales tax).

Consider a practical example: When a user purchases a $10 subscription through the App Store, your revenue is $10. If the App Store takes a 30% commission ($3), your proceeds would be $7. However, as we’ll explore later, the 2025 regulatory changes have significantly altered this calculation for many developers.
Revenue to proceeds calculation
| Step | Amount |
| User payment (Revenue) | $100.00 |
| VAT deducted (20% example) | -$16.67 |
| After VAT | $83.33 |
| App Store commission (30%) | -$25.00 |
| Developer proceeds | $58.33 |
Mobile app market in 2026
The mobile app industry continues its remarkable growth trajectory. In 2025, global app revenue reached approximately $585-613 billion, with consumer spending on apps hitting $150 billion. For 2026, projections show the market climbing to $630-650 billion, driven by AI integration, subscription growth, and expanding global smartphone adoption.
| Year | Global Revenue | YoY Growth | Key Driver |
| 2022 | $469B | +17% | Post-pandemic normalization |
| 2023 | $526B | +12% | Subscription expansion |
| 2024 | $540B | +3% | Market maturation |
| 2025 | $585-613B | +8-13% | AI apps boom |
| 2026 (proj) | $630-650B | +7-8% | Continued AI & subscriptions |
| 2029 (proj) | $780B+ | 7-8% CAGR | Global expansion |
Key market statistics for 2026
- Over 5.5 billion people access the internet via mobile devices (96% of internet users)
- Users spent 4.2+ trillion hours in mobile apps in 2024-2025
- Consumer spending on App Store and Google Play projected to reach $233 billion by end of 2026
- AI apps revenue grew 136% YoY, reaching $8.5 billion in 2025
- Subscription revenue reached $66.8 billion in 2024, with 73% from iOS users
- 98% of global mobile app revenue comes from freemium apps
iOS vs. Android: Revenue comparison
One of the most significant decisions for app developers is platform prioritization. While Android dominates in user numbers (approximately 70% of global smartphone users), iOS consistently outperforms in monetization metrics.
| Metric | iOS (App Store) | Android (Google Play) |
| Global Revenue (2025) | $275 billion | $225 billion |
| Market Share (Users) | ~30% | ~70% |
| Market Share (Revenue) | ~55% | ~45% |
| Average ARPU (Annual) | $138 | $72 |
| D60 Revenue Per Install | $0.38 | $0.14 |
| Gaming Revenue | $90 billion | $80 billion |
| Subscription Revenue Share | 73% | 27% |
| Consumer Spending (2025) | 68% | 32% |
Key insight: iOS generates nearly double the revenue per user despite having less than half the user base. For monetization-focused apps, iOS should typically be the priority platform.
Understanding VAT and taxes
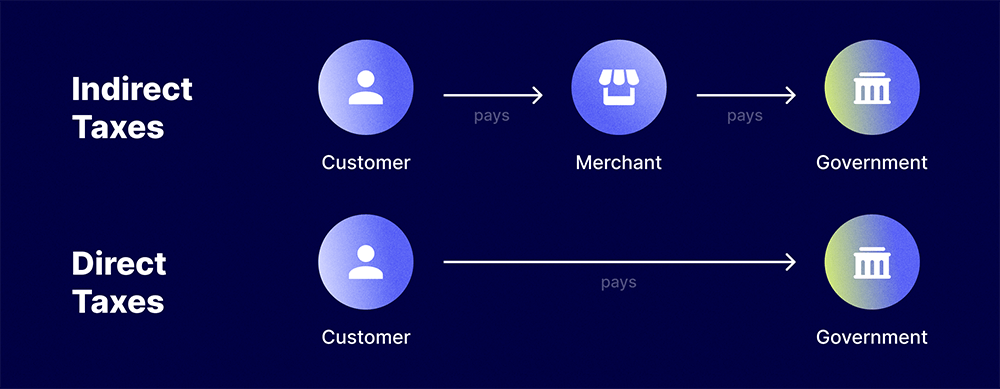
Value Added Tax (VAT) is a consumption tax applied based on the user’s location. When a customer makes a purchase, the price they see already includes VAT. The App Store deducts this amount before calculating the developer’s proceeds.
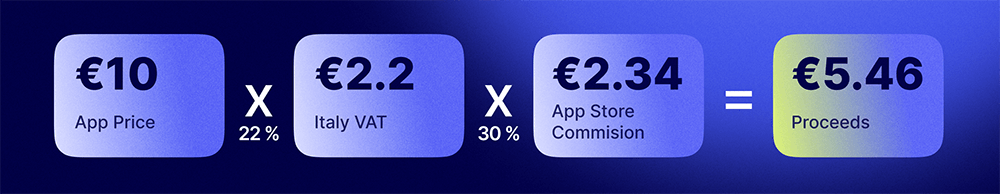
Example: A user in Italy purchases an app for €10. With Italy’s 22% VAT rate, €2.20 is VAT. The developer’s net revenue is €7.80, from which the App Store takes its commission (let’s assume 30%), leaving final proceeds of €5.46.
Who collects VAT?
Good news: Apple’s App Store and Google Play handle VAT collection and remittance on your behalf for in-app purchases. They automatically add VAT based on customer location, collect payments, and send taxes to relevant authorities. Your proceeds already have taxes deducted.
However, if you use web payments or external billing (increasingly common after the 2025 Epic ruling), you become responsible for VAT collection and remittance. Services like Paddle, Stripe Tax, or specialized merchant-of-record services can automate this complexity.
Other taxes app developers pay
Income tax: Levied on your net profits (after App Store commissions and VAT). Using our Italian example, income tax applies to the €5.46 proceeds, not the original €10. Rates vary by country and business structure.
Sales tax: In some jurisdictions, particularly US states, sales tax may apply to digital goods. App stores typically handle this, but verify requirements in your operating regions.
Pro tip: Many jurisdictions offer startup or innovative company status with reduced tax rates. Investigate options in your country of operation—potential savings can be substantial.
App Store commissions in 2026
The commission landscape has changed dramatically. Understanding current fee structures is essential for accurate financial planning.
Epic Games Ruling: A game-changer
In April 2025, a landmark ruling in the Epic Games v. Apple case fundamentally changed the US app economy. Key outcomes:
- External Payment Links: US apps can now include links to external payment methods with ZERO Apple commission
- No More “Scare Screens”: Apple removed intimidating warnings when users click external payment links
- Web Payments: Developers can redirect users to websites and pay only processor fees (typically 2-5%)
- Ongoing Appeals: December 2025 appeals court indicated Apple may charge a “reasonable” fee in future (amount TBD)
Current commission structure
| Scenario | Apple (US) | Apple (EU) | Google Play | Web payment |
| Standard rate | 30% | 30%* | 30% | 2-5% |
| Small business (<$1M) | 15% | 10-15%* | 15% | 2-5% |
| Subscription (Year 2+) | 15% | 10-15%* | 15% | 2-5% |
| External Link (US) | 0% | N/A | N/A | 2-5% |
| Web2App (pre-install) | N/A | 0% | N/A | 2-5% |
*EU fees under DMA compliance include complex tiered system: 5% Core Technology Commission (from Jan 2026) + store service fees (5-13%) + potential acquisition fees (2%). Review Apple’s official DMA documentation for your specific situation.
Small business programs
Apple App Store Small Business Program: Developers earning less than $1 million in annual proceeds qualify for a reduced 15% commission. The threshold is calculated across all associated developer accounts. In the EU, eligible developers can receive a further reduced rate of 10%.
Google Play Small Business Program: Since July 2021, developers pay 15% on the first $1 million in annual revenue. Above this threshold, the standard 30% rate applies to additional revenue.
Web2App: fee-reduction atrategy
Web2App has emerged as one of the most powerful strategies for reducing platform fees. The concept is straightforward: acquire users through web funnels, collect payment on your website (at 2-5% processor fees), then direct users to download your app.
How web2app works
- Step 1: Drive traffic to a web landing page (via social ads, search, influencers)
- Step 2: Engage users with a personalized quiz or onboarding flow
- Step 3: Present paywall and collect payment via web checkout (Stripe, Paddle, etc.)
- Step 4: Direct paid users to download the app via deep link
- Step 5: Sync subscription status between web and app
| Payment method | Commission | $100 revenue | Developer gets |
| App Store IAP (Standard) | 30% | $100 | $70 |
| App Store IAP (Small Biz) | 15% | $100 | $85 |
| Web payment (Stripe) | 2.9% + $0.30 | $100 | $96.80 |
| Web payment (Paddle MoR) | 5% | $100 | $95 |
| Savings vs Standard IAP | — | — | +$25-27 per $100 |
Note: In the EU, Web2App transactions completed before app install incur 0% Apple fees under current DMA interpretation.
Revenue by app category
Not all app categories are created equal when it comes to revenue potential. Understanding category benchmarks helps set realistic expectations and identify opportunities.
| Category | Revenue in 2025 | % of Total | Avg RPD | YoY Growth |
| Gaming | $150B | ~50% | $0.10-1.50 | +5% |
| Social Media | $30B | ~10% | $0.80-2.00 | +7% |
| Entertainment/Streaming | $25B | ~8% | $1.50-4.00 | +12% |
| Health & Fitness | $15B | ~5% | $2.00-5.00 | +31% |
| E-commerce | $60B+ | ~20% | $15-24 | +15% |
| Education | $8B | ~3% | $1.00-3.00 | +18% |
| AI Apps | $8.5B | ~3% | $3.00-8.00 | +136% |
| Productivity | $6B | ~2% | $2.00-4.00 | +21% |
RPD = Revenue Per Download. AI apps represent the fastest-growing category, while gaming remains the largest by total revenue.
Pricing strategies and monetization models
Choosing the right monetization model is critical. The balance between user acquisition and revenue generation requires careful consideration of your app type, target audience, and competitive landscape.
Monetization models comparison
Freemium
- Free download with paid premium features
- Attracts large user base for potential conversion
- Typical conversion rate: 2-5% of users purchase
Subscription
- Recurring revenue (monthly/annual)
- Subscription revenue reached $66.8 billion in 2024
- Accounts for 30%+ of global app revenue
- Annual plans reduce churn by 51% vs monthly
In-app advertising
- Projected to reach $390+ billion globally in 2025-2026
- Accounts for ~65% of total app revenue
- Rewarded video: 91% completion rate, highest engagement
- Banner ads: ~$2 CPM; Video ads: $8+ CPM
Paid apps
- One-time purchase to download
- Generated only $6 billion globally in 2024
- Most users prefer “try before buy” via freemium
Regional app revenue breakdown
| Region | Revenue in 2025 | YoY Growth | Key markets |
| Asia-Pacific | $110B+ | +12% | China (60%), Japan ($40B+), India |
| North America | $90B | +8% | USA ($86B projected 2026), Canada |
| Europe | $70B | +10% | Germany, UK, France |
| Latin America | $20B | +25% | Brazil, Mexico |
| India | $15B | +40% | Fastest growing major market |
| Middle East & Africa | $10B | +45% | UAE, Saudi Arabia, Nigeria |
Tracking revenue with Adapty
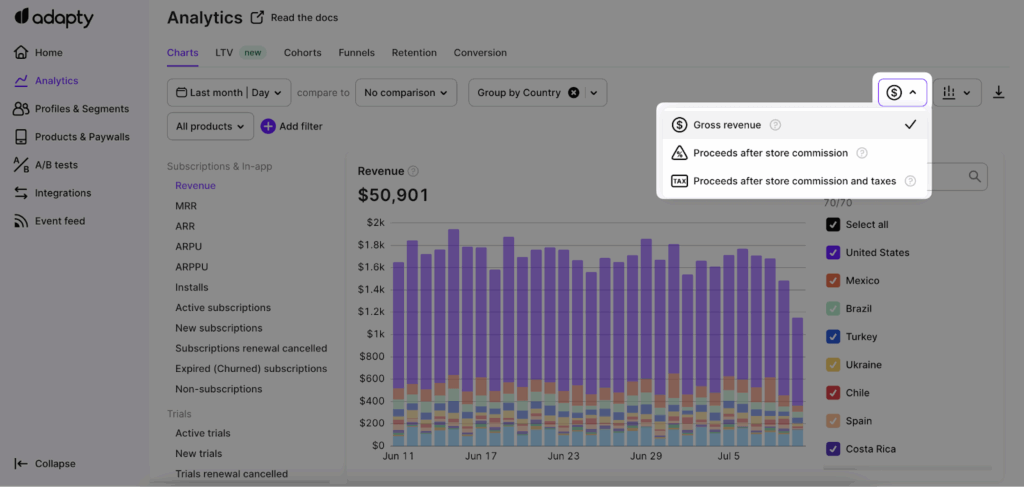
Revenue as a single metric can be misleading. Understanding what you actually receive requires viewing data in multiple formats. That’s why Adapty allows you to check revenue in three ways:
- Gross Revenue: Total earnings before any deductions
- Proceeds after Store Commission: Revenue minus App Store/Google Play fees
- Proceeds after Commission and Taxes: Your actual net income
This three-way view applies to all revenue-related metrics: Revenue, MRR, ARR, ARPU, and ARPPU. Cohorts and LTV tabs also support commission/tax-adjusted views. Adapty’s subscription analytics provide the clarity needed for accurate financial planning.
Tips for maximizing app earnings in 2026
1. Leverage the new commission landscape
- Consider external payment links for US users (post-Epic ruling)
- Evaluate Web2App funnels to reduce platform fees by 25%+
- Ensure you’re enrolled in Small Business Programs if eligible
2. Optimize subscription strategy
- Focus on annual plans (51% lower churn than monthly)
- Retain subscribers past 12 months to benefit from reduced 15% commission
- Use A/B testing on paywalls (apps doing ongoing tests see significantly higher revenue)
3. Implement localized pricing
- Prices vary dramatically by region (Netherlands 62% higher than US; Turkey 3.5x cheaper)
- Optimize pricing per market based on purchasing power
- Use tools like Adapty to test and optimize regional pricing
4. Improve quality and user experience
- Maintain 4+ star ratings (low ratings deter new users)
- Day 1 retention average is 24%, dropping to 5.8% by Day 30—focus on early UX
- Regular updates signal active development and improve retention
5. Integrate AI features
- 63% of mobile app developers now integrate AI features
- AI apps grew 136% YoY—users increasingly willing to pay for AI-powered features
- Consider AI for personalization, recommendations, and automation
Conclusion: Building a profitable app in 2026
The mobile app market in 2026 presents unprecedented opportunities alongside evolving challenges. With global revenue exceeding $600 billion and continuing to grow at 7-8% annually, the potential for profitable app businesses has never been greater.
Understanding the intricacies of app earnings—including revenue, proceeds, VAT, commissions, and the dramatic changes from the Epic Games ruling—is essential for any developer seeking to maximize income and ensure business sustainability. The difference between standard 30% App Store commission and 2-5% web payment fees can transform your unit economics.
Key takeaways for 2026:
- Leverage new payment options: External payment links (US) and Web2App (EU) can save 25%+ on every transaction
- Prioritize iOS for monetization: iOS users spend nearly double what Android users spend
- Focus on subscriptions: The fastest-growing model with predictable revenue and reduced churn
- Integrate AI features: AI apps are growing 136% YoY—users will pay for AI-powered value
- Test continuously: A/B testing paywalls, pricing, and features drives significant revenue improvements
Adapty provides the tools needed for subscription analytics, paywall optimization, and revenue tracking that makes accurate financial planning possible. With insights into gross revenue, proceeds after commission, and net proceeds after taxes, you can make informed decisions about pricing, marketing, and development.
The apps that succeed in 2026 will be those that understand not just how much apps make—but how to systematically make more through smart monetization, fee optimization, and continuous improvement.