Calculating return on ad spend (ROAS) metrics
When it comes to acquiring new users for mobile apps, few channels work as well as advertising. Ads remain one of the top app discovery methods, and because advertising is so effective at growing an app's user base, it takes up a significant share of the marketing budget. Knowing what returns you're getting for your ad spend is essential—especially as costs continue to rise and privacy changes reshape how we measure performance.
Enter ROAS. Return on ad spend tells you exactly what returns you make for every dollar you spend on ads. Analyzing ROAS shows you how to optimize your ad spend for higher returns. For example, if your Google Ads ROAS is higher than your Meta Ads ROAS, you may want to allocate more budget to Google campaigns. Likewise, comparing ROAS across different campaigns reveals your most profitable ones.
But here's what's changed: measuring ROAS in 2025 isn't as straightforward as it used to be. With iOS privacy changes, SKAdNetwork limitations, and rising CPMs, you need a more sophisticated approach. This guide covers everything from basic ROAS calculation to advanced predictive analytics and platform-specific benchmarks.
What is ROAS?
ROAS—short for return on ad spend—is an advertising metric that shows you how much revenue you generate from your ad campaigns. Simply put, ROAS calculates how many dollars you earn for every dollar you spend on advertising.
Unlike broader metrics like ROI, ROAS focuses specifically on advertising performance, making it the primary KPI for user acquisition teams.
How to Calculate Return on Ad Spend (ROAS)?
To calculate ROAS for an ad campaign, you need two data points.
Your conversion value: This is the total revenue generated from an ad campaign. If you ran a campaign for your subscription app and acquired 500 users who each started a $10/month subscription, your immediate revenue is $5,000. For subscription apps, you'll also want to factor in expected renewals.
Your ad spend: This is the amount you spent running your campaign. You can calculate this two ways: consider only the direct ad budget, or factor in all expenses including creative production, contractor payments, tool subscriptions, and overhead. For cleaner campaign-level analysis, most teams use direct ad spend.
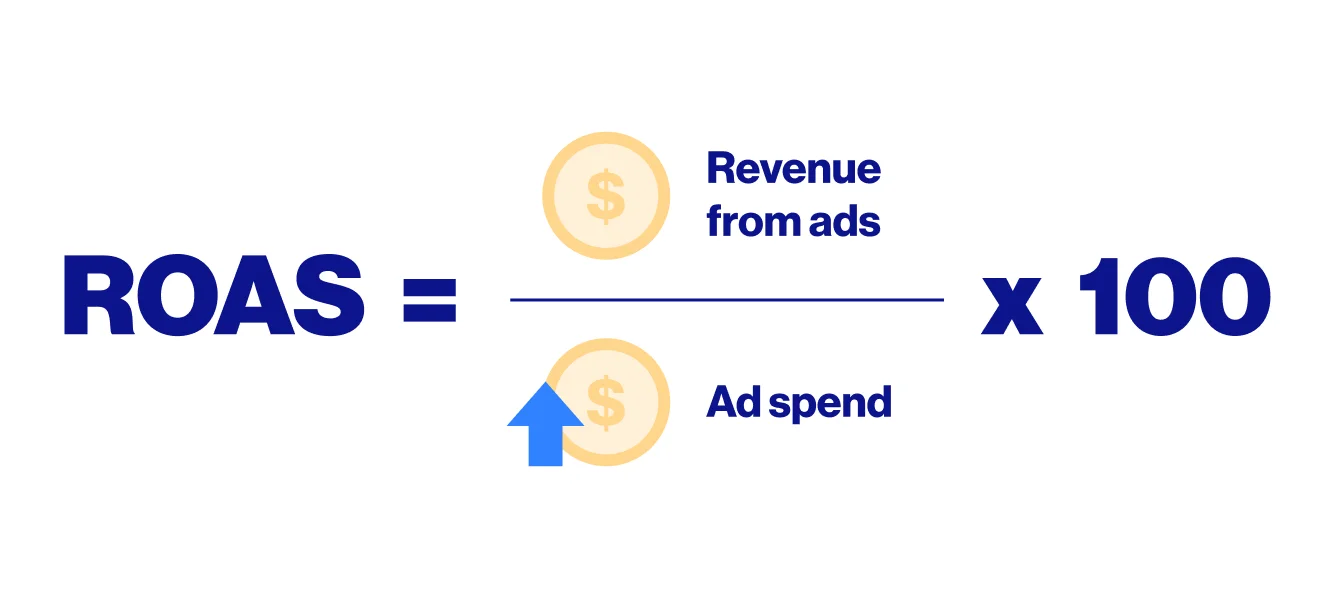
ROAS Formula
ROAS = Revenue from ads / Cost of ads
If you spent $1,000 on a campaign that generated $5,000 in revenue, your ROAS is:
$5,000 / $1,000 = 5:1
You can express ROAS as a ratio (5:1), a multiplier (5x), a percentage (500%), or simply as a number (5).
What's a Good ROAS for Mobile Apps in 2026?
The traditional rule of thumb says 4:1 ROAS is "good." But here's the reality: according to 2024-2025 industry data, the median ROAS for mobile apps is actually 2.04. That means half of all apps operate below a 2:1 ratio.
Why the gap between expectations and reality? Rising CPMs, increased competition, and privacy-driven attribution challenges have made the 4:1 target increasingly difficult to achieve. Meta's CPMs hit $10.88 in Q1 2025—up 19.2% from the previous year.
| Platform | Average ROAS | Best performers | Notes |
| Google Ads | 3.31x – 4.5x | Search: 5.17x | High-intent users drive strong returns |
| Meta (Facebook/Instagram) | 2.19x – 2.98x | Instagram: up to 8.83x | Visual products perform best |
| TikTok Ads | 1.41x | Varies widely | Discovery-focused, younger audience |
| Apple Search Ads | Category-dependent | Brand campaigns highest | 67.2% conversion rate |
ROAS Expectations by App Category
Different app categories have fundamentally different ROAS profiles based on their monetization models:
| App category | Typical D7 ROAS | Typical D30 ROAS | Notes |
| Subscription Apps | 0.3x – 0.5x | 1.0x – 2.0x | Long payback period, high LTV |
| Gaming (Casual) | 0.8x – 1.2x | 1.5x – 3.0x | Faster monetization through IAP |
| Gaming (Hypercasual) | 1.0x – 1.5x | 1.5x – 2.5x | Ad-based revenue, quick payback |
| E-commerce | 1.5x – 3.0x | 2.0x – 4.0x | Transaction-based, immediate revenue |
| Fintech | 0.2x – 0.5x | 1.0x – 3.0x | High LTV but slow initial monetization |
| Health & Fitness | 0.3x – 0.6x | 1.2x – 2.5x | Subscription-based model |
The key insight: a "good" ROAS depends entirely on your business model. A subscription app with 0.5x D7 ROAS might be performing excellently if users have strong retention and high lifetime value. An e-commerce app with the same D7 ROAS would be in trouble.
Break-Even ROAS: When Are You Actually Profitable?
Hitting break-even means you're not making profit or loss on your ad campaigns. Everything beyond break-even is profit—which is why break-even analysis is essential.
You might think a 1:1 ROAS means you're breaking even. You spend $1,000, you make $1,000 in revenue—no loss, right?
Wrong.
To find your true break-even ROAS, you must factor in your profit margin.
How to Calculate Break-Even ROAS
Let's say you sell a subscription for $10/month, and it costs $5 to service each user (server costs, support, payment processing). Your profit per user is $5, making your profit margin 50%.
Break-even ROAS = 1 / Profit Margin
In this case: 1 / 0.50 = 2.0
You need a ROAS of 2:1 just to break even.
| Profit margin | Break-even ROAS | Typical business type |
| 20% | 5.0x | Physical products, high COGS |
| 25% | 4.0x | E-commerce with fulfillment |
| 33% | 3.0x | Scaled digital operations |
| 50% | 2.0x | Digital products, SaaS |
| 60% | 1.67x | High-margin digital goods |
| 75% | 1.33x | Software, subscriptions |
| 80% | 1.25x | Pure digital, minimal COGS |
For subscription apps with high margins (often 70-80%), breaking even at 1.3x-1.5x ROAS is realistic. This is why subscription businesses can afford higher customer acquisition costs.
ROAS in Apple Search Ads
Apple Search Ads deserves special attention for iOS app marketers. With the App Store driving the majority of app downloads and ROAS becoming the north star metric for Apple Ads in 2025, understanding these benchmarks is crucial.
Apple Search Ads Performance Metrics
| Metric | 2024 average | Change from 2023 |
| Tap-Through Rate (TTR) | 11.4% | Up from 10.22% |
| Conversion Rate (CR) | 67.2% | Up from 65.37% |
| Cost Per Tap (CPT) | $2.50 | Up from $1.59 |
| Cost Per Acquisition (CPA) | $2.90 | Up from $2.58 |
The good news: nearly 7 in 10 users who tap on an Apple Search Ad proceed with an install. The challenge: costs have risen significantly, with CPT up 57% year-over-year.
Apple Search Ads Costs by Category
| Category | CPT (2024) | CPA (2024) | ROAS Potential |
| Sports | $10.20 | $14.10 | High LTV offsets cost |
| Finance | $6.40 | $12.70 | Strong user value |
| Games | $1.00 – $1.20 | $2.00 | Volume opportunity |
| Productivity | Low | Stable | Efficient acquisition |
| Entertainment | Moderate | Moderate | High TTR (15.2%) |
| Reference | Low | Low | Highest TTR (19.7%) |
Campaign Structure for ROAS Optimization
The best Apple Search Ads accounts structure campaigns by intent:
- Brand Defense: Lowest CPI, highest ROAS. Essential for protecting your brand terms.
- Category/Generic Keywords: Your scale engine. Where most testing occurs.
- Competitor Conquesting: Higher CPI but captures market share. Evaluate against ROAS thresholds.
- Discovery (Broad Match): Variable performance. Great for mining new keywords.
Regional ROAS Opportunities
Latin America emerged as a high-opportunity region in 2024:
| Region | CPT range | CPA range | Notes |
| Brazil | $0.40 – $0.60 | $0.50 – $0.80 | Highest TTR globally |
| Mexico | Similar | Second-lowest CPA | Strong engagement |
| US | Highest | Highest | Best absolute ROAS potential |
For apps expanding internationally, LATAM offers 3-4x lower acquisition costs with strong user engagement.
Custom Product Pages (CPPs)
Custom Product Pages are becoming a key driver of ROAS improvements in 2025. By tailoring creatives to keyword or audience intent:
- Conversion rates improve significantly
- CPI can drop by $3-6
- CVR can reach 17%+ for well-optimized pages
Apple's recent updates allow CPPs to appear in relevant organic search results too, amplifying their value.
Measuring ROAS in a Privacy-First World
If you're running iOS campaigns, you're navigating SKAdNetwork (SKAN)—Apple's privacy-preserving attribution framework. Understanding how this affects ROAS measurement is now essential.
| Attribution method | ROAS accuracy | Data timing | User coverage |
| IDFA (with ATT consent) | High, deterministic | Real-time | 15-30% of users |
| SKAdNetwork 4.0 | Aggregated | 24-72 hour delay | All iOS users |
| Meta AEM | Modeled | Near real-time | Meta ecosystem only |
| Probabilistic/Fingerprinting | Declining accuracy | Real-time | Being phased out |
With only 15-30% of users opting into tracking through App Tracking Transparency (ATT), deterministic IDFA-based attribution is limited. SKAN has become the primary measurement framework for iOS.
SKAdNetwork 4.0: What You Need to Know
SKAN 4.0 provides aggregated attribution data without compromising user privacy:
- Three Postbacks: Spread across different time windows (Days 0-2, Days 3-7, Days 8-35)
- Crowd Anonymity Tiers: Replace privacy thresholds, determining how much data you receive
- Source Identifier: Up to 4 digits (expanded from 2-digit campaign IDs)
- Web-to-App Attribution: Now supported for Safari
The ROAS measurement challenge: Absolute ROAS calculation is no longer realistic with SKAN. Total revenue reported will always appear lower than reality because not all conversions are captured.
The solution: Focus on ROAS trends rather than absolute values. Is your ROAS improving or declining for this channel? How does campaign ROAS compare to your overall revenue trends?
AdAttributionKit: The Future
At WWDC 2024, Apple announced AdAttributionKit (AAK) as the successor to SKAdNetwork. Key additions include:
- Re-engagement tracking (up to 35 days)
- Support for alternative app stores
- Different creative type tracking
As of 2025, SKAN 4.0 remains the operational standard, but AAK points to the future of privacy-friendly attribution.
Beyond Immediate ROAS: Predictive Analytics
Here's a critical limitation of traditional ROAS: it's a backward-looking metric. By the time you have accurate D30 or D90 ROAS data, you've already spent your budget.
This is where predictive analytics transforms campaign optimization.
Predictive LTV (pLTV)
Predictive Lifetime Value estimates the total revenue a user will generate based on early signals—often within just 1-2 days of install.
Why pLTV matters:
- Extended Payback Periods: Rising acquisition costs mean longer time to recoup ad spend
- Gradual Revenue Realization: Subscription apps generate revenue slowly over time
- Privacy Limitations: SKAN restricts long-term measurement, making prediction essential
pLTV Methods Compared
| Method | Best for | Accuracy | Implementation complexity |
| Cohort-based | Broad trend analysis | Moderate | Low |
| Retention Curves | Session-revenue correlation | Good | Medium |
| Machine Learning | Complex monetization, personalized predictions | High (90%+) | High |
Predictive ROAS (pROAS)
pROAS applies predictive models to forecast future campaign returns:
- Speed: Make optimization decisions within 24-48 hours vs. waiting 30+ days
- Precision: Target high-LTV users before they demonstrate value
- Efficiency: Pause underperforming campaigns early, saving budget
Real-world impact: Companies using pLTV-driven optimization report:
- 30% increase in ROAS by focusing on predicted high-value users
- 17% budget savings by pausing underperforming campaigns early
- 68% lower cost per incremental install
Implementation Considerations
Before implementing pLTV
- Data Requirements: Typically need 3-6 months of user data or ~5,000 active users
- MMP Integration: Attribution data significantly enhances prediction accuracy
- Model Maintenance: Predictions require ongoing validation and tuning
For subscription apps especially, the gap between D7 behavior and actual LTV makes predictive analytics essential for sustainable growth.
Choosing the Right ROAS Measurement Window
Different measurement windows tell different stories. Choosing the wrong one leads to bad decisions.
| Window | Best for | Advantages | Limitations |
| D1 ROAS | Quick kill decisions | Fastest feedback | Misleading for subscriptions |
| D7 ROAS | Gaming, IAP-heavy apps | Industry standard | Misses late converters |
| D14 ROAS | Subscription apps | Captures trial conversions | Still incomplete picture |
| D30 ROAS | Full funnel analysis | More accurate LTV proxy | Slow feedback loop |
| D90 ROAS | Strategic planning | Best accuracy | Too slow for daily optimization |
Recommendation: Use D7 ROAS for campaign optimization decisions, D30 for strategic budget allocation, and pROAS for early signals within the first 48 hours.
ROAS vs. Similar Metrics
Several metrics seem like ROAS but serve different purposes. Understanding the distinctions helps you build a complete measurement framework.
ROAS vs. ROI
ROAS is an advertising-specific metric showing returns on ad spend. ROI is broader, measuring overall profitability of an investment including all costs and overhead. Use ROAS for campaign-level decisions; use ROI for business-level strategy.
ROAS vs. MER (Marketing Efficiency Ratio)
MER = Total Revenue / Total Marketing Spend
As attribution becomes harder, MER is gaining popularity. It provides a holistic view across all channels, including organic, without requiring precise attribution. Use ROAS for channel optimization; use MER for overall marketing efficiency.
ROAS vs. CTR
Click-through rate measures how compelling your ad creative is. A high CTR with low ROAS indicates your ad resonates but your landing page, pricing, or product doesn't convert. These metrics work together in diagnosis.
ROAS vs. CAC
Customer Acquisition Cost accounts for all expenses in acquiring a user. ROAS measures revenue returned from ad spend. For complete analysis, calculate both: CAC tells you cost efficiency; ROAS tells you revenue efficiency.
ROAS vs. LTV
ROAS is short-term; LTV captures long-term value. For sustainable growth, your LTV:CAC ratio should be 3:1 or higher. Use ROAS for campaign optimization; use LTV:CAC for strategic budget allocation.
ROAS vs. ACOS
Advertising Cost of Sale (common on Amazon) is essentially the inverse of ROAS. High ACOS means advertising costs outweigh revenue; high ROAS means the opposite. If your ROAS is 4:1, your ACOS is 25%.
Five Ways to Improve ROAS
1. Optimize Campaign Structure
Structure campaigns around user intent for better ROAS:
- Brand campaigns: Protect your terms with exact match. Highest ROAS.
- Category campaigns: Capture users searching for solutions. Scale engine.
- Competitor campaigns: Higher cost but captures market share. Set strict ROAS thresholds.
- Discovery campaigns: Broad match for keyword mining. Variable ROAS.
Allocate budgets to brand protection first, then expand into category keywords with strict match types.
2. Implement Custom Product Pages
Tailored landing experiences dramatically improve conversion:
- Match creative messaging to keyword intent
- Test different value propositions by audience segment
- Use A/B testing to optimize continuously
Apps with aligned messaging see 34% lower CPI than those with generic pages.
3. Leverage Predictive Analytics
Don't wait for complete data:
- Implement pLTV modeling to identify high-value users early
- Use pROAS for 24-48 hour campaign decisions
- Feed predicted values to ad networks for optimized targeting
Custom Event Optimization with pLTV signals consistently outperforms standard optimization.
4. Expand Geographically
Different regions offer dramatically different ROAS:
- CPI differences between regions can exceed 300%
- Emerging markets (LATAM, parts of APAC) offer lower costs
- Test new markets with dedicated campaigns and localized CPPs
Don't optimize globally—segment by region and optimize individually.
5. Test Creative Relentlessly
Creative quality directly impacts ROAS:
- Emotionally resonant narratives (failure-to-success arcs) drive +78% higher install rates
- Test hooks, storylines, and visual styles systematically
- Higher IPM often correlates with better D7 ROAS
Rotate one new creative per week minimum; track performance by creative variant.
Tying ROAS to Long-Term Impact
ROAS analysis doesn't end with calculating your immediate returns. Because, by its nature, ROAS is a short-term metric.
Consider this scenario: You run an Apple Search Ads campaign during holiday marketing and hit break-even. On the surface, the campaign is acceptable. But what if most users acquired through that campaign churned after the first subscription term? You broke even on paper, but projected lifetime revenue never materialized.
Alternatively, if those same users demonstrated strong retention and high CLV, the campaign was far more successful than break-even suggests.
This is why connecting ROAS to lifetime value is essential.
With Adapty, you can see how your advertising campaigns perform not just in the short term but over the entire user lifecycle. Use Adapty's LTV reporting filtered by attribution source to understand:
- Which channels acquire the highest-value users
- How cohort LTV develops over time by acquisition source
- Where to allocate budget for maximum long-term returns
Adapty's Apple Ads Manager integration provides keyword-level ROAS tracking without requiring a separate MMP, giving you direct visibility into which search terms drive profitable users.
Wrapping Up
If you use advertising to grow your mobile app, ROAS analysis is central to maximizing your returns. But in 2026, effective ROAS management requires:
- Understanding platform-specific benchmarks rather than applying universal rules
- Accounting for privacy limitations with SKAN and emerging frameworks
- Using predictive analytics to make faster, smarter decisions
- Connecting short-term ROAS to long-term LTV for sustainable growth
- Optimizing by region, campaign type, and creative rather than at aggregate level
The median mobile app ROAS of 2.04 means there's significant room for improvement across the industry. Apps that master these techniques gain meaningful competitive advantage.
Start by analyzing your advertising channels for their ROAS metrics. Follow up with granular analysis at the campaign, keyword, and creative level. And remember: while ROAS tells you immediate returns, long-term success requires understanding the lifetime value of users you acquire.
Consider adding Adapty to your mobile app analytics stack. With Adapty, tying short-term metrics like ROAS to long-term metrics like CLV becomes straightforward—and actionable.