Understanding refund rate benchmarking
From automatic renewals that users meant to cancel to accidental purchases and unauthorized transactions, refund requests are an unavoidable part of the mobile app business. In 2026, with the in-app purchase market on track to reach $170 billion and subscription models dominating app monetization, managing refunds has become more important than ever. Refunds don't just mean lost revenue. They affect your MRR, distort LTV calculations, and can even lead to your app being removed from the store if the rate gets too high. But refund requests also carry actionable insights. By analyzing why users ask for their money back, you can fix onboarding gaps, adjust pricing, and deliver value faster, all of which improve retention and reduce future refunds.
A user-friendly refund policy also helps grow your customer base. Many users feel more comfortable subscribing when they know they can get a refund if the app does not meet their expectations. Handling refunds gracefully also helps you avoid negative reviews that often follow rejected refund requests. So how do you handle refunds better so both you and your users benefit? In this guide, you will learn everything you need to know about mobile app refund rates in 2026, including:
- What the average mobile app refund rate is and why you must track it
- How to calculate your app's refund rate (with formula)
- Refund rate benchmarks by app category, region, and subscription duration
- How the App Store and Google Play handle refunds and commissions
- Common reasons for refund requests and proven strategies to reduce them
- How to automate refund recovery and protect your revenue
What is a mobile app's refund rate?
Both Google Play and the App Store allow users to request refunds for app purchases, in-app purchases, and subscription payments. When users submit refund requests, each app store evaluates them on a case-by-case basis. For example, Google Play offers a 48-hour automatic refund window for most purchases, and users can request refunds within two hours of purchase with near-guaranteed approval. On iOS, Apple reviews each request individually through its Report a Problem portal. Partial refunds may also be granted depending on the jurisdiction and type of purchase. Consumable in-app purchases are generally not refundable. Simply put, a mobile app's refund rate is the percentage of paid transactions that get refunded within a given period.
How to calculate your mobile app's refund rate
To calculate your mobile app's refund rate, divide the number of refunded transactions by the total number of paid transactions:
Refund rate = (refunded transactions / total paid transactions) × 100
For example, if your app processed 1,000 in-app purchases in a month and 50 of them were refunded, your refund rate would be: (50 / 1,000) × 100 = 5% When calculating refund rates, it is important to apply cohort analysis. Refunds should be attributed to the period when the original transaction occurred, not when the refund was processed.
This is the method used by analytics platforms like Adapty and RevenueCat, and it gives you a more accurate picture of how each cohort of subscribers actually performed. You should also allow enough time for refunds to come in before assessing a cohort. For monthly subscriptions, waiting at least 30 to 45 days after the billing period gives a more complete view. For annual plans, where users can request refunds months after purchase, the lag can be even longer.
Why it is important to monitor your refund rate
Tracking your refund rate is not just about counting losses. It provides strategic insights across multiple dimensions of your app business:
Improving your marketing message: If you offer a paid app or a subscription with a hard paywall and observe a high refund rate, it may indicate a mismatch between your app's marketing and the actual user experience. Investigating refund patterns can reveal whether users are getting what they expected when they downloaded your app.
Improving your conversion rate: If you offer a free trial that automatically converts to a paid plan, a high refund rate might suggest users did not take advantage of the trial period or didn't understand the billing terms. Combining behavioral analytics with refund data can help you identify which user segments need better onboarding.
Identifying usability issues: A sudden spike in refund requests after an app update often signals a technical problem. Monitoring refund trends alongside release cycles helps you catch and fix issues quickly.
Protecting your app store standing: Apple and Google track refund rates as part of their quality metrics. Apps with refund rates consistently above 10% may face warnings, and those exceeding 30% can be removed from the store entirely.
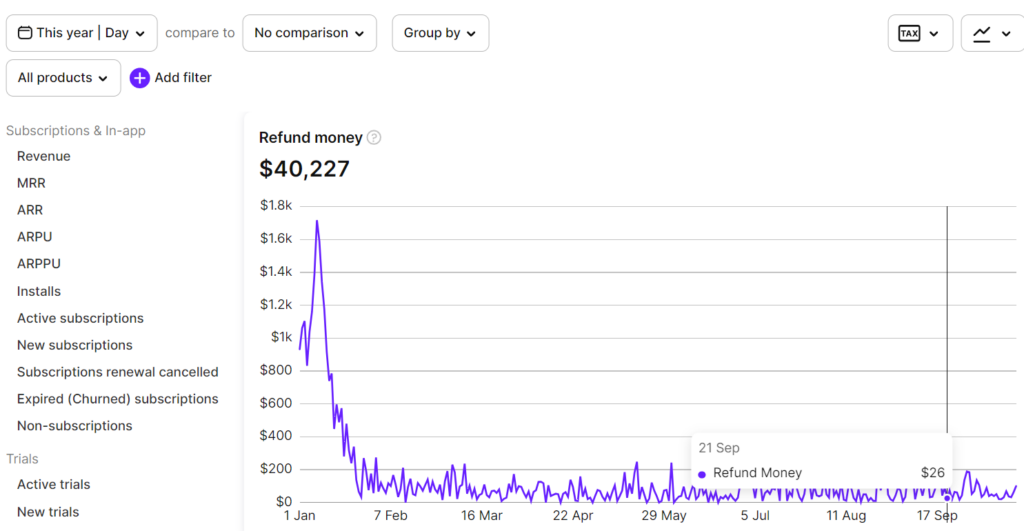
Improving LTV accuracy: Many developers forget to factor refunds into their lifetime value (LTV) calculations. According to industry analysis, failing to account for a 3-5% refund rate can significantly overstate the ROI of acquisition campaigns and pricing experiments. Both app stores offer basic refund reporting. But for deeper insights into your refund rate metric, use an in-app subscription management and revenue analytics solution like Adapty. With Adapty, you don't have to manually measure your refund rate. Adapty's built-in refund tracking shows refund data segmented by day, subscription plan, product, acquisition channel, and more.
Refund rate benchmarks for mobile apps in 2026
Understanding how your refund rate compares to industry benchmarks is essential for setting realistic targets and identifying problems early.
Overall benchmark
Based on data from Adapty's analysis of $1.9 billion in revenue across 11,000+ apps and RevenueCat's State of Subscription Apps report covering 75,000+ apps, the typical mobile app refund rate falls between 2% and 5% of paid transactions. For subscription apps specifically, 2-5% of payers will request a refund.
Refund rate by app category
Refund rates vary significantly across app categories. Apps in aspirational categories like education and fitness tend to see higher refund rates due to buyer's remorse, while apps with higher purchase intent, such as travel or business, see lower rates.
| App category | Average refund rate | Notes |
| Education | 4.86 – 5.1% | Highest category — aspirational purchases drive buyer's remorse |
| Health and fitness | 4.71% | Motivation-driven subscriptions with high early churn |
| Lifestyle | 3.0 – 4.0% | Varies widely by sub-category |
| Productivity | 2.5 – 3.5% | Users generally understand value proposition before subscribing |
| Gaming | 2.67% | Lower than average — clear value proposition |
| Business | 2.88% | Professional users with clear purchase intent |
| Shopping | 1.5 – 2.5% | Among the lowest — necessity-driven purchases |
| Travel | 1.51% | Lowest category — high purchase intent and necessity |
Refund rate by subscription duration
The length of the subscription commitment also affects refund rates. Longer commitments come with higher expectations and more time for dissatisfaction to build.
| Subscription duration | Average refund rate | Key insight |
| Weekly | 2.6% | Lowest risk commitment — users feel safe trying |
| Monthly | 3.0 – 3.5% | Moderate — higher than weekly across all regions |
| Annual | 4.2% | Highest — longer commitment raises expectations |
Source: Adapty State of in-app subscriptions
Refund rate by region
Geographic location significantly impacts refund behavior due to differences in consumer expectations, payment infrastructure, and local regulations.
| Region | Refund rate range | Notes |
| LATAM | Above 3% | Leads in refund volume |
| United States | Above 3% | High volume — large market with active refund culture |
| Asia-Pacific | Below 3% | Lower rates — stronger subscription trust |
| Western Europe | Below 3% | Better subscription transparency and payment infrastructure |
| MEA | ~2.3% | Lowest rates globally |
| South Korea | Up to 10% | Highest single-country rate — strong consumer protection culture |
Source: Adapty State of in-app subscriptions, Business of Apps
Refund rate by paywall type
How users access your subscription significantly affects refund rates. Hard paywalls, which require payment before users can use the app, show notably higher refund rates than freemium models.
| Access model | Average refund rate | Recommendation |
| Hard paywall | 5.8% | Enhanced onboarding and clear value communication are critical |
| Freemium | 3.4% | Users have already experienced value before paying |
Refund rate by pricing tier
Pricing also plays a role. Low-priced plans see the fewest refunds because users feel less financial risk, while mid-priced plans tend to underperform on both refund rates and retention.
| Pricing tier | Refund rate |
| Low-priced plans | ~2.2% |
| Mid-priced plans | Highest refund rate |
| High-priced plans | Lower than mid-tier |
Source: Adapty State of in-app subscriptions
Refund rate score ratings
Use the following scale to evaluate how your app's refund rate compares to healthy benchmarks:
| Refund rate | Rating | Action needed |
| 0 – 2% | Excellent | High customer satisfaction — maintain current approach |
| 2 – 5% | Normal | Within industry average — optimize onboarding and value delivery |
| 5 – 10% | Concerning | Investigate pricing, paywall type, and user expectations |
| Above 10% | Critical | Risk of app store action — immediate product and messaging review needed |
How the App Store and Google Play handle refunds
Google Play refund process
With Google Play, users can request a refund through Google's help center or by contacting you directly as the developer. Google's policy states that developers are also responsible for setting and communicating their own refund policies. Key details of the Google Play refund process:
- Purchases made within 48 hours are more likely to receive approval
- Refunds requested within two hours of purchase are usually processed automatically
- Google does not typically give refunds for most purchases outside these windows
- Developers can issue refunds directly through the Google Play Console
- Google Play refunds any service fee charged for purchases that are refunded
App Store refund process
Apple handles all refund requests directly. Unlike Google Play, developers cannot issue refunds through App Store Connect. All requests must go through Apple's Report a Problem portal. Key details of the Apple refund process:
- Each request is reviewed on a case-by-case basis
- Apple does not share the specific reason for a user's refund request with developers
- Apple reverses its commission when a refund is approved — developers are not charged fees on refunded transactions
- Since 2020, Apple provides developers with server notifications when a refund is processed, allowing for real-time tracking
- Apple also introduced the Consumption API, which allows developers to provide context about a user's engagement to help Apple make better refund decisions
In both cases, neither platform tells you the exact reason for a refund request, which means it is up to you to investigate the underlying causes using analytics and user feedback.
What about platform commissions?
A common question developers ask: do Apple and Google keep their commission after a refund? The answer is no for both platforms. Apple reverses its commission on refunded purchases, and Google Play refunds any service fee associated with refunded transactions. This means the full purchase amount is returned, and you are not left paying a platform fee on revenue you didn't keep.
Common reasons for refund requests
Understanding why users request refunds is the first step toward reducing them. Based on data from Amazon Seller Central forums, app analytics platforms, and industry reports, refund requests generally fall into two categories.
Subjective reasons (50-60% of all refunds)
These include accidental purchases, "no longer needed" claims, and users who simply forgot to cancel a free trial. This category is the hardest to address because the user's dissatisfaction is not always related to your product's quality. According to data shared on Amazon Seller Central by experienced sellers, subjective refund reasons account for 50-60% of total refunds.
Product did not meet expectations (40-50% of all refunds)
These refunds stem from a gap between what the user expected and what the app delivered. This can include misleading app store descriptions, paywall designs that obscure pricing or terms, unclear trial-to-subscription transitions, and features that don't work as promised.
Proven strategies to reduce refund rates
Reducing your refund rate requires a combination of better communication, faster value delivery, and smarter pricing. Here are the strategies that work based on current industry data.
Reduce time-to-value
Most refunds happen because users don't see value quickly enough. Data shows that most refund requests occur within the first day of purchase. To counter this, design your onboarding to showcase the app's core value within the first session. Use progressive feature disclosure to keep users engaged through the critical early period.
Optimize your free trial strategy
Free trials are one of the best ways to reduce refunds by letting users experience value before paying. However, trial design matters enormously. A three-day trial sees about 26% cancellations on average, while a 30-day trial sees 51%. Test different trial lengths to find the sweet spot for your app category. Always clearly communicate when the trial ends and when billing begins. Some of the most effective paywalls now include a timeline showing users exactly when they will be charged and how to cancel.
Improve paywall transparency
Hard paywall apps see refund rates of 5.8% compared to 3.4% for freemium models. If you use a hard paywall, invest heavily in clear value communication and onboarding. Consider A/B testing different paywall designs to find the combination that converts well while keeping refund rates low.
Match pricing to perceived value
Low-priced plans have the lowest refund rates at 2.2%, while mid-priced plans see the highest. This does not mean you should always price low. Instead, ensure each pricing tier delivers clear, proportional value. Consider offering multiple plan options so users can self-select based on their commitment level. Apps offering three plans (weekly, monthly, and annual) tend to achieve the best overall LTV.
Use refund data as a diagnostic tool
Break down your refund data by acquisition channel, subscription tier, device type, and region. If users from a specific channel refund at higher rates, your messaging may be misaligned. If a particular subscription tier underperforms, users may not see the value they expected. Adapty's dashboard lets you track 18 subscription events along with user cohorts, LTV, and retention to identify these patterns.
Implement pre-cancellation flows
When a user moves to cancel, use a pre-cancellation screen to understand their reasons and offer alternatives. Options might include pausing the subscription, switching to a different plan, or offering a discount. Companies that offer a "pause subscription" option reduce cancellations by 18% on average.
Address involuntary churn on Android
Nearly 28% of cancellations on Google Play are due to billing errors rather than deliberate user decisions. Implementing aggressive dunning (payment recovery) sequences and enabling Google Play's billing grace period can recover a significant portion of this lost revenue. The billing retry state and grace period features allow up to 60 days for payment recovery.
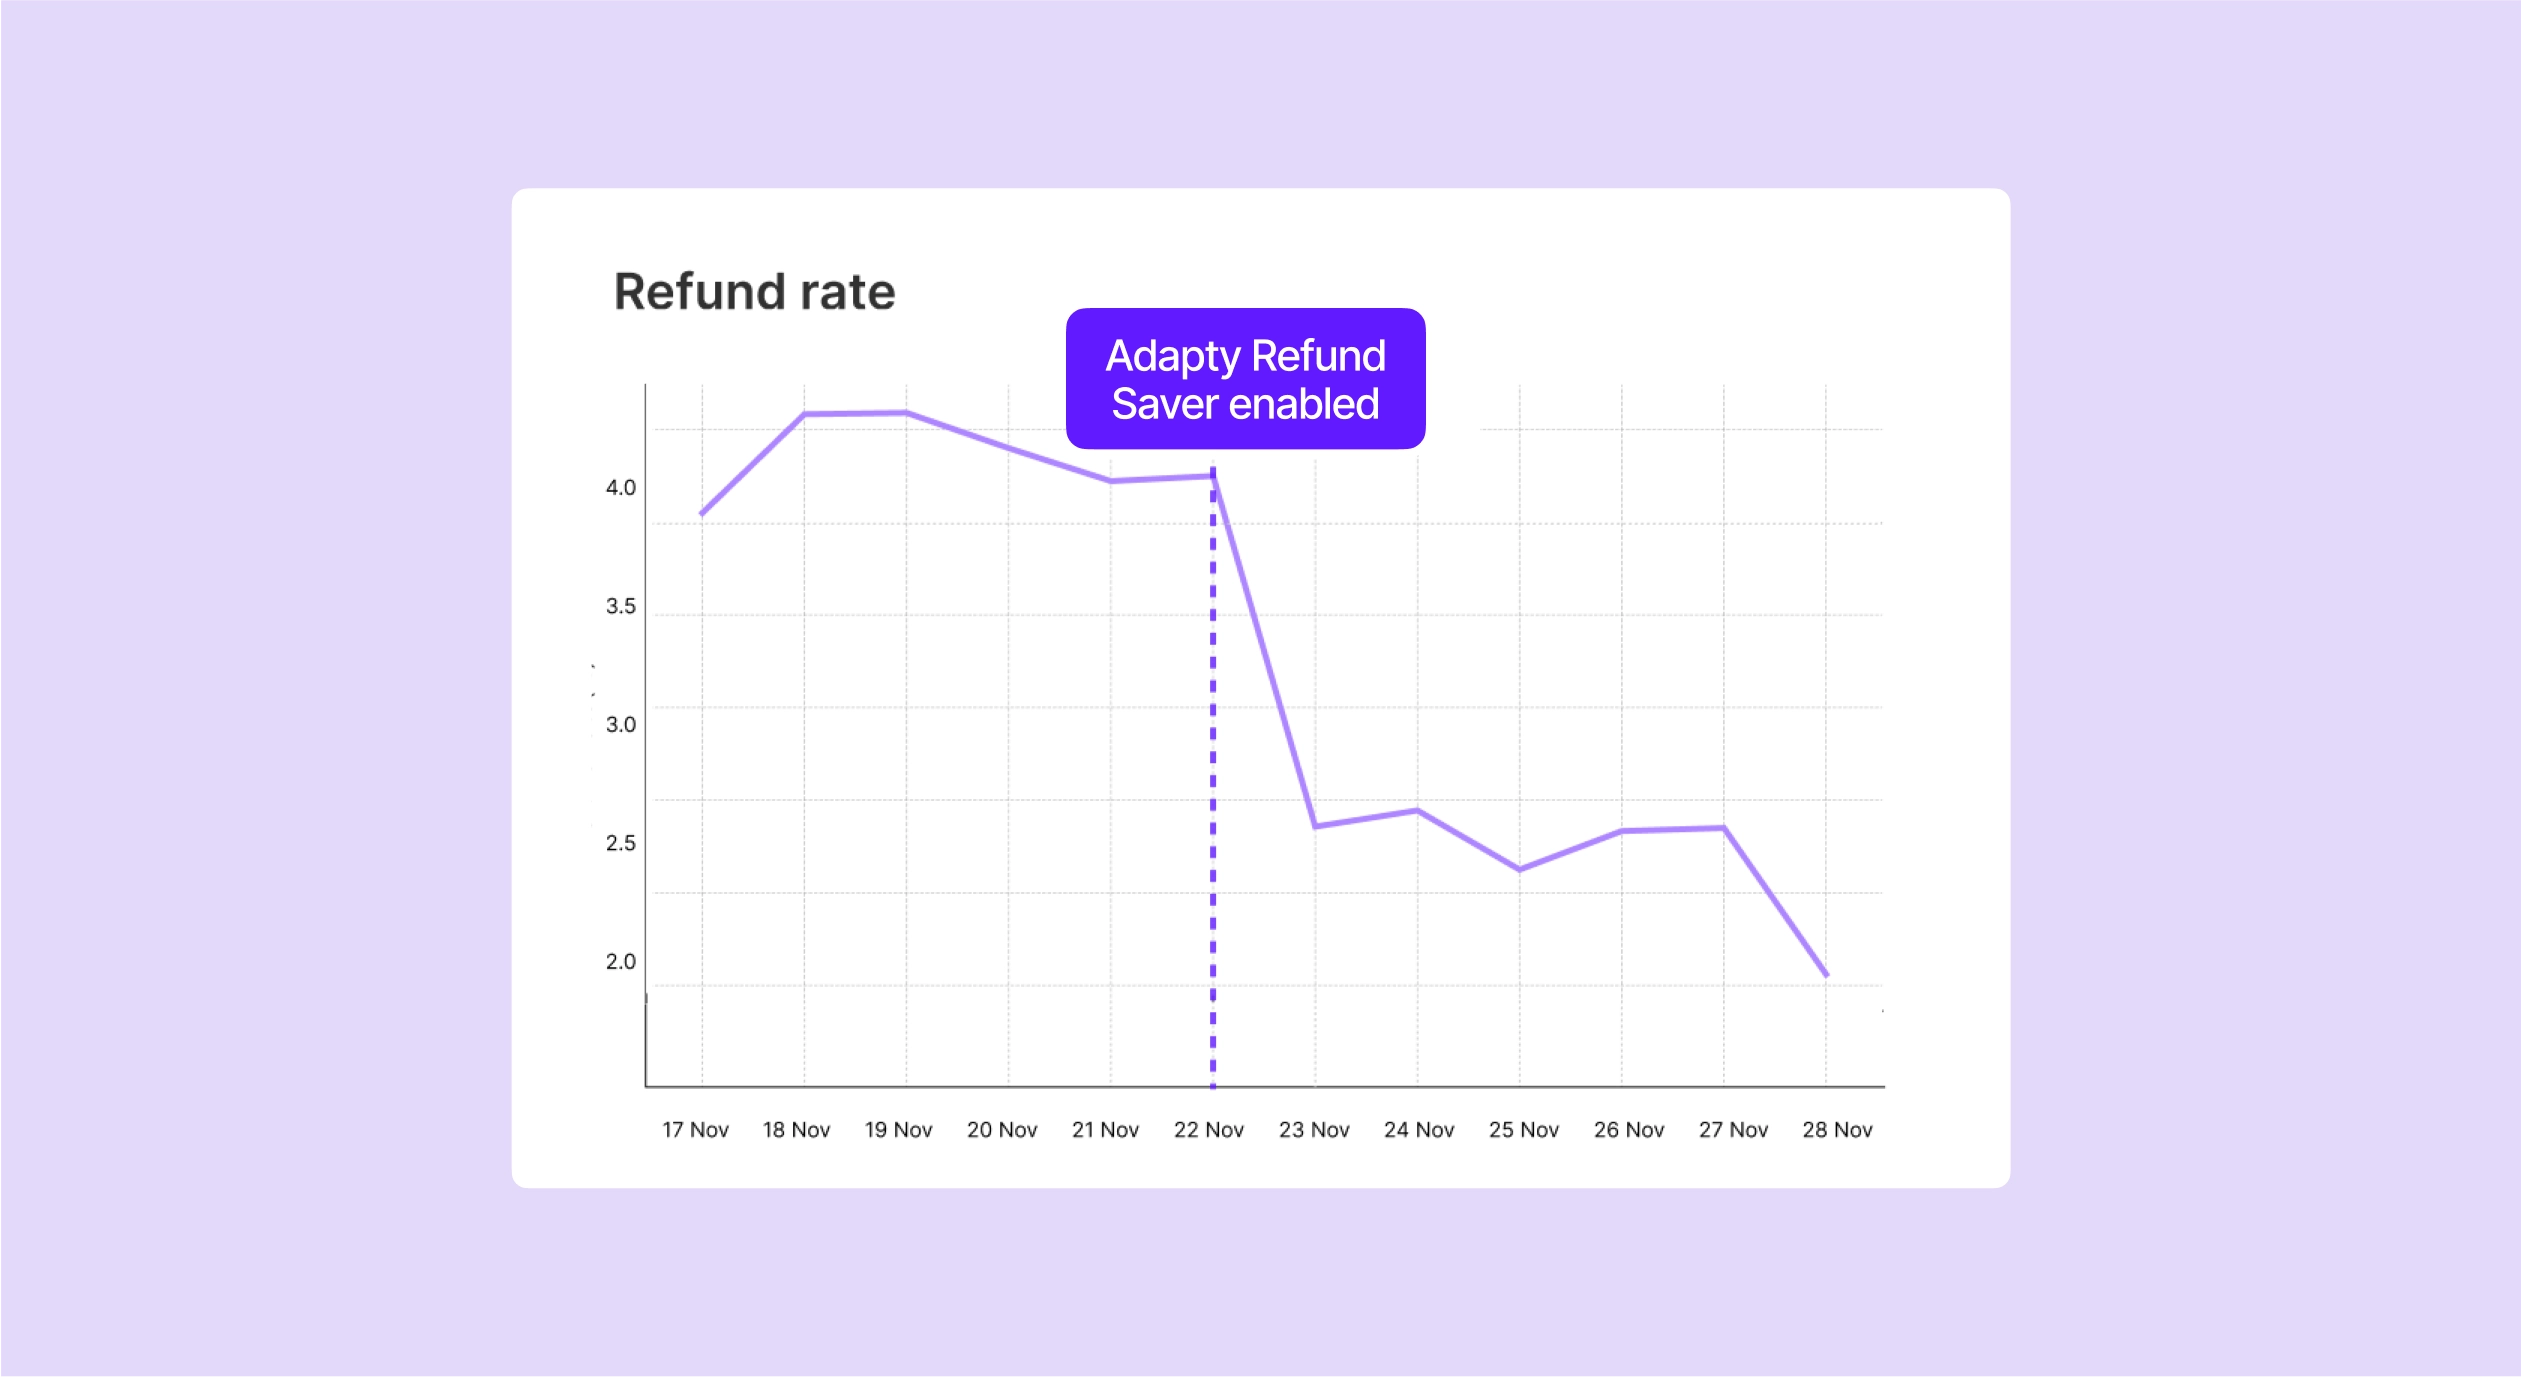
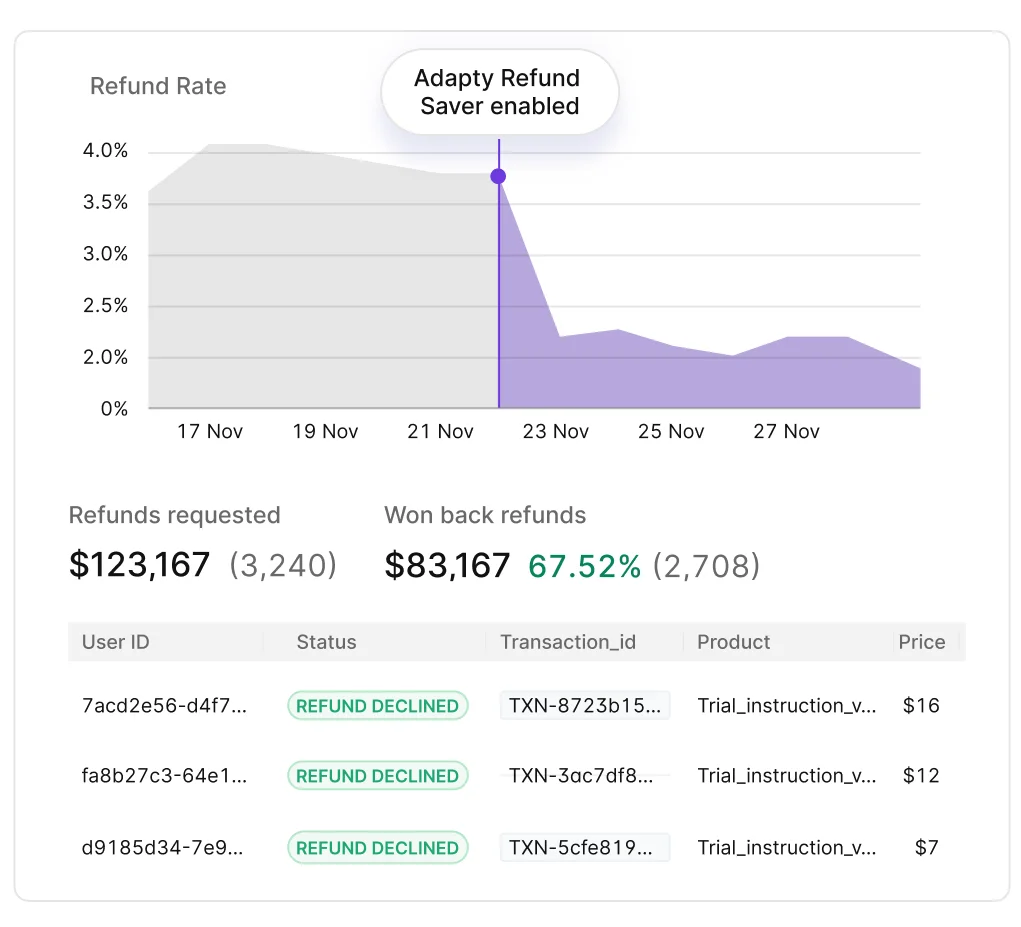
Automate refund recovery with Adapty Refund Saver
While reducing refund requests is important, you can also recover revenue from refunds that have already been filed. Adapty's Refund Saver automates the process of disputing refund requests through Apple's Consumption API. How it works: when a user requests a refund, Refund Saver automatically submits usage and engagement data to Apple, providing context that helps Apple make a more informed refund decision.
The results speak for themselves — Refund Saver wins up to 80% of disputes and typically recovers 2-3% of total revenue, reducing refund rates by approximately 50%. For a subscription app generating $35,000 in monthly revenue with a 5% refund rate, that translates to $1,750 in monthly losses without intervention. Refund Saver can recover a significant portion of this, often more than covering the cost of the Adapty subscription itself.
Comparison with e-commerce and retail return rates
For context, it is useful to compare mobile app refund rates with return rates in other industries. Mobile apps generally see much lower refund rates than physical goods, partly because digital products cannot be "returned" in the traditional sense and partly because app store platforms mediate the process.
| Industry | Average return / refund rate |
| Fashion and apparel (e-commerce) | 20 – 40% |
| Consumer electronics | 10 – 15% |
| Overall US retail | 16.6% |
| SaaS subscriptions | ~12% (cancellation refund requests) |
| Home and furniture | 5 – 10% |
| Mobile app subscriptions | 2 – 5% |
| Health and beauty | 3 – 8% |
| Grocery and FMCG | 1 – 5% |
App Store cancellation reasons: iOS vs Google Play
Understanding why users cancel (which often precedes or accompanies a refund request) helps you target your retention efforts more effectively.
| Cancellation reason | App Store (iOS) | Google Play |
| User unsubscribed voluntarily | 74.5% | 67.2% |
| Billing errors / failed payments | 15.1% | 28.2% |
| Other reasons | 10.4% | 4.6% |
The notably higher rate of billing errors on Google Play (28.2% vs 15.1% on iOS) highlights the importance of implementing payment recovery mechanisms specifically for Android users.
Key metrics to track alongside refund rate
Refund rate should not be viewed in isolation. Track it alongside these related metrics to get a complete picture of your app's financial health:
- MRR (monthly recurring revenue): Track how refunds impact your recurring revenue baseline
- Churn rate: Understand whether refunds are a leading indicator of broader retention issues
- LTV: Factor a "refund tax" of 3-5% into your LTV models, especially for education and health apps
- ARPU/ARPPU: Compare revenue per user against refund rates to ensure pricing aligns with value delivery
- Trial-to-paid conversion rate: Low trial conversion paired with high refund rates suggests a fundamental value communication problem
- Refund rate by acquisition channel: Identify if specific channels drive disproportionate refund volumes
Use Adapty's subscription analytics dashboard to track all of these metrics in one place, with 99.5% accuracy compared to App Store Connect.