How many users could you acquire for your mobile app if you got $10,000 in funding? Or how much of your profits would you need to reinvest to grow your mobile app by a hundred users a month? Or simply, what does unit economics look like for your app?
Enter customer acquisition cost (CAC) analysis. Customer acquisition cost — or the cost of acquiring a mobile app user — is a key marketing metric for user acquisition. Analyzing CAC tells you exactly how much money you spend to acquire an app user. While CAC is calculated primarily at the user level (for example, when a user installs your app, it’s counted as an acquisition), it’s common to calculate CAC for specific user actions, too, like purchases and in-app actions like registrations or in-app purchases.
To put things in perspective: the average cost per install (CPI) in 2025 is $4.70 on iOS and $3.70 on Android — a dramatic increase from just a few years ago. In North America, CPIs range from $2.50 to $5.28, while in regions like Latin America, you can still acquire users for as low as $0.50–$2.00. Customer acquisition costs have surged by roughly 60% over the past five years alone, driven by privacy regulations, increased competition, and rising ad costs. Understanding exactly where your money goes — and what it brings back — has never been more important.
In this guide, we’ll cover what CAC is, the different formulas used to calculate it, and the various levels at which CAC can be calculated. We’ll look at the latest CPI and CPA benchmarks by app category, region, and acquisition channel. We’ll also examine how CAC ties to LTV and why the CAC–LTV ratio is crucial to ensure app growth. Along the way, we’ll see how privacy changes like Apple’s App Tracking Transparency (ATT) have reshaped acquisition costs, and how AI is changing the optimization game. Finally, we’ll cover the CAC payback period and practical strategies to reduce your CAC.
Let’s dive in.
What is CAC?
Acquiring mobile app users needs spending on a host of marketing and sales ops that work on the different stages of the mobile app conversion funnel. At the discovery stage, you need to spend on channels like ads or PR. Running ads or PR stories needs a good upfront investment.
Once users land on your app store listings, your on-page optimization takes investment. You need to spend money on creating compelling copy, quality graphics, and pricing analysis, among other things.
When users download your app, you need to invest in the engagement so they sign up for a trial, make in-app purchases, or stay subscribed (if it’s a subscription app). This means spending on solutions for onboarding and in-app messaging, among others.
Said another way: acquiring a mobile app user takes substantial investment. Importantly, the cost of acquisition doesn’t end with acquiring a user. Often, it adds up until a user performs a desired in-app action like making an in-app purchase. More on this in just a bit, but let’s focus on all the spending leading up to the install for now.
Unless you know how much money you need to acquire a user (across all these sales and marketing activities and more), you can’t calculate how much value they bring to your business.
This is what the CAC metric helps decode. CAC is the total cost of acquiring an app user. This cost factors in all the marketing and sales expenses that go into getting them.
CAC gives you a complete picture of your user acquisition stage, money-wise. Let’s now see how you can calculate your mobile app’s CAC before seeing why it’s so crucial.
How to calculate customer acquisition cost?
The standard CAC formula
CAC = Total Sales & Marketing Spend / Number of New Users Acquired
This is the most basic formula for calculating CAC. Here, you take the sales and marketing budget/spend for a period and divide it by the number of new customers acquired during that specific period.
For example, if you spent $1,000 on your user acquisition sales and marketing efforts in January and acquired 100 users, your CAC becomes 1000/100 = $10. So, you spent $10 on each user acquisition.
The paid CAC formula
Paid CAC = Campaign Ad Spend / Number of Users Acquired from That Campaign
When you invest in paid marketing campaigns, you should know which campaign worked the best for you. In these cases, you’d calculate your CAC at the campaign level.
The paid CAC formula helps here. So if you spent $500 on an ad campaign in the App Store and acquired 50 users, your paid CAC becomes: 500/50 = $10.
The fully loaded CAC formula
Fully Loaded CAC = (Ad Spend + Salaries + Tools + Agency Fees + Overheads) / Number of New Users Acquired
When you calculate CAC using its standard formula, you only consider budgets or spending. However, the real spend is often much higher. It includes not just the direct marketing and sales costs but also overheads, for example, in the form of employee salaries or investment in tools, among others.
For example, if you consider the paid CAC calculation from above, you’ll see that it only factored in the actual ad spend ($500). It left out:
- Costs associated with the researching, copywriting, and designing that went into building the campaigns (in terms of employee salaries)
- Costs associated with tools used for running the campaigns or any other solutions you use in your mobile app sales/marketing tech stack
- Costs associated with any consultations that went into the campaigns
Industry benchmarks suggest a typical fully loaded CAC breaks down as follows:
| Cost component | % of total CAC | Description |
|---|---|---|
| Media / Ad spend | 70–80% | Paid campaigns across channels (Apple Search Ads, Meta, Google, TikTok, etc.) |
| Creative production | 10–15% | Video ads, graphics, ad copy, UGC content |
| Technology and personnel | 10–15% | Analytics tools, team salaries, agency fees, consultancy |
Only when you add all these to your CAC calculations will you get your accurate and “real” cost of acquiring a user. The fully loaded CAC formula takes all these into account to give you a comprehensive estimate reflecting your direct and indirect costs of acquiring users.
CAC benchmarks: What does user acquisition actually cost in 2026?
While exact CAC varies by app, understanding current industry benchmarks helps you set realistic budgets and evaluate your performance. Let’s break down the numbers by category, region, and platform.
CPI and CPA benchmarks by app category
Different app verticals face very different acquisition economics. Fintech apps, for example, operate in one of the most competitive and regulated spaces, pushing CPIs well above $10 on iOS. Meanwhile, casual gaming benefits from massive scale and lower entry costs.
| App category | Avg CPI (iOS) | Avg CPI (Android) | CPA range | Notes |
|---|---|---|---|---|
| Casual gaming | $2.00–$3.00 | $0.63–$1.50 | $1.50–$3.00 | Simulation games have the lowest CPI (~$0.59) |
| Mid-core gaming | $3.00–$5.00 | $1.50–$3.00 | $4.00–$8.00 | Higher due to more engaged user profiles |
| Fintech | $10.00–$35.00 | $5.00–$15.00 | $8.00–$12.00 | Highest CAC vertical; regulated markets drive costs up |
| E-commerce / shopping | $2.50–$5.00 | $1.50–$3.50 | $6.00–$10.00 | North America CPI for shopping apps averages ~$4.74 |
| Health and fitness | $3.00–$6.00 | $1.50–$3.00 | $4.00–$7.00 | Revenue per install above $0.63 at 60 days (top category) |
| Subscription apps (general) | $3.00–$8.00 | $2.00–$5.00 | $5.00–$10.00 | Fully loaded CAC typically 2–3x the CPI |
| Entertainment and streaming | $2.50–$5.00 | $1.50–$3.00 | $3.00–$6.00 | High competition from major players |
Sources: Liftoff, Mapendo, Adjust, AppSamurai, Business of Apps, Sensor Tower
CPI benchmarks by region
Geographic location dramatically affects user acquisition cost. The same app can have a 10x cost differential between North America and Latin America.
| Region | CPI range | Key insights |
|---|---|---|
| North America | $2.50–$5.28 | Highest globally. West Coast runs 15–25% above average. Highest monetization potential justifies premium costs. |
| EMEA | $2.00–$4.00 | Varies widely by country. UK and Germany at the upper end. Eastern Europe offers more cost-effective options. |
| APAC | $1.50–$3.00 | Fastest-growing region. Cost-effective expansion with strong engagement rates. |
| Latin America | $0.50–$2.00 | Lowest CPIs globally — 60% below US costs. Ideal for volume-based strategies if your app monetizes in these markets. |
| Australia | $1.50–$2.00 | Cost-effective with high user engagement. Popular for testing before North American launches. |
Sources: Business of Apps, Mapendo, Sensor Tower
iOS vs. Android: Acquisition cost comparison
Choosing which platform to prioritize is one of the most consequential CAC decisions you’ll make. Here’s how iOS and Android compare:
| Factor | iOS | Android |
|---|---|---|
| Average CPI | $4.70 | $3.70 |
| User spending propensity | Higher (more in-app purchases, higher ARPU) | Lower on average |
| Privacy restrictions | Stricter — ATT limits tracking to ~14% opt-in | Evolving — Google Privacy Sandbox in progress |
| Tracking capability | Limited (most users opt out of tracking) | Better for now, but declining |
| User LTV | Generally higher | Generally lower |
| CAC payback | Often longer due to higher CPI | Shorter due to lower CPI |
| Best for | Apps that monetize well with high ARPU | Scale and volume-based strategies |
The key takeaway: iOS users cost more to acquire but typically generate more revenue. Android offers scale at lower costs. Many successful apps run differentiated strategies for each platform rather than applying a single approach across both.
Why privacy changes are driving CAC higher
One of the biggest factors reshaping mobile user acquisition costs is Apple’s App Tracking Transparency (ATT) framework, introduced with iOS 14.5 in April 2021. If you’re calculating CAC for an iOS app today and not factoring in the impact of ATT, your numbers are incomplete.
Here’s what the data shows:
ATT opt-in rates have collapsed. Global opt-in rates fell to just 13.85% by mid-2024, according to Singular. That means roughly 86% of iOS users choose not to be tracked, stripping advertisers of the user-level data they previously relied on for targeting, attribution, and campaign optimization.
iOS CPI has increased by 20–30% post-ATT. With less data available for precise targeting, advertisers have to cast wider nets and bid higher. Apps with ATT opt-in rates below 30% lose an average of 58% of their advertising revenue, according to AppsFlyer’s 2025 analysis. This creates a compounding effect: reduced revenue from ads means less budget for acquisition, while the cost of acquisition itself keeps climbing.
Apple’s own ad business has surged. Apple Search Ads now controls over 50% of iOS app advertising — a dramatic increase from pre-ATT levels. The cost-per-tap for Search Ads has roughly doubled, and for many developers, Apple’s platform has become the most effective (and most expensive) way to acquire iOS users.
Meta and other ad networks took a major hit. Meta cited ATT as a key factor behind losing approximately $10 billion in annual ad revenue. With reduced signal from iOS, retargeting pools have shrunk, ad personalization has weakened, and campaign measurement has become less reliable across Facebook, Instagram, and other major platforms.
What this means for your CAC strategy:
- First-party data is now essential. Build your own data assets — email lists, push notification subscribers, in-app engagement loops — to reduce reliance on third-party tracking.
- Contextual advertising is making a comeback. With user-level targeting harder to execute, contextual placements (matching ads to content rather than user profiles) are increasingly competitive.
- Web-to-app funnels can bypass some ATT limitations. By pre-qualifying users on landing pages before sending them to the App Store, you capture first-party data and improve conversion rates — often reducing effective CAC by 20–40%.
- Diversify beyond iOS if feasible. Android’s privacy changes via Google’s Privacy Sandbox are still evolving and currently offer better tracking capabilities. Running platform-specific strategies can help balance your blended CAC.
Why factoring in an app’s monetization model is important for CAC calculations
For free apps that don’t offer in-app purchases, CAC analysis is quite straightforward and ends with the install.
For paid apps that don’t offer in-app purchases — these are apps that come with a one-time fee paid upfront in the app store — CAC analysis works similarly. You just need to price your app higher than the CAC you estimate to run profitably.
However, for 1) freemium apps, 2) premium apps with additional in-app purchases (often termed the “paymium” app monetization model), and 3) subscription apps, CAC analysis is more complex as there’s one more category of users here: “paying” users.
Mobile apps following the above monetization models treat installs as the first acquisition stage. For example, for a freemium app, a user who downloads the free version is only a “lead” in a sense. Likewise, for a paid app that further monetizes with in-app purchases, again, to an extent, the initial install is only like generating a lead. Similarly, for a subscription app that offers trials, acquisition only happens when a user successfully transitions to a paid plan from their trial.
For such apps, CAC is calculated by dividing spend by the number of paying users. Alternatively, such apps will calculate the CAC using standard formulas but will also calculate the cost of acquisition actions (like making an in-app purchase) to get more insights.
CAC by acquisition channel: Where to spend your budget
Not all acquisition channels are created equal. Understanding the cost and performance profile of each channel helps you allocate budget more effectively and identify which channels to scale, test, or cut.
| Channel | Avg CPI/CPA range | Strengths | Weaknesses |
|---|---|---|---|
| Apple Search Ads | $2.00–$6.00 CPI | Very high intent users (searching for apps); strong iOS attribution even post-ATT | Cost-per-tap has doubled; Apple controls pricing; limited creative options |
| Facebook / Meta Ads | $2.09+ CPI | Massive scale; sophisticated targeting (declining post-ATT); strong for retargeting | ATT impact reduced signal quality; rising costs; reporting less reliable on iOS |
| Google app campaigns | $1.50–$4.00 CPI | Broad reach across Search, YouTube, Play Store, Display; strong automation | Less control over placements; requires sufficient conversion data to optimize |
| TikTok ads | $1.00–$3.00 CPI | Access to younger demographics; viral potential; lower CPIs in many verticals | Measurement challenges; creative-heavy (needs frequent refreshing); less predictable |
| Influencer marketing | Varies widely | 30–40% lower CPL than traditional ads; $6.50 ROI per $1 spent; builds authentic trust | Harder to measure precisely; management overhead; finding right creators takes effort |
| Organic (ASO / SEO) | Near-zero marginal cost | Long-term cost reduction; compounds over time; high-quality organic users | Slow to build; competitive; requires ongoing optimization |
| Referral programs | $0.50–$2.00 per user | Very high-quality users; low cost per acquisition; built-in trust | Requires existing user base; growth can plateau |
| Content marketing / PR | Varies | Builds brand authority; compounds over time; supports other channels | Slow ROI; hard to attribute directly |
Pro tip: Don’t optimize channels in isolation. The best-performing apps run integrated strategies where organic channels (ASO, content, referrals) reduce blended CAC while paid channels (Apple Search Ads, Meta, TikTok) drive predictable volume. Calculate paid CAC and blended CAC separately to understand the true economics of each approach.
How long does it take you to recoup your customer acquisition costs? All about CAC payback period and why it matters
One of the first questions you’ll find yourself asking after calculating your CAC is: How long does it take you to recover your CAC (i.e., the cost of acquiring a user)?
This is important because, obviously, you want to recover your CAC. It’s only after the CAC payback that a user will contribute to your profits.
Enter ARPU.
ARPU — or the average revenue per user — is a metric that tells you, on average, how much revenue each user gets you. To calculate your CAC payback period, divide CAC by ARPU:
CAC Payback Period = CAC / Monthly ARPU
Below, you’ve Adapty reporting an app’s average monthly ARPU:
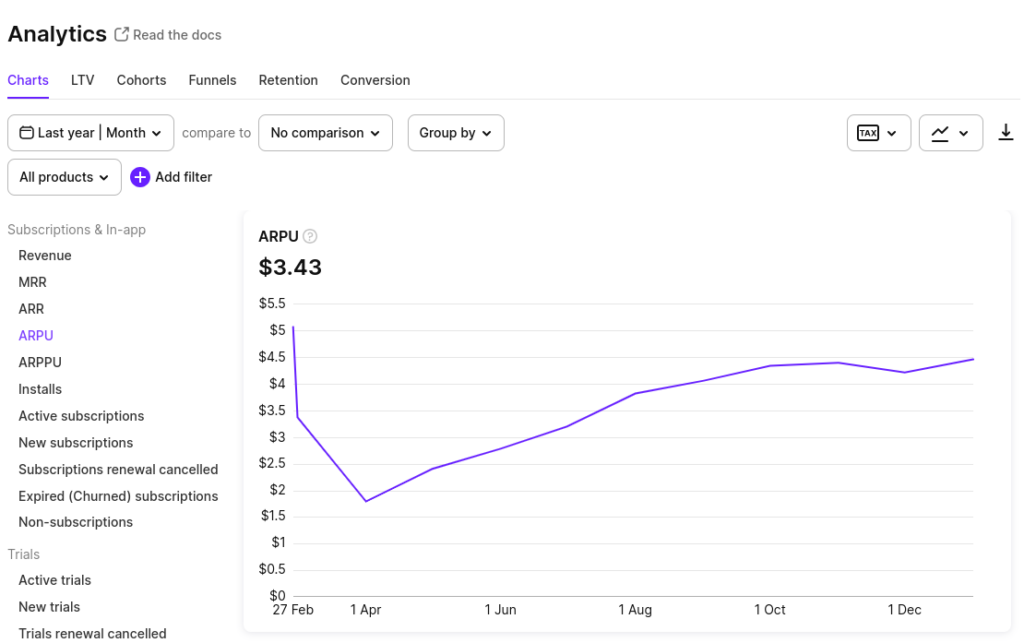
Suppose your CAC is $10, and your monthly ARPU is $3.5. So, in this case, you’ll take about 2.8 months, on average, to recover your CAC.
But wait — as we saw earlier, CAC is also calculated at the paid user level for apps that use in-app purchases. In this case, you’d use your ARPPU to calculate your CAC payback period. ARPPU is the average revenue you make from your paying customers.
So, say your CAC for acquiring paid users is $50, and your ARPPU is $30; then, you’ll take about 1.5 months to recoup your CAC.
CAC payback period benchmarks by app type
Different app categories have different payback expectations. What’s acceptable in gaming might be alarming for a subscription app, and vice versa.
| App type | Typical CAC payback | What drives it |
|---|---|---|
| Gaming apps | 30–45 days | Fast monetization through ads and IAPs; high early engagement |
| Subscription apps | 60–90 days | Depends on plan length, trial conversion rate, and pricing |
| E-commerce apps | 45–60 days | Varies with average order value and repeat purchase frequency |
| Fintech apps | 6–24 months | High CAC justified by very high LTV; longer sales cycles |
If your payback period is significantly longer than these benchmarks for your category, it’s a signal to re-examine either your CAC (can you acquire more cheaply?) or your monetization (can you convert and retain users more effectively?).
How much do you make off each user? The CAC–LTV ratio
To understand how much profit you make off each user, you need your user’s lifetime value (LTV) data. Your LTV should be much higher than your CAC to ensure good profit.
LTV:CAC Ratio = Customer Lifetime Value / Customer Acquisition Cost
Let’s take a real-world example. In this article on unit economics, we discussed Calm’s numbers featured by the Pujji brothers in one of their podcasts. The meditation app Calm had an LTV of about $200, of which $80 got spent on things like maintaining the app and creating content, leaving the actual LTV at $120. Its CAC stood at about $40.
So the LTV/CAC ratio came to be about 3:1 ($120/$40) — which is excellent. This remains the gold standard for mobile apps today. It’s especially impressive given that Calm’s CAC payback period was only about a year, explaining why it’s such a successful and profitable app.
Here’s Adapty reporting an app’s LTV:
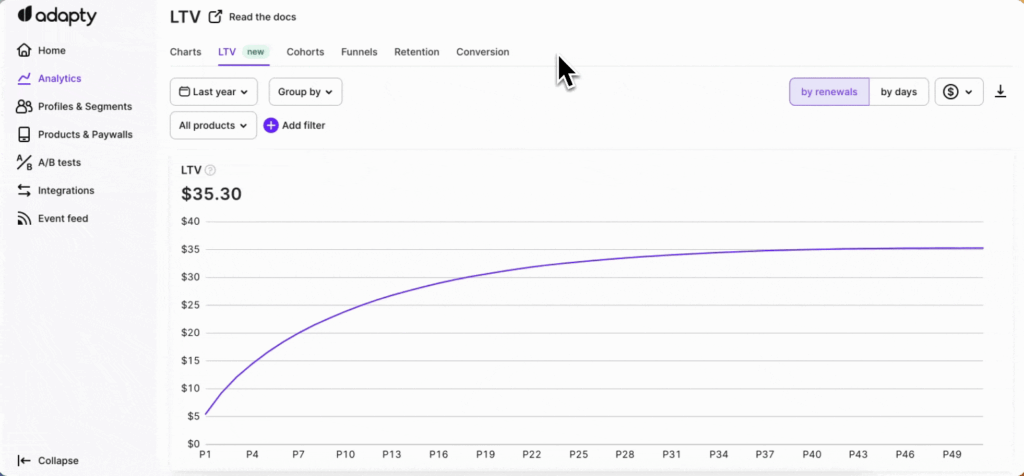
What does a good CAC look like for mobile apps?
While there’s no single “good CAC” number (it varies too much by monetization model, vertical, and market), there are reliable frameworks for evaluating whether your CAC is healthy. The most important one is your LTV:CAC ratio.
| LTV:CAC ratio | Health status | What it means | Recommended action |
|---|---|---|---|
| 5:1 or higher | Under-investing | You have room to grow faster by spending more on acquisition | Scale proven channels aggressively; test new channels |
| 4:1 | Excellent | Strong profitability; very attractive to investors | Optimize and maintain; explore expansion opportunities |
| 3:1 | Healthy | Industry standard for sustainable mobile app growth | Continue optimization; the benchmark most investors expect |
| 2:1 | Marginal | Profitable but may not sustain long-term growth | Reduce CAC or improve retention/monetization urgently |
| 1:1 | Break-even | Only recovering acquisition costs — no profit | Major action needed; re-evaluate channels and pricing |
| Below 1:1 | Losing money | Spending more to acquire users than they generate | Pause underperforming campaigns; restructure strategy |
By the way, if you plan to sell your app in the future, your LTV:CAC ratio is one of the first things potential investors will look at. They want to see at least a 3:1 ratio, and for subscription apps, a ratio of 4:1 to 5:1 is increasingly expected. They’ll also evaluate your CAC payback period — ideally under 12 months.
What’s driving CAC higher in 2026 (and what to do about it)
Understanding why acquisition costs keep climbing helps you build strategies that account for these trends rather than fighting against them:
Privacy regulations have fundamentally changed targeting. ATT, the phase-out of third-party cookies, and GDPR enforcement have collectively reduced the data available for ad targeting. Advertisers have lost access to roughly 70% of the user-level data they relied on just a few years ago.
Market saturation intensifies competition. With over 2.2 million apps on the App Store and 3.3 million on Google Play, standing out is harder and more expensive than ever. More advertisers are competing for the same ad inventory, driving up auction prices across all channels.
Ad costs keep climbing. Facebook’s average CPI has risen above $2.09, Apple Search Ads costs have doubled, and programmatic advertising auctions are increasingly crowded. The average mobile app acquisition cost has increased by 60% over the past five years.
Creative fatigue demands constant reinvention. Users scroll past thousands of ads daily. Static banners no longer work. Effective acquisition now requires diverse creative formats — short-form video, influencer-generated content, UGC, and interactive ads — each adding to production costs.
The signal loss problem compounds everything. With less user-level data available, campaign optimization is less precise. This means more wasted spend to achieve the same results, effectively inflating CAC even when budgets remain constant.
How AI is changing CAC optimization
AI is emerging as a powerful lever for reducing CAC and improving acquisition efficiency. Here’s how leading apps are using it:
AI-powered campaign optimization. Platforms like Meta’s Advantage+ and Google’s App Campaigns use machine learning to automatically optimize bidding, targeting, and creative delivery. Apps leveraging these tools often see 15–25% improvements in CPA.
Predictive LTV modeling. Instead of optimizing campaigns for the cheapest installs, predictive models identify which user segments will generate the most lifetime revenue. Tools like Adapty’s predictive analytics and LTV prediction model help you bid on high-value users rather than just high-volume installs — a shift that fundamentally improves your LTV:CAC ratio.
AI-generated creatives at scale. Generating multiple ad variations using AI tools reduces creative production costs and enables faster testing. This helps combat creative fatigue without linearly increasing your creative budget.
Personalized onboarding and paywalls. AI-driven personalization of the post-install experience — from onboarding flows to paywall presentation — improves trial-to-paid conversion rates. Even small improvements here have a significant multiplier effect on effective CAC. Adapty’s Autopilot feature uses AI to automatically optimize paywall performance, directly impacting your unit economics.
How to optimize your CAC, CAC payback period, and overall LTV
Target your most profitable user segments
If you sell an annual subscription, you’ll recover your entire CAC for a user upfront with a single payment. So, look at your user base to identify segments that prefer the annual plan. Next, prioritize this user segment with your user acquisition campaigns. Use Adapty’s revenue analytics to identify which user cohorts have the highest LTV and shortest payback periods, then focus acquisition spend on similar profiles.
Address churn proactively
If your users leave you before the CAC payback period, you lose all the money you spent to get them. So monitor churn. Use a solution like Adapty to understand your churn pattern. If you’ve a subscription app with a low trial-to-paid conversion rate, fix the trial, offer an extended trial, or give a better offer. Also, focus on the users in the grace period — Adapty’s Refund Saver can help you recover users who would otherwise churn. Remember: reducing churn by even 5% can improve your LTV:CAC ratio by 25–95%.
Leverage first-party data
In a post-ATT world, your first-party data is your most valuable acquisition asset. Build email lists, push notification subscribers, and in-app engagement loops. These allow you to retarget and re-engage users without relying on third-party tracking — keeping your effective CAC lower.
Use web-to-app funnels
Web-to-app funnels use landing pages to pre-qualify users before directing them to app stores. This improves conversion rates, gives you first-party data for attribution, and often reduces effective CAC by 20–40%. It also helps bypass some ATT limitations by capturing user intent data before they ever reach the App Store.
Diversify your acquisition channels
Don’t put all your budget into one channel. Try using organic channels like ASO, SEO, content marketing, and referral programs alongside paid campaigns. Setting these up may take investment upfront, but over time, they significantly reduce your blended CAC. Influencer partnerships, in particular, are delivering 30–40% lower cost-per-lead than traditional advertising in many verticals.
Experiment with your products, pricing, and offers
Redistributing your user base can help optimize your CAC. For example, if you sell monthly subscriptions and your CAC payback period is six months, consider offering an annual or semi-annual subscription plan to break even with a single payment. Use Adapty’s no-code paywall builder and A/B testing to quickly experiment with newer plans and offers. You’ll be surprised at how you can actually redistribute your user base to get more subscribers for a desired plan that eventually reduces your CAC payback period.
You can also prioritize “expansion revenue.” The best way to do this is to add more in-app purchase tiers or premium features to recover your CAC and hit profits sooner.
Optimize for LTV, not just CPI
This is perhaps the most important mindset shift. A low CPI is meaningless if acquired users don’t convert or retain. Use predictive LTV modeling to identify and target user segments that generate the most long-term revenue, even if their initial acquisition cost is higher. With tools like Adapty’s Apple Ads Manager, you can track keyword-level ROAS without needing a separate MMP, connecting your acquisition spend directly to subscription revenue.
Add experimentation to your acquisition channels
If you use ads to acquire new users, your CAC will fluctuate based on your niche’s competition. However, paid CAC calculations for your different advertising campaigns can help you find the ones with the best returns. Experimenting with different kinds of ad campaigns, targeting, and creative formats can help lower the CAC here.
App store optimization is more competitive now than ever, with most apps doing all the right things already. While experimenting with your app listings will add overhead to your acquisition costs, the upside is that your CAC will improve in the long term.
Invest in your processes to lower operational costs
Your processes, too, add to your CAC. So, invest in standardizing your sales and marketing processes to optimize your ongoing operational costs. Any savings here will reflect directly in your CAC. Consider consolidating your tech stack — a single solution like Adapty that handles subscription management, paywall optimization, analytics, and A/B testing can replace multiple tools and reduce overhead.
Wrapping it up
Acquiring new users consistently, cost-effectively, and sustainably is the key to growing a mobile app. And this is exactly what CAC analysis helps with. By analyzing your CAC, you can learn exactly what your investment in user acquisition translates to.
As we’ve seen, the landscape has changed dramatically. Customer acquisition costs have risen 60% in five years, privacy regulations have fundamentally reshaped ad targeting, and the channels and strategies that worked just a few years ago are no longer sufficient on their own. The apps that are winning today are the ones that combine diversified acquisition channels, first-party data strategies, predictive analytics, and relentless experimentation.
Simply calculating the cost of acquiring a user (or getting an install) is only one part of the puzzle. Unless you use ad-based monetization where your user base directly translates to your revenue, you need to calculate CAC at a few more levels. For apps monetizing with in-app purchases, this means calculating the costs of acquiring “user actions” like making an in-app purchase.
Your CAC analysis must also analyze the relationship between your CAC and your LTV, because that’s how you calculate the actual revenue you make from a user across their app journey. The CAC payback period is equally crucial.
To get these insights easily, consider a solution like Adapty. More than 8,000 apps trust Adapty for implementing in-app purchases, building and experimenting with paywalls, running AI-powered paywall optimization, and getting accurate revenue analytics, including users’ lifetime value data and predictive LTV. Contact our team for a personalized walkthrough of Adapty to see how it can support your app’s growth story.