Top 5 advanced mobile apps subscription metrics

In subscription economy analytics, there are generally accepted metrics: revenue, MRR (monthly recurring revenue), ARR (annual recurring revenue), and the total number of subscribers. These parameters are the core of app analytics and can always be found in the billing system of the provider, for example, in App Store Connect or Google Play Console. But they are not enough for proper monitoring of the status of your app.
A total revenue graph or other general metrics are unlikely to be helpful when you want to understand how your subscription business actually works. You can't assess the "long tail" of subscribers or predict future churn from MRR alone. Advanced metrics help you look beyond surface-level numbers to understand what's driving your subscription performance. They reveal hidden patterns, predict future behavior, and show you exactly where to focus your optimization efforts. Below, I'll describe five advanced mobile subscription metrics that go deeper than the basics. Try them and see how useful they are to evaluate the health of your product economy.
Auto-renewal rate
Auto-renewal indicates if the user will renew the subscription in the next billing period. Why active renewals and not just active subscriptions as a target metric? The problem is that a user who canceled their subscription is still considered active until the end of the paid period. This status is true formally, but in perspective, may bring an unpleasant surprise of unexpected churn. So if the data on active subscriptions can be misleading, how do auto-renewals help? On the charts below, users are broken down by their renewal status.
Even visually comparing the share of disabled renewals, you can easily see the difference in two selected periods:
Good: Most of the subscribers have the auto-renewal status active, <10% disabled the renewal
Worse: The amount of subscribers who turned off their renewal is ~20% The percentage of users with active renewal status helps you see how much money you'll get in the next billing period. This forward-looking metric gives you visibility into future revenue before it actually happens.
Benchmarks for 2026
According to recent industry data, mobile subscription apps typically see auto-renewal rates between 80-92% for well-performing products. Apps with renewal rates below 75% should investigate onboarding quality, feature value delivery, or pricing concerns.
Category-specific variations exist: productivity apps average 85% auto-renewal rates, while entertainment apps see closer to 78% due to seasonal usage patterns. Health and fitness apps often reach 88-90% renewal rates when users achieve early wins in their first 30 days.
How to improve auto-renewal rates
Focus on demonstrating value before the renewal window opens. Send engagement reminders 7-14 days before renewal, highlighting features the user hasn't explored yet. Consider implementing renewal incentives like loyalty discounts or feature upgrades for long-term subscribers. Monitor which cohorts have lower renewal rates and investigate common patterns.
Often, users who didn't complete onboarding or who never adopted core features are most likely to cancel. Address these friction points early in the customer journey.
Net revenue retention (NRR)
Net revenue retention measures revenue growth from your existing customer base, accounting for upgrades, downgrades, and churn. Unlike gross metrics that only track new revenue, NRR shows whether you're growing revenue from customers you already have.
The formula: NRR = (Starting MRR + Expansion MRR - Downgrade MRR - Churned MRR) / Starting MRR × 100%
An NRR above 100% means you're growing revenue from existing customers even without acquiring new ones. This is the gold standard for subscription businesses because it shows your product delivers increasing value over time.
Why NRR matters more than you think
NRR is particularly important for mobile apps because acquisition costs continue to rise across all channels. In 2026, the median cost per install for subscription apps ranges from $1.50 to $4.50 depending on category, with competitive niches like finance and productivity reaching $8+ per install.
When your NRR exceeds 100%, you can afford higher acquisition costs because existing customers naturally expand their spending. Apps with NRR above 110% can invest aggressively in growth while maintaining healthy unit economics.
Benchmarks for 2026
Top-performing mobile subscription apps achieve NRR between 105-120%. Average performers sit around 90-95%, which means they're slowly bleeding revenue from their existing base even if total subscriber counts grow.
B2B-focused apps typically see higher NRR (110-130%) compared to consumer apps (85-105%) due to longer sales cycles and feature expansion opportunities. However, consumer apps with strong content or feature updates can match or exceed B2B performance.
Improving your NRR
Focus on three levers: reducing churn, minimizing downgrades, and encouraging upgrades. Implement trial conversion strategies that set realistic expectations about value delivery. Use push notifications and in-app messaging to guide users toward premium features they're not yet using. Consider introducing annual plans with discounts that lock in longer commitment periods.
Weekly plans may generate more initial subscribers, but annual plans deliver superior per-subscriber lifetime value and improve NRR by reducing monthly churn opportunities.
Revenue from renewals vs. new subscriptions
The financial model of subscriptions is built on renewals. Breaking down your revenue by source reveals the true health of your subscription business. You want to see revenue from renewals growing as a percentage of total revenue over time.
New subscription-heavy revenue indicates you're in growth mode but potentially burning through customers. Renewal-heavy revenue signals product-market fit and sustainable growth. The ideal mix depends on your business stage, but mature apps should see 60-75% of revenue from renewals.
The renewal revenue chart reveals your trajectory
When plotting revenue over time, distinguish between:
- Revenue from new subscriptions (first-time purchases)
- Revenue from renewals (automated recurring charges)
- Revenue from reactivations (churned users who return)
This breakdown tells a story. If renewal revenue plateaus while new subscription revenue grows, you have a leaky bucket. If both grow together, you're in a healthy expansion phase. If renewal revenue grows while new subscriptions decline, you've likely raised prices or narrowed your acquisition focus.
Category patterns in 2026
According to data from mobile subscription apps, category performance varies significantly.
Lifestyle apps see renewal revenue represent 68% of total revenue on average. Productivity apps reach 72%, while gaming apps with subscription models only achieve 55% due to higher churn.
The gap between iOS and Android also matters. iOS users typically show 8-12% higher renewal rates across categories, likely due to higher purchasing power and different user demographics.
Optimizing your renewal revenue mix
Track the ratio monthly and investigate drops immediately.
Common causes include:
- Decreased feature engagement before renewal windows
- Competitor launches or market shifts
- Pricing changes that triggered unexpected churn
- Technical issues with payment processing
Monitor engagement metrics alongside renewal revenue. Users who engage with your app at least 3 times per week show renewal rates 40-60% higher than less engaged users.
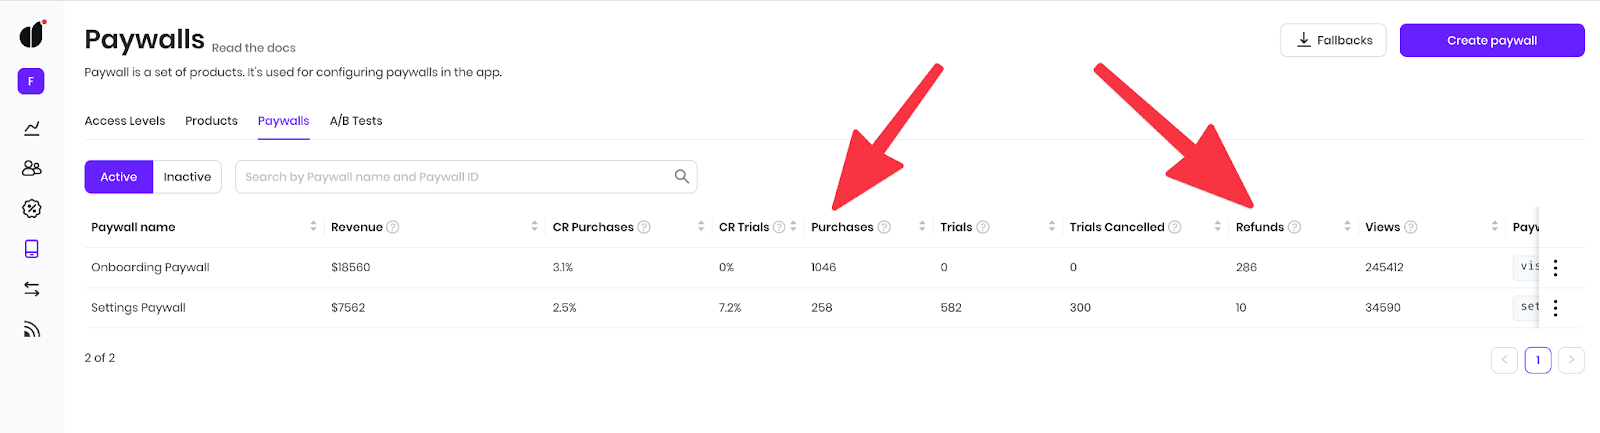
Refund rate
What can be worse than losing a subscriber? Losing one with a refund. A subscriber can request a refund for a subscription anytime, even after 364 days of using an annual product. Developers cannot decide whether to approve refunds since Apple and Google manage this process.
Nevertheless, even with platform holders as "black box" decision makers, approved refunds typically reflect real reasons: a gap between expected product value and actual experience. The main thing to watch is the ratio of refunds to purchases.
Refund rate benchmarks
Mobile subscription apps in 2026 see average refund rates between 2-5% of gross revenue. Rates above 7% signal significant problems with positioning, onboarding, or product quality. Rates below 1% are achievable for apps with excellent product-market fit and transparent communication.
Category variations: education apps average 3.8% refunds, entertainment apps see 4.2%, while utility apps achieve 2.1% due to clearer value propositions and immediate utility.
| Category | Average refund rate | Good performance | Needs improvement |
| Education | 3.8% | <2.5% | >6% |
| Entertainment | 4.2% | <3% | >7% |
| Health & fitness | 3.4% | <2% | >5.5% |
| Productivity | 2.8% | <1.5% | >5% |
| Utilities | 2.1% | <1% | >4% |
Why refund rate matters
Refunds damage more than revenue. Each refund represents:
- Lost customer acquisition cost
- Negative word-of-mouth risk
- Potential App Store rating impact
- Processing fees you still pay
The wider your audience reach, the more refunds will occur in absolute numbers. Focus on the percentage rather than raw numbers. Your regular analytics should include refund rate as an early warning sign of product troubles.
Reducing refund rates
Prevention starts before purchase. Set clear expectations in your app store listing and during onboarding about what features require a subscription. Avoid misleading screenshots or descriptions that oversell capabilities. Implement proactive support outreach to users showing frustration signals. If someone rates your app poorly or contacts support within their trial period, intervene with personalized help.
Users who receive successful support early show 65% higher lifetime value than those who don't. For apps with refund rates above 5%, conduct exit surveys to understand common reasons. Common culprits include unclear pricing, feature discovery problems, technical bugs, or unmet expectations from marketing materials.
Cohort retention curves
Cohort analysis breaks users into groups based on when they subscribed, then tracks how each group behaves over time. Instead of looking at aggregate retention, you see patterns by cohort, revealing whether your product improvements are actually working. A cohort retention curve plots the percentage of users still subscribed at different time intervals (day 7, day 30, day 90, etc.) for each cohort. Ideally, newer cohorts show better retention than older ones, indicating your product is improving.
Reading cohort retention curves
The shape of your retention curve tells a story. A steep initial drop followed by flattening is normal. Most apps lose 60-70% of subscribers in the first 30 days, but retention stabilizes around months 3-6 as engaged users remain.
Concerning patterns include:
- Later cohorts performing worse than earlier ones (product degradation)
- Retention cliffs at specific intervals (billing shock, feature limitations)
- No flattening curve (ongoing churn never stabilizes)
Strong patterns include:
- Progressively improving cohort performance over time
- Early retention improvements (day 7 to day 30)
- Clear retention floors where curves flatten (your core user base)
Benchmarks by subscription duration
Monthly subscription retention averages 45% at day 30, 28% at day 60, and 18% at day 90 across mobile apps.
Weekly subscriptions show steeper curves: 35% at day 30, but faster stabilization due to self-selection of committed users.
Annual subscriptions demonstrate the strongest retention with 88% at month 3, 82% at month 6, and 75% at month 12.
The longer commitment period naturally filters for highly engaged users willing to pay upfront.
Using cohorts for decision-making
Compare cohorts before and after major changes (pricing updates, feature launches, onboarding redesigns). If retention improves for post-change cohorts, you've validated your hypothesis. If it worsens, revert or iterate. Segment cohorts by acquisition channel to identify which sources deliver highest-quality users. Organic users typically show 15-25% better long-term retention than paid acquisition users, though paid can still be profitable with the right LTV:CAC ratio.
Using these metrics together
Advanced metrics reveal their full power when analyzed together rather than in isolation. Here's how they interconnect:
High auto-renewal rates but declining NRR suggests successful retention but missed expansion opportunities. Consider introducing premium tiers or feature add-ons for existing subscribers. Growing renewal revenue percentage but flat NRR indicates you're retaining users without growing their spend. This scenario is stable but leaves money on the table.
Test pricing experiments or value-adds for long-term subscribers. Low refund rates but poor cohort retention after 60 days points to an onboarding problem. Users aren't immediately dissatisfied (hence low refunds) but lose interest over time. Deepen engagement hooks and introduce habit-forming features.
The priority hierarchy
Start with cohort retention curves to understand your baseline. If early retention (day 7-30) is weak, fix onboarding before optimizing other metrics. No point improving renewal rates if users churn before their first renewal. Once early retention stabilizes above 40% at day 30, focus on auto-renewal optimization and refund reduction. These directly impact revenue predictability. Finally, tackle NRR once you have a solid retained base. Expansion revenue requires engaged users who already see value. Attempting upsells too early increases churn and refund rates.
Common mistakes when tracking advanced metrics
Comparing across incompatible time periods
Retention metrics need consistent measurement windows. Don't compare 30-day retention for a cohort from January against 45-day retention for a cohort from February. Use standardized intervals.
Ignoring statistical significance
Small sample sizes create noise. A cohort of 50 users showing 5% better retention than another cohort of 50 users likely reflects randomness, not a meaningful improvement. Wait for sufficient volume (generally 300+ users per cohort) before drawing conclusions.
Focusing only on percentages
A 90% renewal rate sounds impressive, but if your average revenue per user is $2/month, you'll struggle with profitability. Always view retention metrics alongside revenue metrics for complete context.
Neglecting segment analysis
Aggregate metrics hide important variations. Your overall retention might be 70%, but users from organic search could show 85% while users from Facebook ads show 55%. Segment by acquisition channel, geographic region, and subscription tier.
Tools for tracking advanced metrics
Apple's App Store Connect and Google Play Console provide basic subscription metrics, but they lack depth for advanced analysis. You'll need additional tools for cohort analysis, NRR calculation, and retention curve visualization. Adapty provides comprehensive subscription analytics specifically designed for mobile apps, including cohort retention curves, revenue breakdowns, and automated NRR calculation.
The platform integrates directly with App Store and Google Play, pulling raw subscription data and transforming it into actionable insights. For general product analytics, tools like Mixpanel and Amplitude excel at cohort analysis and user segmentation. However, they require manual configuration to track subscription-specific metrics and may miss nuances in how mobile app stores handle subscription events. Revenue analytics platforms often struggle with mobile subscription data because of Apple's and Google's unique event structures. Choose tools built specifically for mobile subscriptions to avoid data accuracy issues.
Conclusion: Building a metrics-driven subscription business
Millions of mobile applications deliver value to users worldwide. Advanced subscription metrics help you get closer to customers' needs and build products that earn sustainable revenue. Auto-renewal rates, net revenue retention, revenue source breakdown, refund rates, and cohort retention curves work together to reveal the full health of your subscription business. Basic metrics like total subscribers or monthly revenue only tell part of the story.
Start by establishing baseline measurements for each metric. Track them consistently for at least 90 days to understand your normal patterns. Identify your weakest metric and focus improvement efforts there first. Remember that depending on your app category and business model, benchmarks vary. Compare against category-specific standards rather than cross-industry averages.
Monitor both platform-specific and combined metrics to understand where opportunities exist. With dedication to tracking these advanced metrics, you'll build a predictable, growing subscription business that delivers consistent value to users while generating sustainable revenue for your app.