If you want to answer questions like how many users might be potentially looking for a mobile app like yours, how many of those you could actually cater to, and just how many of them you can actually convert, you’ll find your answers with market sizing.
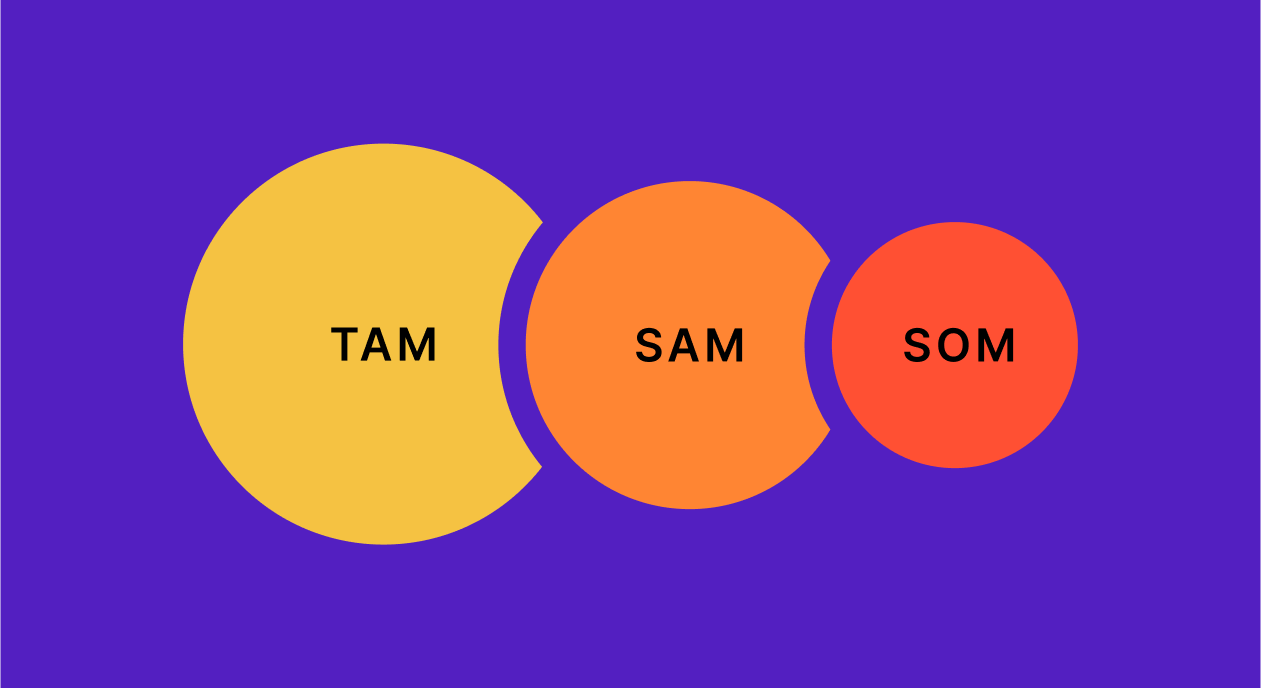
And at the core of market sizing lie TAM (Total Addressable Market), SAM (Serviceable Addressable Market), and SOM (Serviceable Obtainable Market) analyses. TAM, SAM, and SOM analyses give you insights that can help you:
- Set realistic goals for your mobile app.
- Plan sales and marketing strategies.
- Adjust them as needed for sustainable growth.
So let’s understand TAM, SAM, and SOM analyses, how they apply to mobile apps, and how to calculate them!
Here goes.
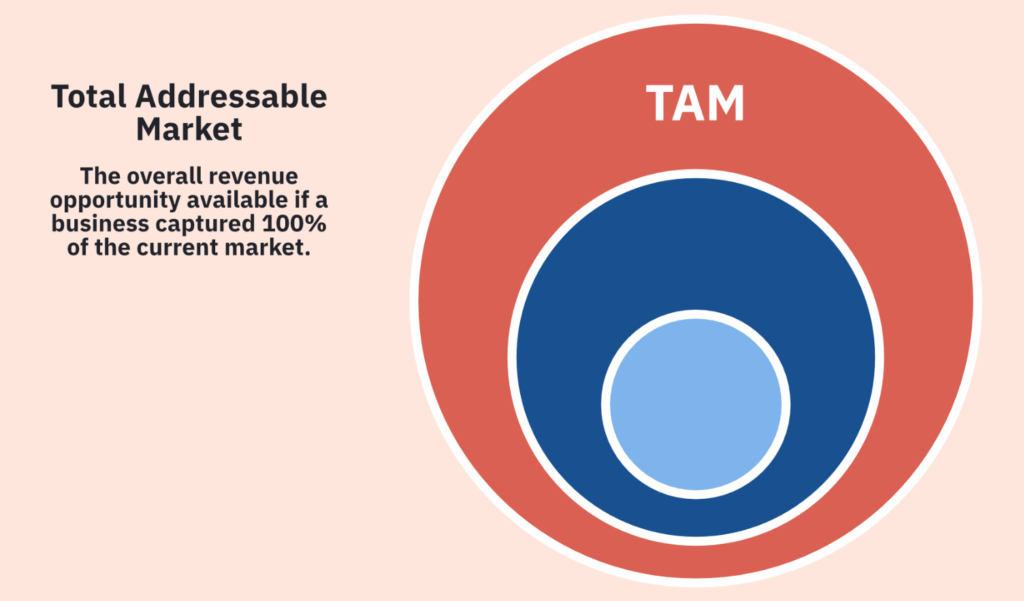
What is TAM?
TAM – Total Addressable Market or Total Available Market – represents the market or “opportunity” available for your mobile app. For example, if you’re looking to launch a meditation mobile app, then your target market comprises people going through all kinds of conditions like stress, anxiety, and depression. You’re also looking at people looking for better mental health or mood. Finally, you’ll also cater to users specifically seeking help with mindfulness therapies like meditation.
As you can see, you zoom out when you look at TAM. For example, the revenue potential for a meditation mobile app, if it captures the whole TAM, would be 7.25 billion U.S. dollars by 2033, according to Statista. Because that’s how big the market for meditation apps is projected to get.
On a side note, when you want to perform TAM analysis, tapping resources like Statista and industry publications can help a lot. They offer the latest data and projections, which is enough at the TAM stage.
Back to TAM… So, as you can see, you aren’t very concerned about any granular details when working with TAM. In general, TAM tells you three things:
- TAM tells you your app’s overall opportunity. When planning a new app, you want to be sure there’s a market for it. TAM tells you just that. When performing TAM analysis, it’s important to remember that TAM doesn’t use any filters, so the market size it suggests isn’t your actual market. SAM helps define the actual market, as we’ll see in the next section.
- TAM, by itself, is too broad. Because TAM looks at the market theoretically, it’s crucial to consider SAM along with it, which provides a more realistic view of your app’s potential market .
- TAM tells you how your target market could look if your app evolved into a more mature solution. Adding PAM – Potentially Addressable Market – analysis on top of your TAM analysis can give ideas as to how your app could have a bigger target market than you initially estimated. For example, if, at some point, this meditation app from our example expanded to include online therapy, then this app could target even more users.
How to calculate TAM?
TAM represents the total revenue opportunity if your app captured 100% of the market with zero competition. There are three primary methods to calculate it:
Method 1: Top-down approach
TAM = Total industry revenue × Relevant segment percentage
This method starts with broad industry data from market research reports and narrows down to your specific segment.
Example — Meditation app:
- Global wellness apps market = $11.27 billion (2024)
- Meditation segment = approximately 20% of wellness apps
- TAM = $11.27B × 20% = $2.25 billion
Method 2: Bottom-up approach
TAM = Total potential customers × Average revenue per user (ARPU)
This method builds from your specific pricing and customer data upward. It’s more accurate but requires more detailed assumptions.
Example — Meditation app:
- Global smartphone users interested in wellness = ~500 million
- Average annual subscription price = $50
- TAM = 500M × $50 = $25 billion
Method 3: Value theory approach
TAM = Value created × Portion capturable as revenue
This method focuses on the unique value your product provides versus existing alternatives. It’s particularly useful for disruptive products or entirely new categories where traditional market data doesn’t exist.
Example — AI-powered therapy app:
- Traditional therapy costs ~$150/session × 50 sessions/year = $7,500/user
- Your app provides 30% of that value at 5% of the cost
- Value created = $7,500 × 30% = $2,250 per user
- If you capture 10% of that value: ARPU = $225/year
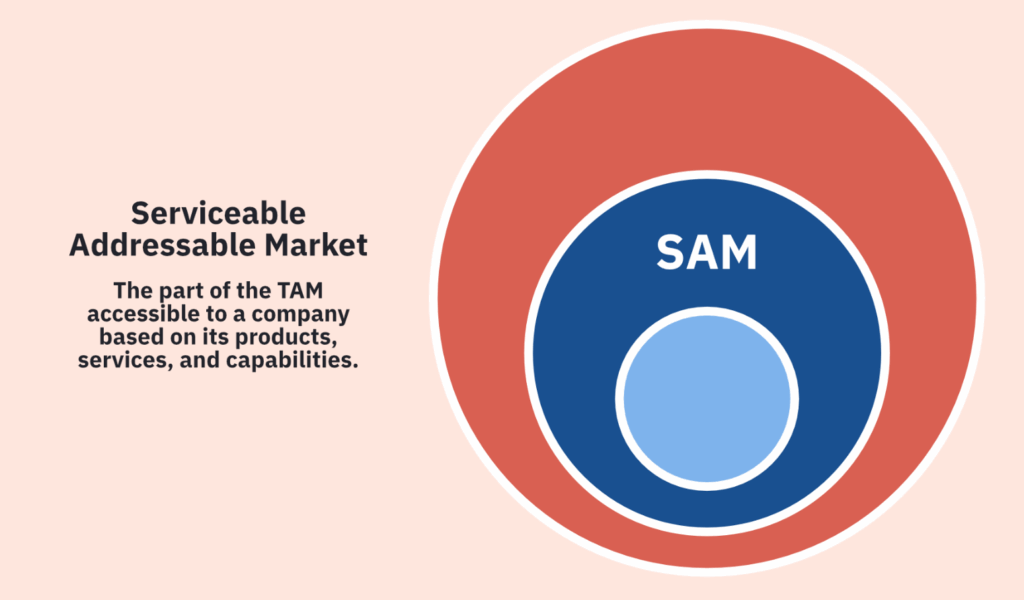
What is SAM?
SAM – Serviceable Addressable Market or Serviceable Available Market – represents the market that you can actually target. To arrive at SAM, you apply filters to your TAM analysis and eliminate user populations that TAM included in your addressable market, but that don’t really belong to it.
Let’s return to our meditation app example. Here are a few considerations we’d use for deducing the actual Service Addressable Market from its Total Addressable Market:
- Suppose this app is to be available only in the U.S. This means the app’s TAM shrinks to represent the market available in the U.S. alone.
- Since this app only offers meditation, filtering at the feature level makes sense. For example, SAM would be the subset of the total U.S. population actively seeking or using a meditation app. So you might want to consider 12% of the total U.S. population to be your SAM, as this population uses a mobile app to help with meditation. (Note: Again, resources like Statista help with SAM analysis.)
- Next, let’s say this is an iPhone app. This further excludes Android users from the growth calculations.
You get the drift.
Your SAM is always a small percentage of your TAM. And in one way, your SAM is actually your TAM, because, in reality, it is the one that truly represents the available market. Also, while there’s no industry standard, some resources claim SAM to be generally about 1-10% of TAM.
- Depending on your app, you can have a small or big SAM, but a small SAM isn’t necessarily a problem. A niche app will naturally have a much smaller SAM than apps targeting broader populations.
- SAM helps you frame your monetization model. If you have a niche app, you’re looking at a significantly small addressable user population or SAM. This means even if you reach a respectable user base, you’ll still not be looking at hundreds of thousands of users. If you use a strictly subscription-based monetization model for such an app, then you may limit your revenue potential. A hybrid monetization model could offer a better average revenue per user… and increase revenue.
- SAM evolves as your app evolves. As you start offering your app through additional channels (for example, adding your app to the Play Store, too, after initially only launching it in the App Store), regions, or languages, your SAM expands. Not just that, even if your app evolves into something bigger – for instance, if you start as a meditation app and eventually grow to become a full mindfulness app – you’ll see that your addressable market increases, too.
How to calculate SAM?
SAM narrows TAM to the portion your product can actually serve based on your capabilities, geographic focus, and product features.
SAM = TAM × Filter₁ × Filter₂ × Filter₃ × … × Filterₙ
Common filters to apply:
- Geographic filter — What regions/countries do you serve?
- Platform filter — iOS only? Android only? Both?
- Language filter — What languages does your app support?
- Demographic filter — Age, income level, specific user segments
- Feature filter — Which specific use case does your app address?
Meditation app example:
| Step | Filter Applied | Result |
|---|---|---|
| Start with TAM | — | $2.25 billion |
| Apply geographic filter (US only) | × 37% | $833 million |
| Apply platform filter (iOS only) | × 56% | $466 million |
| Apply demographic filter (adults 25-54) | × 60% | $280 million |
| Final SAM | — | $280 million |
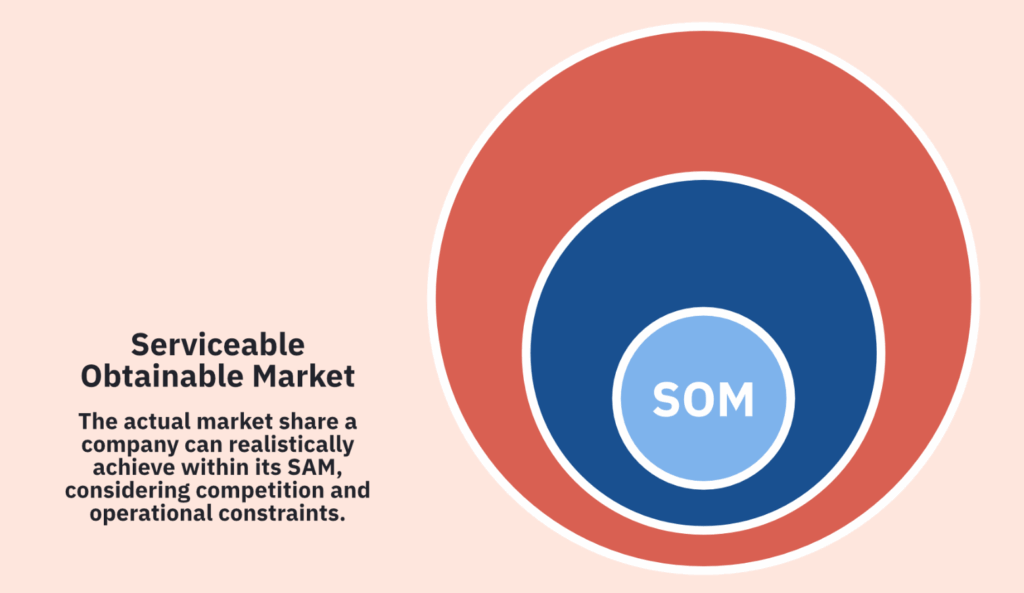
What is SOM?
SOM – Serviceable Obtainable Market – represents the market that you can actually expect to target to convert. To calculate your SOM , you would need to consider factors such as market trends, the competitive landscape, and potential customer interest in your specific app. Unlike SAM, SOM considers your business’s realistic constraints and limitations, such as budget, resources, and capabilities. By understanding your SOM, you can set more achievable and accurate revenue goals for your mobile app.
For our meditation app example, estimating SOM would mean looking at the following factors:
- The app’s competitive landscape: The most popular apps in any niche own most of the market share and revenue. So to start with, especially if you’re going after a competitive, money-making app niche, you need to understand the market share that you can realistically capture, given the shares that the most popular apps already own. If 95% of your app’s SAM already uses a leading meditation app for their meditation, you’re looking at a much smaller market. Factoring in the competition helps you calculate your SOM more realistically.
- Your marketing bandwidth. With SAM analysis, you’ll know exactly the market you can reach. But your marketing bandwidth plays a role in whether you can effectively reach the identified market share. If you have limited resources for marketing, your SOM may be smaller than initially anticipated.
- Consumer behavior. Your market’s buying behavior also influences you SOM. To estimate SOM, you must know what percent of your identified market will be willing to spend money on a mobile app (as that’s the share you’re after). Looking at the share of paying users across your niche can help estimate this. You’d need to understand your market’s general retention patterns as they tell how loyal your market can be. You might have to invest in research to find these out.
Macro trends would be another important consideration. Macro trends can also impact your estimation of SOM, as shifts in the economy or industry can affect consumer spending habits. It’s important to consider these external factors when projecting your market share.
How to calculate SOM?
SOM is the realistic portion of SAM you can capture given competition, resources, and time constraints. This is your actual revenue target.
SOM = SAM × Realistic market share %
Or using bottom-up:
SOM = Reachable customers × Conversion rate × ARPU
Factors that determine realistic market share:
- Competitive landscape — How much market share do incumbents hold?
- Marketing budget — What’s your customer acquisition capacity?
- Product differentiation — How unique is your offering?
- Time horizon — Year 1 vs Year 3 vs Year 5
- Team capabilities — Sales, marketing, product development capacity
Meditation app example:
| Scenario | SAM | Market Share | SOM |
|---|---|---|---|
| Year 1 (New entrant, limited budget) | $280 million | 1% | $2.8M |
| Year 2 (Growing, product-market fit) | $280 million | 2.5% | $7M |
| Year 3 (Established, strong brand) | $280 million | 5% | $14M |
| Year 5 (Market leader in niche) | $280 million | 10% | $28M |
Alternative: Bottom-up SOM calculation
- Marketing budget: $500,000/year
- Cost per install (CPI): $2.50
- Installs achievable: $500,000 ÷ $2.50 = 200,000 installs
- Trial conversion rate: 8%
- Trial-to-paid conversion: 50%
- Paying users: 200,000 × 8% × 50% = 8,000 subscribers
- Annual subscription price: $60
- SOM = 8,000 × $60 = $480,000 Year 1 revenue
TAM → SAM → SOM calculation example (Fitness app)
| Level | Calculation | Result | % of previous |
|---|---|---|---|
| TAM | Global fitness apps market | $13.59B | — |
| Filter: North America only (38%) | $5.16B | 38% | |
| Filter: iOS users (56% in US) | $2.89B | 56% | |
| Filter: Women 25-45 (target demo, 30%) | $867M | 30% | |
| SAM | Filter: Subscription willingness (40%) | $347M | 40% |
| SOM Y1 | New entrant market share (1%) | $3.47M | 1% |
| SOM Y3 | Established player market share (5%) | $17.35M | 5% |
Market sizing for a mobile app using TAM, SAM, and SOM analyses
Adding TAM, SAM, and SOM analyses to your app marketing forces you to critically evaluate constraints like your funding and competition, allowing you to set realistic goals. These analyses also help position your app for sustainable growth by avoiding reliance on generalizations.
TAM, SAM, and SOM analyses continue to offer value even as your app evolves. As your app grows, you might see that your SOM is growing to include more of your SAM — for example, when more users learn about your app.
Not just that, you might even decide to optimize your SAM by offering your app in more languages — by expanding to non-English speaking markets, for instance.
You may also discover that your TAM is larger than initially anticipated, leading to new opportunities for expansion.
In all, TAM, SAM, and SOM analyses can give a roadmap for strategic decision-making at all stages of an app’s growth funnel.
Let’s now see how you can perform TAM, SAM, and SOM analyses for your app.
Common mistakes in TAM/SAM/SOM analysis
Even experienced founders and analysts make critical errors when sizing their market. Here are the most common mistakes and how to avoid them.
Mistake #1: The “1% of a huge market” fallacy
Problem: Claiming “we just need 1% of a $100 billion market” without explaining how you’ll capture that 1%. This is a red flag for investors because it suggests you haven’t thought deeply about your go-to-market strategy.
Fix: Build your SOM from the bottom up. Calculate how many customers you can realistically reach, convert, and retain with your actual resources. Then verify this maps to a reasonable percentage of your SAM.
Mistake #2: Mixing geographic scopes
Problem: Using global TAM figures but then calculating SAM for a single country, creating an inconsistent and misleading picture.
Example of the mistake:
- TAM: “The global fitness app market is $13.5 billion”
- SAM: “We’re targeting US iOS users aged 25-40”
- Problem: These numbers don’t connect logically
Fix: Be explicit about geography at every level. If your TAM is global, show the calculation path to your regional SAM. Or start with regional TAM if that’s your focus.
Mistake #3: Ignoring competition in SOM
Problem: Calculating SOM as if you’re entering an empty market. In reality, incumbents often control 70-90% of established markets.
Reality check for meditation apps:
- Calm: ~45% market share
- Headspace: ~25% market share
- Other established players: ~20% market share
- Realistic opportunity for new entrant: competing for remaining ~10%
Fix: Research competitive market share. Factor in user switching costs, brand loyalty, and network effects. Your Year 1 SOM in a competitive market might be just 0.5-2% of SAM.
Mistake #4: Using outdated data
Problem: Citing market research from 3-5 years ago. Mobile markets evolve rapidly — data from 2020 may be completely irrelevant in 2025.
Fix: Use data from the past 12-18 months maximum. Cite your sources and publication dates. If only older data exists, acknowledge this limitation and explain how you’ve adjusted for market changes.
Mistake #5: Conflating users with revenue
Problem: Stating “there are 500 million potential users” as your TAM without converting to revenue terms. Users aren’t revenue — only paying users are.
Fix: Always convert user numbers to revenue. Account for conversion rates (typically 1-5% for freemium apps), ARPU, and retention. “500 million users” becomes much smaller when you multiply by 2% conversion and $30 ARPU.
Mistake #6: Forgetting unit economics
Problem: Projecting a $10M SOM without checking if you can profitably acquire those customers. If your CAC exceeds LTV, your SOM is theoretical, not practical.
Fix: Verify SOM against unit economics. Calculate: Can you acquire customers at a CAC that’s less than 1/3 of their LTV? If not, your SOM may be overstated or your business model needs adjustment.
Mistake #7: Static SAM thinking
Problem: Treating SAM as fixed when it can expand significantly as your product evolves, enters new markets, or adds languages.
Fix: Model SAM expansion over time. Show how adding Android, expanding to Europe, or launching Spanish localization increases your addressable market. This demonstrates strategic thinking to investors.
Mistake #8: Cherry-picking favorable reports
Problem: Only citing the most optimistic market research while ignoring more conservative estimates.
Fix: Cross-reference multiple sources. When reports differ significantly, acknowledge the range and explain which estimate you’re using and why. This builds credibility.
Mistake #9: Not validating top-down with bottom-up
Problem: Using only one calculation method. Top-down often overestimates; bottom-up can underestimate if you miss customer segments.
Fix: Calculate both ways and compare. If top-down says $50M and bottom-up says $5M, investigate the 10x gap. The truth is usually somewhere in between, and the analysis reveals your assumptions.
Mistake #10: Presenting numbers without sources
Problem: Stating “the market is $5 billion” without citing where that number comes from. Investors will question unsourced claims.
Fix: Always cite sources with publication dates. Use reputable sources: Statista, Sensor Tower, Grand View Research, industry associations, government data. Be prepared to defend every number.
Wrapping it up…
Conducting thorough TAM, SAM, and SOM analyses helps you realistically understand your app’s growth potential. For many niche apps, calculating TAM, SAM, and SOM might show that the app may only reach a few thousand subscribers, which isn’t a bad thing at all if the market is actually willing to commit to subscriptions.
But remember that these numbers can change over time as the market evolves and user preferences shift. It’s important to regularly reassess and update your market sizing analysis.
And as we saw, the bottom-up approach tends to be more accurate. Since the bottom-up approach to estimating your TAM, SAM, and SOM needs your user spending behavior data, consider adding a revenue analytics solution like Adapty to your app. This way, you’ll get a really accurate picture of your SOM and eventually your SAM and TAM. Check out Adapty.