Cohort analysis for mobile apps: How to reduce churn rates

Cohort analysis is an analytical method that unlike general tracking of metrics allows one to see the behavior of various groups of users more clearly. It reveals if buying traffic was profitable if product changes affect users’ engagement in a positive way, and if marketing activities led to better monetization or not.
In this article, you will:
- learn what “cohort analysis” and “cohorts” are and how they are formed;
- consider how cohort analysis shows whether ads give their payoffs or not;
- consider a detailed example of cohort analysis;
- get acquainted with the tool that Adapty has developed for its subscribers.
What is cohort analysis?
Cohort analysis is one of the methods for researching consumer behavior. It shows the behavior of particular groups of people (cohorts) who have performed a certain action in a certain period.
The main feature of this analysis is that, unlike conventional graphs, cohorts show exactly the retention of users distributed over time intervals.
Sounds a bit complicated, right? But in reality, everything is much simpler. Therefore, to evaluate its work visually, we will consider the cohort analysis using an example of implementation in Adapty:
In order to properly conduct a cohort analysis, you need to define the criteria by which you want to form your cohorts and metrics by which you would like to evaluate cohorts.
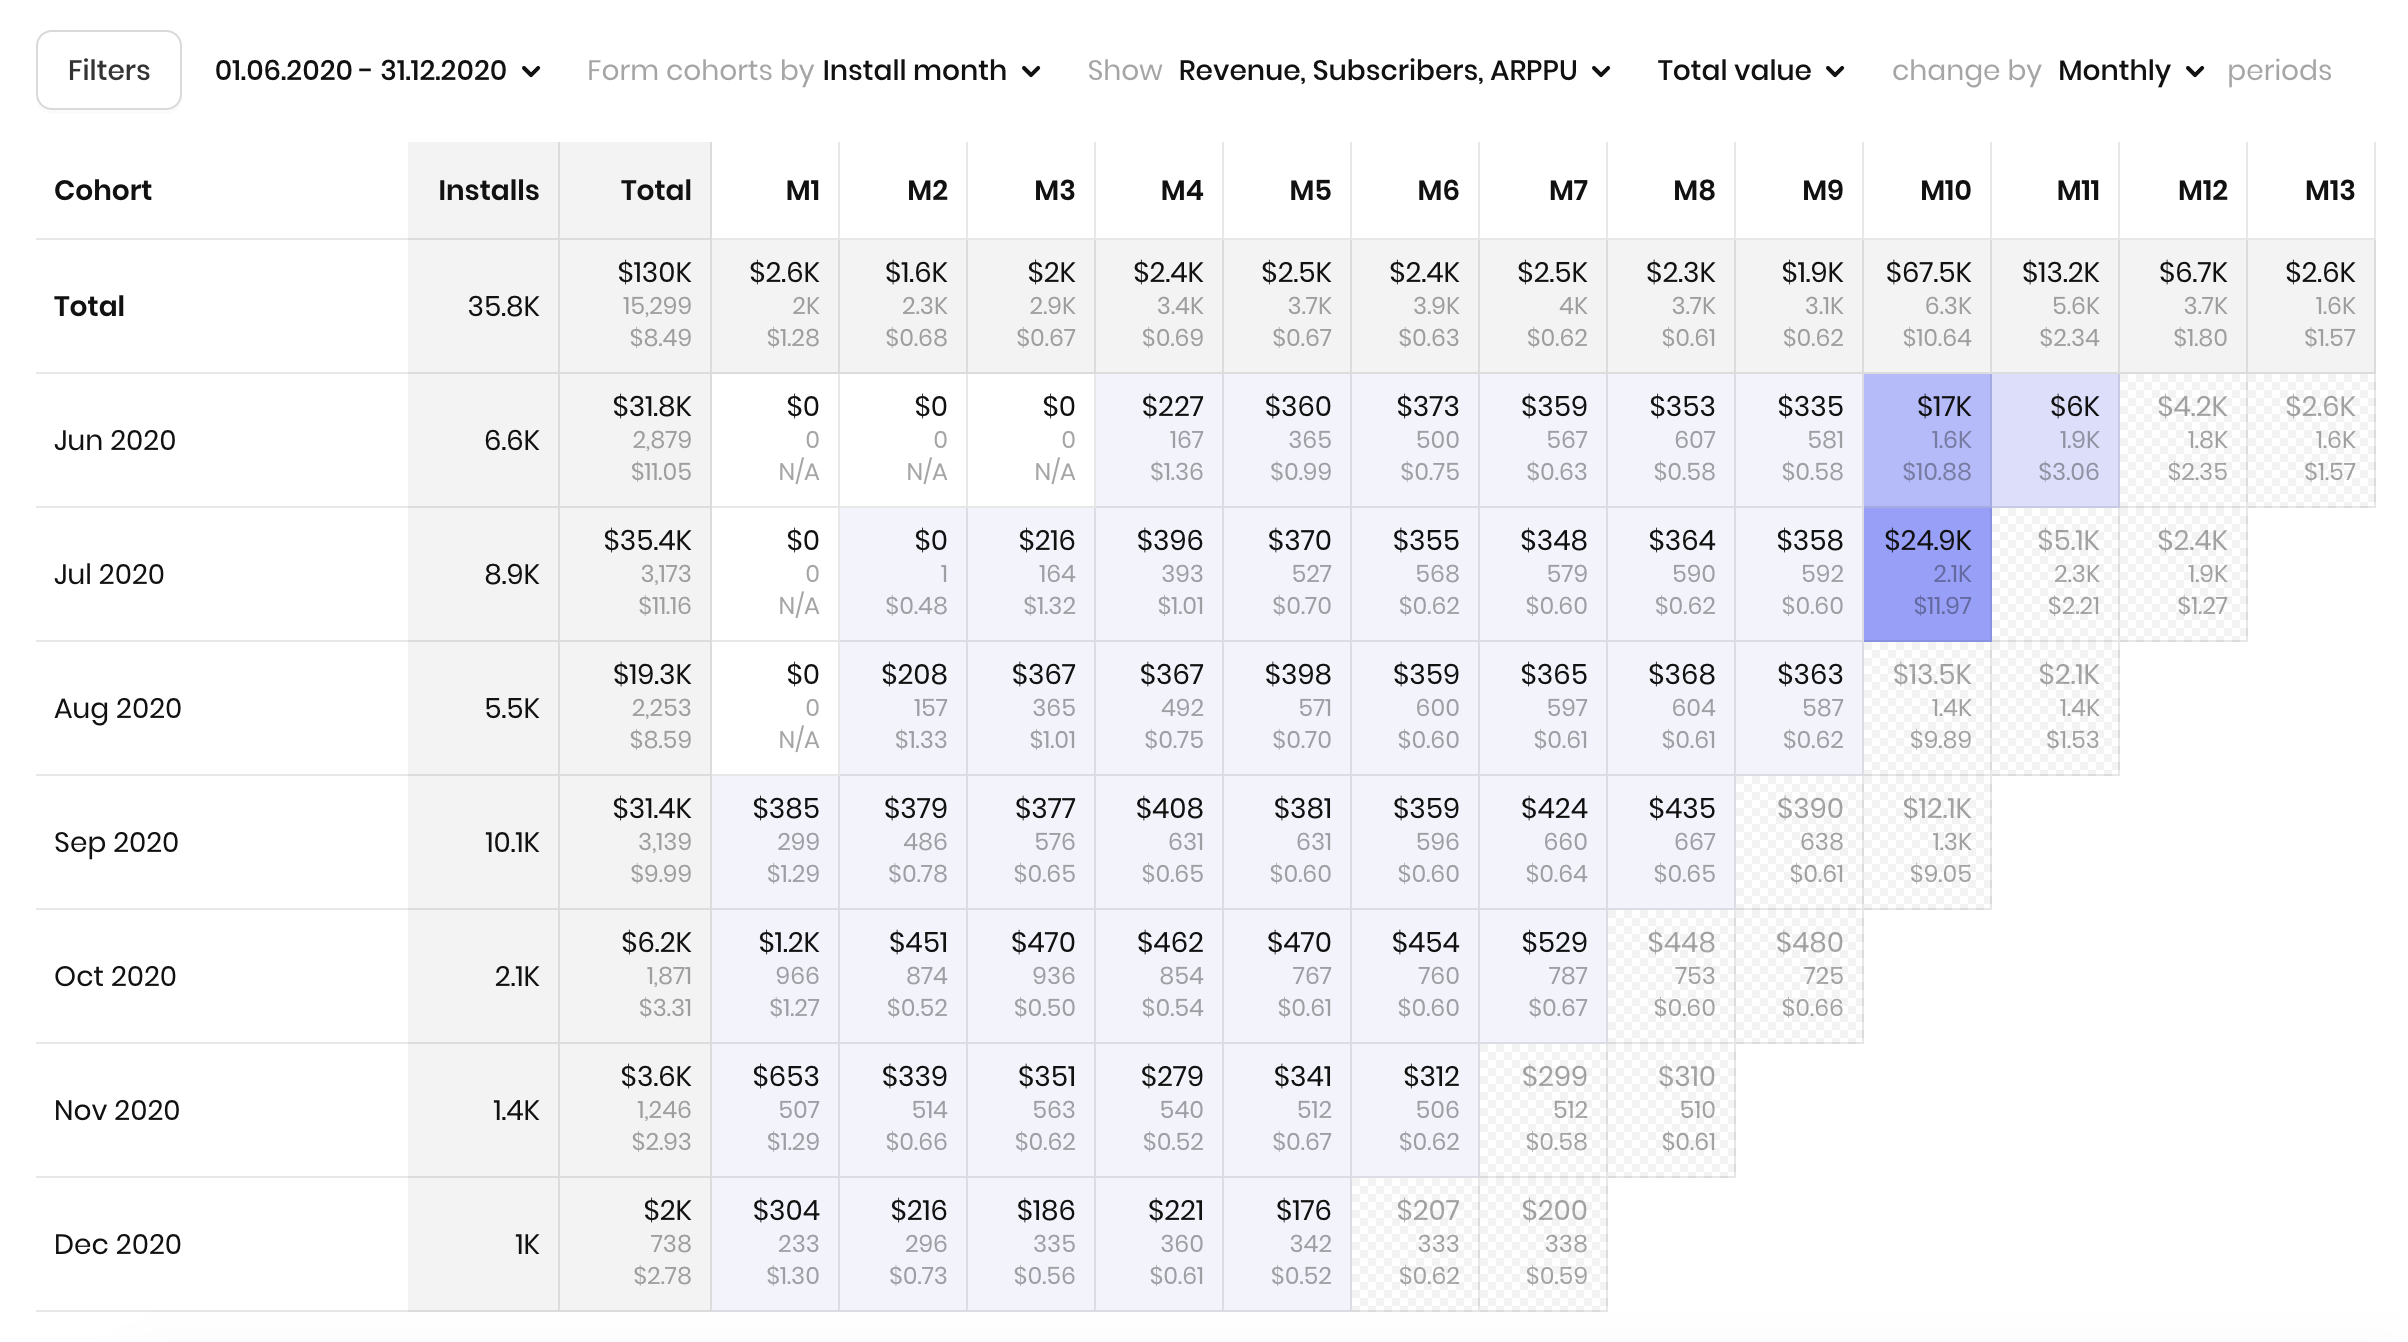
In our case, cohorts are formed according to the month of installation. Revenue, amount of subscribers, and average revenue per subscriber for each month (ARPPU) are shown in the cells:
The lines show the cohorts (groups) of users who installed the application in a certain month, and the columns show the metric values for each month from the installation month (this is the first month or M1). In the highlighted line M1 is January, M2 is February, and so on. As we can see, the number of subscribers in this cohort does not increase every month. Even if the user installed the application in January and subscribed in February, they will be assigned to the January cohort. We believe that this method of analysis helps to assess the convergence of all data correctly.
The main idea behind evaluating the economy this way is based on how user acquisition works. When the developers purchase ads, they pay for installs, not for target actions. Even in CPA campaigns, everything is related to the cost of installation (CPI). Hence, to assess the effectiveness of buying traffic, you need to look at the size of income that people, who installed the application during this period, will generate.
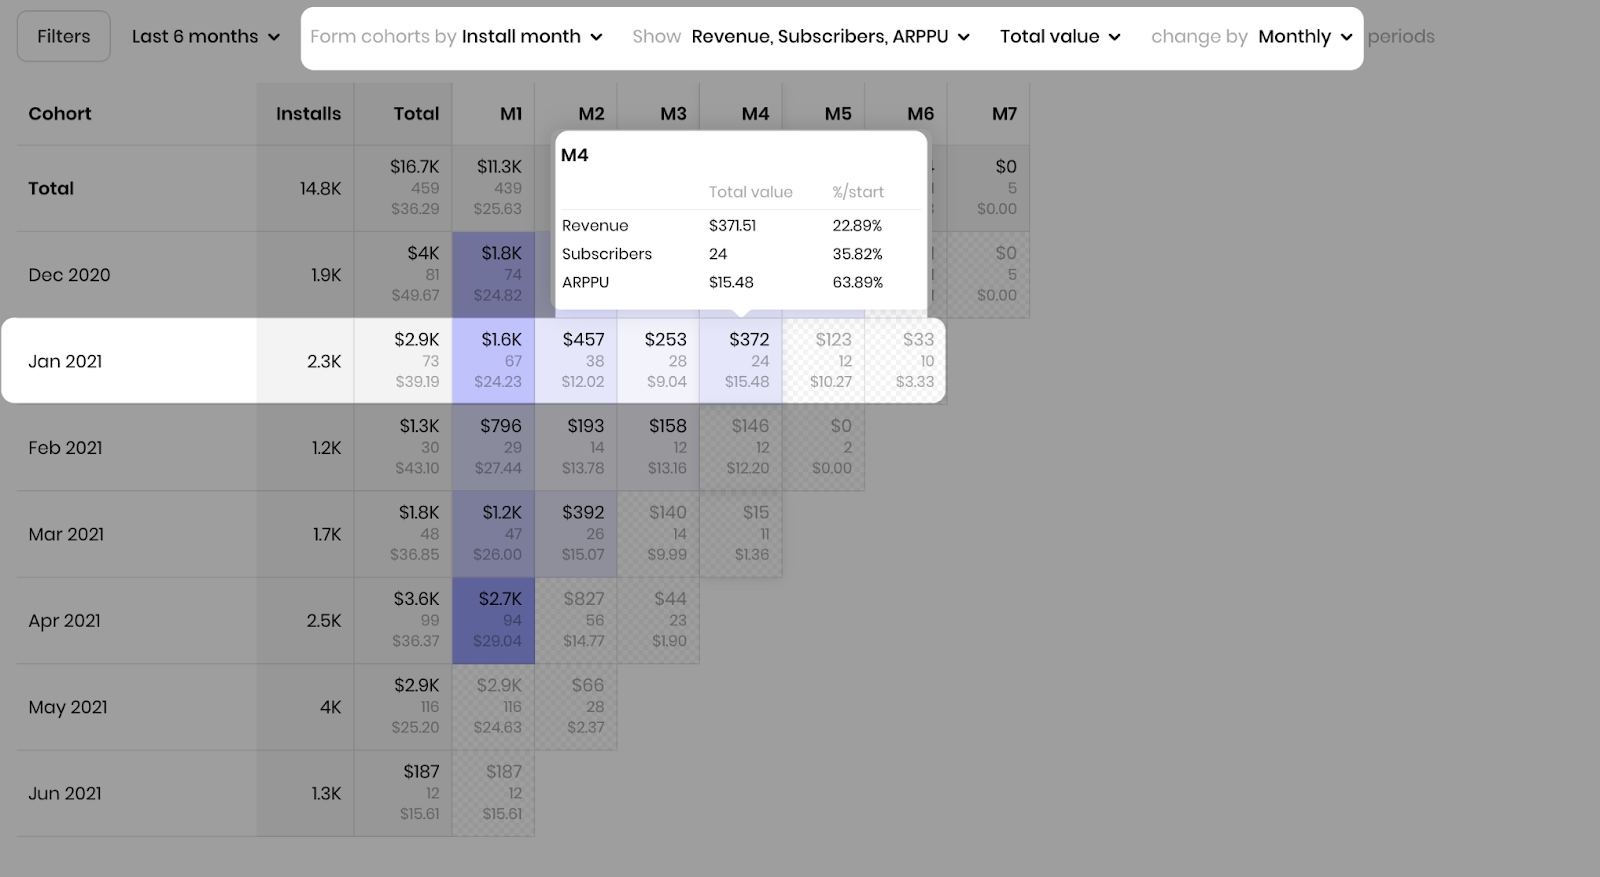
As we see on the graph, the cohort of January users brought us a total of $2900 in revenue from 73 subscribers up to date:

Then the dynamics of the cohort decay is observed, i.e. how quickly users unsubscribe. In January we had 67 subscribers, but in February we had 38, and in June there were only 10 left (a shaded cell means that subscribers can still be added since the month is not over).
Will the finances balance?
For example, we paid $4000 for advertising in January. We are faced with the following question — “will users pay off or not?”. In other words, will the proceeds from them be more than $4000 in the nearest future?
Let's take a closer look at the dynamics of subscribers in the January cohort.

So far, the app has earned $2900 before Apple's commission, or $2465 after deducting 15% (the app is in Apple's SMB program). We will also assume that we sell weekly subscriptions for an average of $10.
We see that the number of active subscribers falls by almost 2 times after the first month, then by 20%, then by only 10% to 24 people. Since at the time of writing the article the month has not yet ended, let's take the best scenario – let all 24 subscribers be with us forever. And even if they continue to pay an average of $15.48, their ARPPU will not change.
To recoup the initial advertising payment (our $4000) you need subscribers to pay more than $1500. Even with a monthly profit of $372 and zero unsubscription, the cohort will pay off at best after 4-5 months of continuous payments.
In practice, taking into account the previous dynamics, and knowing that traffic is bought evenly, the cohort is unlikely to pay off in less than a couple of years, and in fact, it will most likely be at a loss. The reason lies in the fact that weekly subscriptions constantly remind of themselves and users are less likely to stay in long-term payments because if the application is good, it is much more profitable to buy a year subscription. But even with monthly subscriptions with such dynamics, one can hardly expect a positive profit.
How to best evaluate forecasts – Subscription Calculator by Adapty
Balancing of the subscription economy is a long-term process. That is why, for your convenience, Adapty has developed its Subscription Calculator. It will help you check if the finances will balance according to your digital data and find out how much you can earn from your application. This tool will perfectly complement your work with cohort analysis.
Follow the link and try it now!