Mobile app subscriptions in 2023: Market trends and monetization strategies in the US

Since the launch of the App Store and Google Play, the mobile app market has undergone numerous changes that made app developers alter their monetization strategies and constantly search for new ways of making their apps bring as much profit as possible. New regulations, policies, and software updates that come from Apple and Google annually (or even more frequently) pose new challenges in the way of proper engagement with the user, while the general state of economics also intensely affects the pricing point of app production and promotion. All these aspects greatly affect the market and result in having to come up with drastically different approaches to running the app business from year to year.
That’s why we’re proud to present you with the state of in-app subscriptions in 2023 for the US market. In this report, we’ve tried to answer most of the questions regarding the current situation in the mobile app subscription market, demonstrate in detail the relevant metric charts, as well as provide insights and even benchmarks you could use to properly adjust your monetization strategy. Let’s discuss a few takeaways from the report and the problems behind it, in order to see which aspects of work with subscriptions were affected the most in 2022-2023.
The US mobile app subscription market still remains the largest
Undoubtedly, the US remains at the forefront of the mobile app subscription market, cementing its position as the largest and most lucrative market for subscription-based services. The country's tech-savvy population, high smartphone penetration, and widespread access to high-speed internet contribute to its continued dominance. Our research shows that the US accounts for an impressive 51% of all mobile app subscriptions, a testament to its dominance in the digital economy.

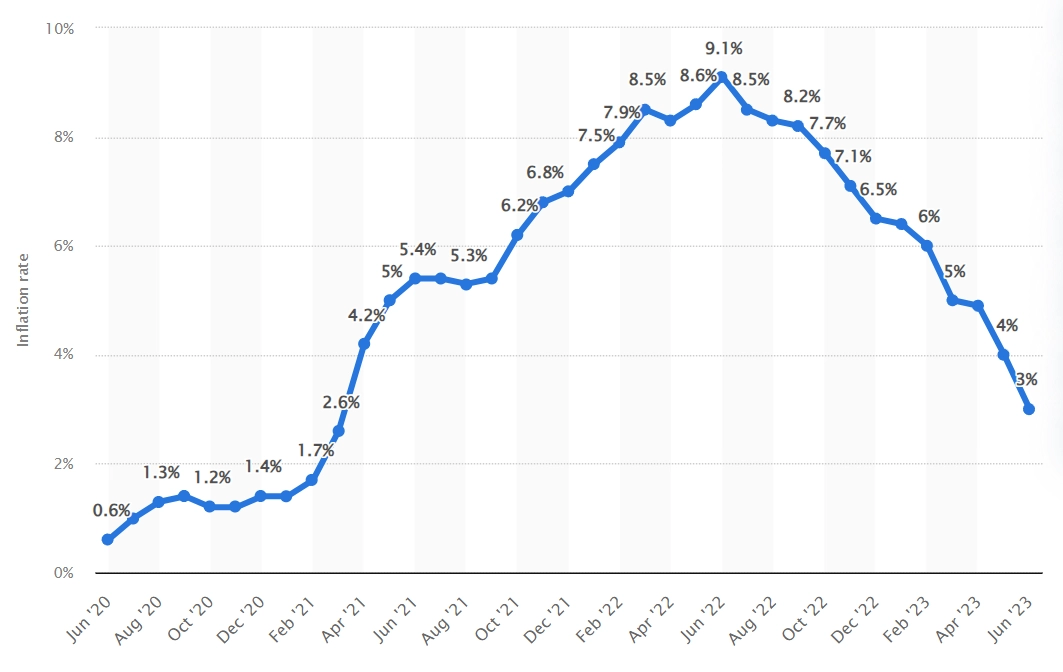
The mobile app subscription market in the United States continues to thrive as the nation remains the largest and most influential player in this sector. However, the market is not without challenges, particularly in light of macroeconomic difficulties and an inflationary surge that has impacted consumer behavior and pricing strategies.
Average subscription price changes
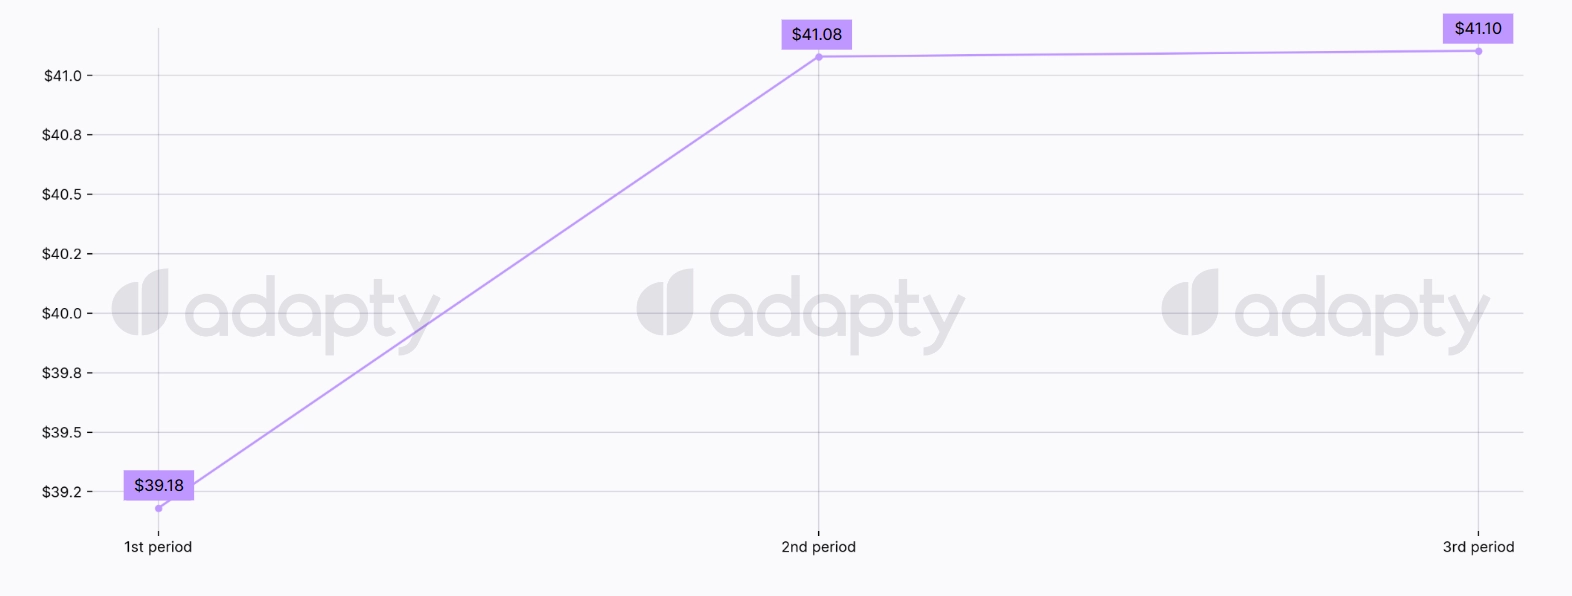
With expenses on ads, user acquisition, ASO, and other kinds of promotion getting subsequently higher, app developers and publishers are forced to adjust their pricing strategies in response to the changing economic conditions and cost pressures. As a result, the market sees the average monthly growth in subscription prices across all tiers. It’s a natural market response.
Increasing the subscription price of a mobile app can have potential benefits for developers, but it's essential to carefully consider the implications and make informed decisions. By employing thoughtful strategies and communication, you can minimize negative impacts and improve the chances of a successful price adjustment. So make sure to check the latest price benchmarks and detailed charts for the US market in our report to get on the right track and not harm your app's economics.
Changes in the Lifetime Value (LTV) of subscriptions
Another vital element of app economics is Lifetime Value (LTV) – the average revenue a customer generates in their lifespan. This metric is supposed to give you a few ideas on how much you can spend on your app without being afraid of having more expenses than profits. Having knowledge of the average LTV of your customers is crucial for executing successful marketing strategies.
Considering subscription price growth trends we also calculated current LTV metrics for different subscription durations. One of the insights shows that annual subscriptions are still in the lead with the highest LTV. This is likely due to the higher retention rates and customer loyalty associated with annual subscriptions. See the insights and charts for weekly and monthly subscriptionsin the report and use this information to decide which products are worth keeping on your paywall these days.
The profitability of paywall combinations
Speaking of paywalls, it’s always a dilemma of which products to offer. Unless you use Adapty to run A/B tests and already know what works best for your audience. Nevertheless, subscription price changes and other trends in economics directly influence the user’s choice. It means that apart from pricing your subscriptions properly, it’s important to understand which products are more profitable to offer, and in what quantity.
The accumulated data allows us to clearly see which paywall product combinations work best for US customers. An astounding result shows the one-product paywall, which turns out to be the least attractive for users. This may either imply that customers like to have a choice and feel like they’re actually making an important decision, or it’s simply the result of price anchoring working the way it was intended to. Learn which product combination is the most profitable in our free research and check if you’ve been using the right kind of paywall this whole time.

Check out more insights and charts in the full report
We’ve shed some light on the trends and tendencies taking place in the current US mobile subscription market, but it’s just a small piece of what we’ve managed to gather in our study. Make sure to check out the full version of the report, where you’ll find numerous insightful charts showing how to price different kinds of subscriptions, which number of products to use on your paywall, as well as providing you with fresh data on refund and retention rates, LTV, and much more.