Month-over-month growth: calculator and formula

When measuring your mobile app's performance, many metrics — including conversion rates, retention rates, and monthly active users — are best measured month over month.
Tracking these metrics monthly and comparing their performance over time helps you tie changes to the strategies you tried during those periods and understand what's working. If something seems effective, you can check if it's repeatable and use it to secure short-term wins. Averaging month-over-month performance over a reasonable timeline also helps you understand how your app is growing, set realistic growth goals, and make accurate projections.
In this guide, we will explain what month-over-month growth means, how to calculate it using the MoM formula and the compound monthly growth rate (CMGR), common pitfalls to avoid, and which metrics matter most for mobile apps. We will also compare MoM analysis to other time-based growth metrics and answer the most frequently asked questions.
What is the month-over-month growth rate?
The month-over-month (MoM) growth rate measures how a specific metric changes from one month to the next, expressed as a percentage. It can be applied to virtually any measurable value: revenue, user count, monthly active users (MAU), conversion rates, churn, or any other KPI relevant to your business.
MoM growth rates are widely used across industries and business functions. Finance teams monitor MoM changes in revenue and costs. Product teams track feature adoption and engagement. Marketing teams measure leads, conversions, and campaign performance. For mobile apps specifically, MoM analysis is essential for evaluating strategies across every stage of the user acquisition and monetization funnel.
The MoM metric is distinct from longer-term growth measures like quarter-over-quarter (QoQ) or year-over-year (YoY) because it provides a more granular, short-term view. This granularity makes it ideal for detecting recent shifts, testing hypotheses quickly, and making agile decisions.
Benefits of month-over-month growth analysis
MoM growth analysis works great for managing short-term growth
When you want to grow your mobile app, especially if it is new, you need to work on multiple channels — from ASO and SEO to referral marketing and paid ads. Many of these strategies produce results within weeks. When you track your month-over-month metrics, you can easily tie your growth to your sales and marketing operations. Knowing what works helps you sustain your business in the short term. This is especially true when you measure your returns against the investment you make, for instance, looking at user acquisition while monitoring your acquisition costs.
MoM growth analysis enables agility
Month-over-month growth rate analysis supports agile decision-making. You can fine-tune your sales and marketing operations and see their impact in just one month. This means you avoid spending resources on strategies with low returns. When a campaign underperforms, you catch it after four weeks instead of waiting for quarterly reviews.
MoM growth analysis helps identify trends and seasonality
When done right, month-over-month analytics can help you identify trends, spot seasonal patterns, make adjustments, and continuously improve your strategies for sustainable growth. Tracking MoM data over six to twelve months reveals recurring patterns — such as holiday-driven spikes or summer slowdowns — that help you plan campaigns and allocate budgets more effectively.
MoM growth analysis supports resource allocation
MoM growth data helps with resource allocation, allowing you to invest more in areas showing positive trends and address those with declining performance. For mobile apps, this can mean shifting budget between paid acquisition channels, doubling down on a high-performing paywall variant, or prioritizing retention improvements in months where churn spikes.
How to calculate month-over-month growth rate
The formula for calculating MoM growth is straightforward. Take the metric's value for the current month, subtract the value from the previous month, and divide the difference by the previous month's value. Since MoM growth is expressed as a percentage, multiply the result by 100.
MoM growth rate = ((Current month's value − Previous month's value) / Previous month's value) × 100
An alternative version of the same formula is:
MoM growth rate = (Current month's value / Previous month's value) − 1
The result will be a decimal, so multiply by 100 to express it as a percentage.
Use the calculator below to quickly compute both MoM growth and CMGR for any metric:
Month-over-month growth calculator
Calculate MoM growth rate, compound monthly growth rate (CMGR), and projected annual change.
MoM growth rate CMGR
Previous month's value
Current month's value
MoM growth —
Absolute change —
Annualized (if sustained) —
First month's value
Last month's value
Number of months
CMGR —
Total growth —
Projected 12-month value —
Formula: MoM growth rate = ((Current month − Previous month) / Previous month) × 100
Step-by-step calculation example
Let's say your app had 500 users in January and 750 in February. Your MoM growth rate is:
((750 − 500) / 500) × 100 = 50%
Now suppose you only had 500 users in March after reporting 750 in February:
((500 − 750) / 750) × 100 = −33.3%
This is negative growth, meaning the metric declined.
Finally, let's say you added 650 users in April after 500 in March:
((650 − 500) / 500) × 100 = 30%
Multi-month MoM calculation table
The table below shows how MoM growth rates are calculated across a full year, using active users as the example metric. This is the type of data table you should maintain when tracking your own MoM metrics.
| Month | Active users | Change | MoM growth rate |
| January | 10,000 | — | — |
| February | 11,000 | +1,000 | 10.0% |
| March | 12,600 | +1,600 | 14.5% |
| April | 14,600 | +2,000 | 15.9% |
| May | 16,800 | +2,200 | 15.1% |
| June | 19,200 | +2,400 | 14.3% |
| July | 21,000 | +1,800 | 9.4% |
| August | 22,500 | +1,500 | 7.1% |
| September | 23,500 | +1,000 | 4.4% |
| October | 23,300 | −200 | −0.9% |
| November | 23,800 | +500 | 2.1% |
| December | 24,600 | +800 | 3.4% |
In this example, the strongest growth occurred in spring (March through June), while growth began to slow in summer and dipped slightly in October. This pattern could reflect seasonality, a shift in marketing spend, or the natural deceleration that happens as a user base grows larger.
Common pitfalls when working with month-over-month growth rates
MoM metrics can fluctuate significantly
As the calculation examples above show, month-over-month metrics can swing dramatically. If you have a new app and are experimenting across different channels each month — perhaps a successful PR campaign in January followed by underperforming paid ads in February — the numbers each strategy produces will reflect directly in your MoM analysis and can skew the picture.
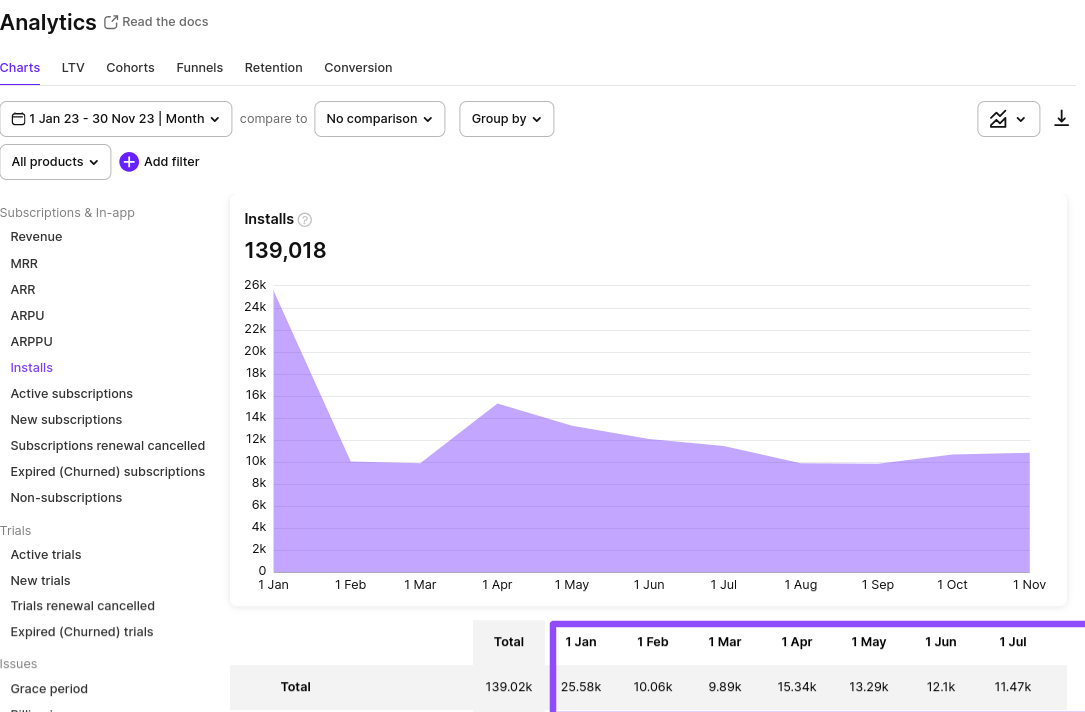
Below you've Adapty reporting an app's installs over 11 months. As you can see, the metric tends to fluctuate a lot when seen from month to month:
MoM metrics may not make sense at a small scale
If you start with 10 users in January and acquire 30 in February, you are looking at a 200% MoM growth rate. While technically correct, this figure is misleading because massive percentage growth is much easier to achieve with smaller numbers. As your base grows, maintaining such rates becomes exponentially harder.
To avoid this pitfall, report both the percentage growth and the absolute number changes. Use the compound monthly growth rate (CMGR) to smooth out fluctuations, and set realistic expectations as your user base expands.
Here you've Adapty reporting some great new subscription acquisition for an app for its first month. However, the trend doesn't seem to hold when seen month over month:

MoM metrics need the context of absolute numbers
Let's say your MoM growth rate is a steady 25% for a full year, but you only have about 1,000 users at the start. Even with that consistent rate, you would end the year with roughly 15,000 users. The percentage looks impressive, but the absolute numbers tell a different story. In most cases, MoM growth metrics can be misleading if reported without absolute values. Always present MoM alongside raw numbers for accurate reporting.
Below, you've Adapty reporting an app's revenue data. It seems the app started extremely well but then revenue began to drop. However, when you look at the actual numbers, the app is still making about $35,000 per month:
[IMAGE: adapty-reporting-an-apps-month-over-month-revenue-data — KEEP EXISTING IMAGE]
Mistaking linear growth for declining MoM growth
If your app consistently adds 1,000 new users per month — going from 10,000 to 11,000 (10% MoM), then 11,000 to 12,000 (9.1% MoM), then 12,000 to 13,000 (7.7% MoM) — the declining MoM percentage does not mean growth is slowing. The absolute gain is the same each month. This is linear growth, and describing it as "declining MoM growth" misrepresents your progress. Recognize this pattern and focus on absolute additions alongside percentage rates.
Compound monthly growth rate (CMGR): smoothing MoM fluctuations
Because month-over-month growth rates can be volatile, it is common to calculate the compound monthly growth rate (CMGR). CMGR represents the average MoM growth rate over a specified period, smoothing out individual monthly fluctuations caused by seasonality, one-off campaigns, or other irregularities.
CMGR formula
CMGR = (Final month's value / Initial month's value) ^ (1 / Number of months) − 1
For example, if you had 1,000 monthly active users at the end of January and 5,000 at the end of December (11 months later), your CMGR would be:
(5,000 / 1,000) ^ (1/11) − 1 = 15.47%
This means that on average, your user base grew by approximately 15.47% per month between January and December.
Using CMGR for projections with the future value formula
It is common to use CMGR to project growth. The future value formula is:
Future value = Current value × (1 + CMGR) ^ Number of months
Using the example above, if you want to estimate your user base after three more years (36 months) with the same CMGR:
5,000 × (1 + 0.1547) ^ 36 = approximately 700,000+ users
However, keep in mind that it is always easier to project growth using CMGR than to actually build a growth engine that sustains a consistent rate over a long period. Use these projections for planning, but remain realistic about execution.
Compound vs. linear month-over-month growth
Another concept that often comes up when discussing MoM metrics is the difference between compound (exponential) and linear growth.
Linear growth happens at a fixed absolute rate. For example, adding 1,000 users every month regardless of your current base. At the end of 12 months starting from 1,000, you would have about 13,000 users.
Compound growth means each month's growth builds on the previous month's total. If your user base grows at a steady 15% MoM rate starting from 1,000 users, you would have roughly 5,350 users after 12 months — substantially more than the linear scenario despite starting the same way.
Reviewing your MoM growth rate trend tells you which pattern you have. A declining trend in MoM growth rates — while absolute additions remain consistent — is a potential indicator of linear growth. While less dramatic than exponential growth, linear growth can still be a sustainable pattern for a mobile app. Knowing how you are growing helps you set realistic goals and accurate projections.
Month-over-month vs. other growth metrics
MoM is one of several time-based growth metrics. Choosing the right one depends on your analysis goals, the rate of change of the metric you are measuring, and how quickly you need to act on the data.
| Metric | Time frame | Best for | Limitations |
| MoM (month over month) | 1 month | Short-term trends, agile decisions, campaign impact | Volatile, affected by seasonality and one-off events |
| QoQ (quarter over quarter) | 3 months | Smoothing short-term noise, quarterly planning | Slower feedback loop, may miss rapid shifts |
| YoY (year over year) | 12 months | Long-term trends, eliminating seasonality | Too slow for operational decisions, masks recent changes |
| CMGR (compound monthly growth rate) | Custom period (typically 6–18 months) | Average growth rate, projections, investor reporting | Hides individual month volatility, can be misleading for short periods |
For mobile apps, MoM analysis is typically the most actionable metric because app marketing cycles move fast. However, combining MoM with YoY comparisons (to account for seasonality) and CMGR (for projections) gives you the most complete picture. As the time horizon increases — from MoM to QoQ to YoY — the data becomes more stable and reliable for strategic decisions, but less useful for quick tactical adjustments.
Key metrics you should track month over month
Here are the most important growth metrics to monitor on a month-over-month basis for mobile apps. Tracking these gives you immediately actionable insights and helps you understand the impact of changes you make.
| Metric | What it measures | Why track it MoM |
| Revenue / MRR | Total income or monthly recurring revenue | Directly reflects business health; ties to pricing changes, offers, and new products |
| Conversion rate | Percentage of users who convert (e.g., trial to paid) | Shows paywall and funnel effectiveness; impacted by A/B tests and offer changes |
| Retention rate | Percentage of users who remain active or subscribed | Positive trends indicate product-market fit; declines signal onboarding or satisfaction issues |
| Monthly active users (MAU) | Unique users engaging with the app in a month | Gauges acquisition quality and engagement; drops may signal bugs, redesigns, or market shifts |
| Churn rate | Percentage of subscribers who cancel | Early warning system for dissatisfaction; helps evaluate retention strategies |
| Customer lifetime value (LTV) | Total revenue a user generates over their lifetime | Shows whether acquisition and retention investments are paying off over time |
Conversion rates
If you monetize your app with in-app purchases or subscriptions, your conversion rate is one of the first metrics to monitor MoM. Some strategies immediately impact your conversion rate: launching a promotional offer, introducing new products, or testing a new paywall design. Tie the MoM growth rates you see to the marketing and sales strategies you used during those periods. Also remember that many strategies — such as a one-time promotion — are not easily repeatable.
Retention rate
For subscription-based apps, monitoring how your retention rate performs MoM is critical. A positive trend means users like your app and how you are building upon it. Negative trends can highlight issues ranging from poor user acquisition quality and onboarding problems to low customer satisfaction. Cohort analysis can help you dig deeper into retention patterns by isolating specific user groups.
Monthly active users (MAU)
The MAU metric tracks the number of unique users engaging with your app each month. While it appears to be a product metric, it ties directly to revenue. Observing changes in MAU helps you gauge the effectiveness of your acquisition strategies. A drop in this metric for a particular month could mean many things: a buggy update, a redesign that frustrated users, or a shift in the competitive landscape. Pairing MAU with user stickiness metrics (like the DAU/MAU ratio) gives a more complete engagement picture.
Practical applications of MoM growth analysis
MoM growth analysis is not limited to high-level reporting. Here are some practical ways mobile app teams use it in day-to-day operations:
Evaluating A/B test outcomes. After running a paywall A/B test for a month, comparing MoM conversion rates and revenue between the control and variant gives you clear data on what works.
Adjusting acquisition budgets. If MoM user growth slows despite consistent spend, it may signal ad fatigue or market saturation, prompting a creative refresh or channel switch.
Forecasting and planning. Using CMGR alongside MoM data, product and finance teams can create more accurate short-term forecasts for revenue, headcount, and infrastructure needs.
Monitoring post-launch performance. After a major app update, feature launch, or pricing change, MoM analysis shows the immediate impact on key metrics and helps decide whether to iterate or revert.
Identifying seasonal patterns. Tracking MoM data over 12+ months reveals recurring seasonal effects, helping you plan marketing spend and promotional calendars more effectively.
What is a good month-over-month growth rate?
There is no universal benchmark for a "good" MoM growth rate because it depends heavily on your app's stage, category, and the metric being measured. However, here are some general reference points:
For early-stage startups, a MoM revenue growth rate of 15–20% is often cited as a strong performance indicator. Y Combinator, for example, has historically referenced 5–7% weekly growth (roughly 20–30% MoM) as a target for companies in their accelerator program.
For established apps, MoM growth rates of 5–10% for revenue or user base are considered healthy, as maintaining high percentages becomes harder at scale.
For subscription apps specifically, tracking MoM growth in MRR (monthly recurring revenue) alongside churn rate gives the most meaningful picture. A MoM MRR growth of 10–15% combined with churn below 5% typically indicates strong product-market fit.
Always consider the absolute numbers and your specific market context. A 3% MoM growth rate on $500,000 MRR is far more impressive than a 50% rate on $1,000 MRR.
Wrapping it up
One thing to keep in mind when using month-over-month growth analysis for your mobile app is that you should not just focus on maintaining your monthly "performance" or hitting short-term growth goals. You need to zoom out and see the bigger picture too. Fixating on MoM metrics can come at the cost of long-term exponential growth, as efforts that would otherwise go into experimentation only get spent on retaining immediate numbers.
Capitalize on the immediate opportunities that MoM analysis shows you, but at all times, keep an eye on where you want your app to be in a year or a few years. Combine MoM analysis with CMGR for projections, YoY comparisons for trend validation, and cohort analysis for deeper behavioral insights.
Get in touch with the Adapty team for a personalized walkthrough of how Adapty's out-of-the-box reporting can keep you on top of your MoM analysis and set your app up for growth.
FAQ
What is the formula for month-over-month growth?
The MoM growth formula is: ((Current month's value − Previous month's value) / Previous month's value) × 100. For example, if your revenue was $80,000 in January and $92,000 in February, the MoM growth rate is ((92,000 − 80,000) / 80,000) × 100 = 15%.
What is the difference between MoM and YoY growth?
MoM compares a metric between two consecutive months, while YoY compares the same month across two consecutive years (e.g., January 2025 vs. January 2026). MoM is better for short-term tactical decisions and detecting recent changes, while YoY is better for understanding long-term trends and eliminating seasonal effects. Most teams use both: MoM for operational agility and YoY for strategic planning.
How do you calculate compound monthly growth rate (CMGR)?
CMGR = (Final month's value / Initial month's value) ^ (1 / Number of months) − 1. For example, if your app had 2,000 MAU in January and 10,000 in December (11 months), the CMGR is (10,000 / 2,000) ^ (1/11) − 1 ≈ 15.9%. CMGR smooths out the volatility of individual months and represents the average MoM growth rate over the period.
Can month-over-month growth be negative?
Yes. Negative MoM growth means the metric declined compared to the previous month. For example, if your MAU dropped from 50,000 in March to 45,000 in April, the MoM growth rate is −10%. Occasional negative months are normal, especially due to seasonality or one-off events. Persistent negative MoM trends, however, warrant investigation.
How do you account for seasonality in MoM analysis?
Seasonality can significantly distort MoM comparisons. To account for it, use CMGR over longer periods (6–18 months) to smooth seasonal effects. Compare the current month's MoM against the same month in prior years (MoM for January 2026 vs. MoM for January 2025). Track a 3-month or 6-month rolling average to reduce noise. Document known seasonal events — holidays, back-to-school periods, app store promotions — so you can contextualize any spikes or dips.
What metrics should mobile apps track month over month?
The most important metrics for mobile apps to track MoM include: revenue or MRR, conversion rates (install-to-trial, trial-to-paid), retention rate, monthly active users (MAU), churn rate, customer lifetime value (LTV), and advanced subscription metrics like renewal rates and ARPU. The exact mix depends on your app's monetization model and growth stage. For subscription apps, tools like Adapty provide out-of-the-box dashboards for all of these metrics.