Choosing the right mobile app store to launch your app can make a significant difference to your app’s long-term economics. While you might eventually release your app on both the App Store and Google Play, understanding the fundamental differences between iPhone and Android users is crucial for making informed decisions about platform prioritization, monetization strategies, and user acquisition.
In this comprehensive guide, we’ll explore the latest 2025 data on how iPhone users compare with Android users, covering market share, demographics, spending behavior, retention rates, and emerging trends that impact your app business.
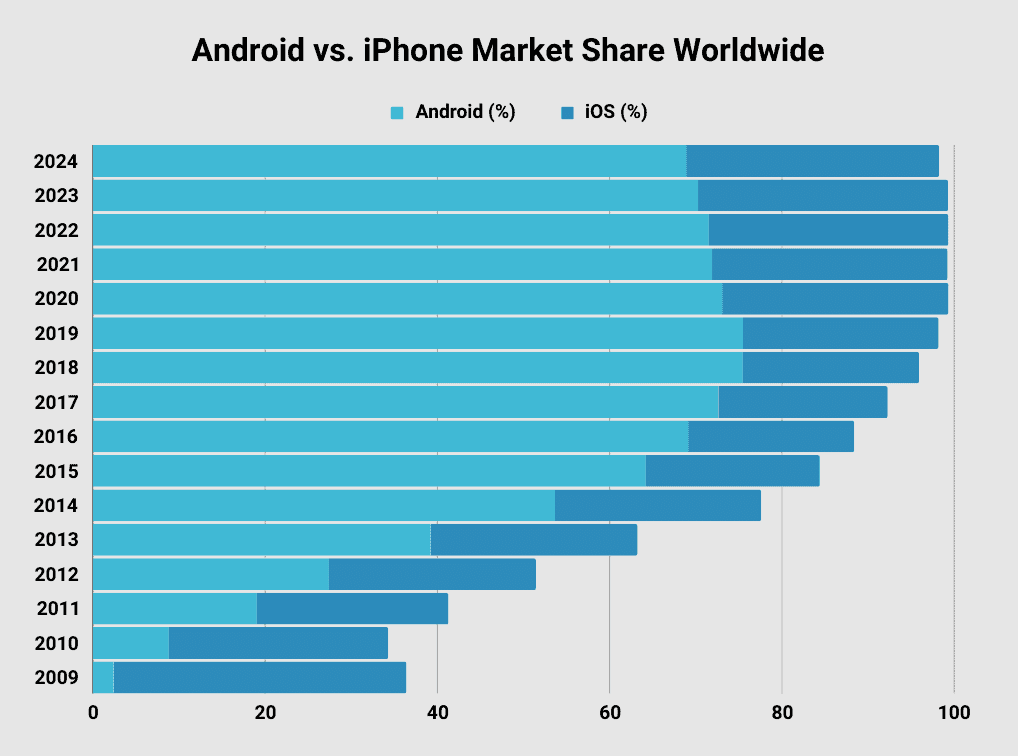
Global market share: Android vs iOS
When it comes to mobile operating systems, Android continues to dominate globally with approximately 71-72% market share, while iOS holds about 27-28%. This means most smartphone users worldwide are Android users, primarily because Android phones offer a wider price range, from budget devices under $100 to premium flagships over $1,000.
However, this global picture masks significant regional variations that are critical for app developers to understand:
iOS vs Android market share by region
| Region / country | iOS | Android | Key insight |
|---|---|---|---|
| Global | 27-28% | 71-72% | Android dominates overall |
| United States | 58-59% | 40-42% | iOS stronghold, premium market |
| Japan | 68-69% | 31-32% | Highest iOS adoption globally |
| United Kingdom | 49% | 50% | Near parity |
| Western Europe | 32% | 67-68% | Android leads significantly |
| China | 21% | 79% | Android + HarmonyOS dominate |
| India | 5-6% | 93-95% | Price-sensitive market |
| Brazil | 13% | 87% | Emerging market dynamics |
| Sub-Saharan Africa | 5% | 95% | Affordability drives choice |
If you’re launching an iOS app, you’re reaching the majority of users in the US and Japan, but only a small fraction in Asia and an even smaller segment in India and Africa. Your target market geography should heavily influence your platform strategy.
Active users: scale comparison
Understanding the absolute number of users on each platform helps contextualize the market share percentages:
- Android: 3.9-4.5 billion active devices globally
- iOS: 1.46-1.56 billion active users globally
- Ratio: Approximately 2.5-3x more Android users than iPhone users
- US iPhone users: ~124.7 million (growing 7.22% YoY)
- US Android users: ~100 million (40.4% of smartphone users)
Key demographics: who uses each platform?
The age demographics of iPhone vs Android users reveal clear patterns. In the US, 68% of 18-to-29-year-olds use iPhones, making iOS the dominant smartphone OS among younger users. Remarkably, 87% of US teenagers own an iPhone, indicating strong future market stability for Apple. iPhone’s user base is projected to grow 7% annually, fueled largely by Gen Z adoption.
Android users tend to skew older, with 60% of Generation X and 57% of Baby Boomers preferring Android devices. The 35+ age group shows stronger Android preference across most markets.
User demographics comparison
| Demographic factor | iPhone users | Android users |
|---|---|---|
| Age 18-29 (US) | 68% | 32% |
| Age 30-44 (US) | 52% | 48% |
| Age 45-64 (US) | 45% | 55% |
| Age 65+ (US) | 38% | 62% |
| US teenagers | 87% | 13% |
| Average annual income | $53,251 | $37,040 |
| Earn $75K+ (likelihood) | Higher | Lower |
| College degree (likelihood) | 55% more likely | Baseline |
| Gender – female | 51% | 43% |
| Gender – male | 49% | 57% |
The income disparity is particularly significant: iPhone users earn 43% more on average than Android users. This higher earning power directly correlates with greater willingness to spend on apps, subscriptions, and in-app purchases.
App revenue and spending behavior
When it comes to app spending, iOS users significantly outspend Android users. In 2025, consumer spending on the App Store is projected to reach $142 billion, while Google Play will see approximately $65 billion — meaning iOS captures nearly 69% of all app spending despite having fewer users.
| Metric | iOS / App Store | Android / Google Play | iOS advantage |
|---|---|---|---|
| Total consumer spending (2025) | $142 billion | $65 billion | 2.2x |
| Share of total app spending | 68-69% | 31-32% | — |
| Subscription revenue share | 73% | 27% | 2.7x |
| Average spend per app | $12.77 | $6.19 | 2.1x |
| Monthly app spend per user | $10.40 | $1.40 | 7.4x |
| Annual app spend per user | $140 | $69 | 2x |
| In-app purchase average | $1.07 | $0.43 | 2.5x |
| Projected 2026 spending | $161 billion | $72 billion | 2.2x |
The 7.4x difference in monthly spending is particularly striking. This gap is driven by iOS’s dominance in premium markets like the US and Japan, where users have higher disposable incomes and greater willingness to pay for apps and subscriptions.
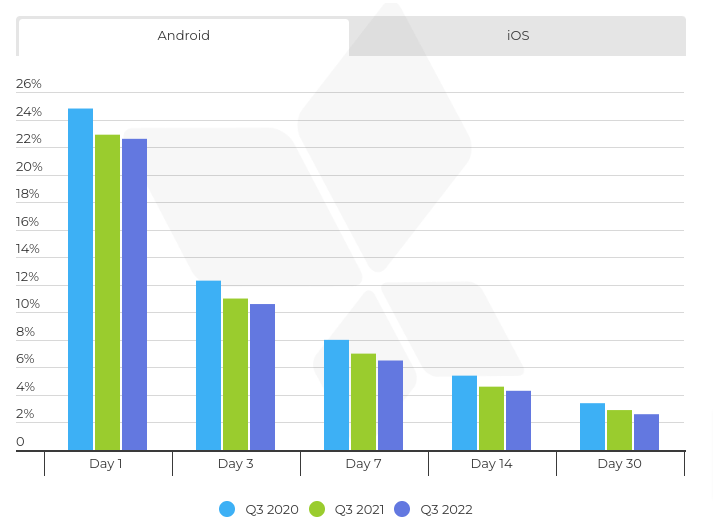
App retention: who’s more loyal?
Retention rates are critical for understanding user lifetime value. iOS users consistently show higher retention rates across all measured periods, with the gap widening over time:
App retention rates by platform
| Retention period | iOS | Android | iOS advantage |
|---|---|---|---|
| Day 1 | 23.9% | 21.1% | +13% |
| Day 7 | 6.89% | 5.15% | +34% |
| Day 14 | ~4.5% | ~3.2% | +41% |
| Day 30 | 3.1-3.7% | 2.1-2.8% | +46% |
The widening gap over time (from +13% at Day 1 to +46% at Day 30) suggests iOS users have significantly higher lifetime value. Even though iOS user acquisition costs are higher, the better retention often results in superior ROI.
Brand loyalty and platform switching
| Loyalty metric | iPhone | Android |
|---|---|---|
| Brand retention rate | 86-94% | 89-91% |
| Average device ownership duration | 4.2 years | 3.1 years |
| Kept previous device 3+ years | 29% | 21% |
| Users who switched from other platform | 18% from Android | 11% from iPhone |
| Currently considering switching | 8% | 12% |
| Main reason for switching to this platform | Better UX (47%) | Affordability (29%) |
User engagement and behavior
Beyond spending, iPhone and Android users exhibit different engagement patterns that affect app strategy:
| Behavior metric | iPhone users | Android users |
|---|---|---|
| Daily screen time | 4h 54min | 3h 42min |
| Text messages per day | 58 | 26 |
| Selfies per day | 12 | 7 |
| Monthly tech spending | $101 | $50 |
| Push notification opt-in rate | 51% | 81% |
| Push notification click rate | 3.4% | 4.6% |
| On latest OS version (within 6 months) | 93% | 20% |
Notably, Android users have higher push notification opt-in and click rates. This is partly because iOS requires explicit user permission for notifications, while Android opts users in by default. For push notification strategies, Android offers better reach, while iOS users who opt in tend to be more engaged.
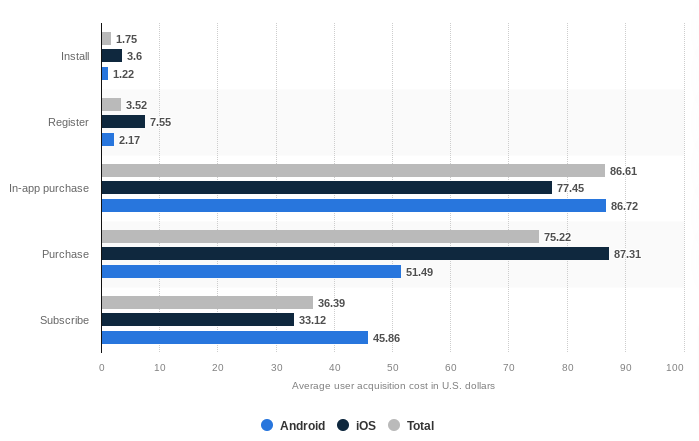
User acquisition costs
User acquisition costs differ significantly between platforms, affecting your marketing budget and strategy:
| Acquisition metric | iOS | Android |
|---|---|---|
| Cost Per Install (CPI) | $3.60+ | $1.22 |
| CPI Difference | 3x higher | Baseline |
| Revenue Per Install (RPI) | $2.12 | $0.85 |
| Effective LTV | Higher (7.4x monthly spend) | Lower |
While iOS acquisition costs are approximately 3x higher, the higher revenue per install ($2.12 vs $0.85) and significantly better retention often result in comparable or superior ROI for subscription and premium apps.
Emerging trends shaping the landscape
AI features
AI is becoming a key differentiator in smartphone purchasing decisions. 50% of iPhone buyers consider AI features crucial when making a purchase, compared to just 23.7% of Android buyers. Apple Intelligence and Google AI capabilities are reshaping user expectations and platform loyalty.
Privacy and security
Privacy remains a significant iOS advantage. 75% of iOS users successfully recovered data after security breaches, compared to 55% of Android users. Apple’s App Tracking Transparency (ATT) has reshaped mobile advertising, with only ~24% of users opting in to tracking. Notably, 41% of Android-to-iOS conversions are driven by security and privacy concerns.
Software updates
Apple maintains a significant advantage in software update adoption. 93% of iPhone users run the latest iOS within 6 months, compared to only 20% of Android users on the latest version. iPhones receive 5-6 years of software support, while most Android devices get 2-3 years (though Google Pixel and Samsung flagships now match Apple’s 7-year support).
Foldable phones
The foldable phone market (growing at 17.13% CAGR) remains Android-exclusive, with Samsung and Huawei leading innovation. Apple has not yet entered this market, creating a potential differentiation opportunity for Android manufacturers targeting users who prioritize large screens and multitasking.
HarmonyOS: the third player
Huawei’s HarmonyOS has emerged as a significant third player, capturing 19% market share in China in Q1 2025. This creates a potential three-way split in the Chinese market that developers targeting that region must consider.
How to choose a platform for your mobile app
Based on all the data above, here are strategic recommendations for platform selection:
Choose iOS first if:
- Your monetization relies on subscriptions or in-app purchases (iOS captures 73% of subscription revenue)
- You’re targeting premium, high-income users
- Your primary markets are US, Japan, or UK
- You’re building lifestyle, health & fitness, or finance apps
- User retention and LTV are priorities over volume
Choose Android first if:
- Your monetization relies primarily on advertising (more users = more impressions)
- You’re targeting emerging markets (India, Southeast Asia, Latin America, Africa)
- User acquisition budget is limited (3x lower CPI)
- Scale and download volume are primary KPIs
- You need hardware flexibility (foldables, diverse form factors)
Consider both platforms simultaneously if:
- You’re building a social or viral app where network effects matter
- You’re using cross-platform frameworks (Flutter, React Native) that reduce dual-platform costs
- Your target audience is evenly split across platforms
Conclusion
Android and iOS users show considerable differences across all stages of their mobile app journey — from demographics and preferences to spending behavior and retention. While Android dominates in raw user numbers (71-72% globally), iOS captures the majority of app revenue (68-69%) with users who spend 7.4x more monthly.
For most subscription and premium apps, iOS remains the stronger launch platform due to higher user spending, better retention rates, and premium market demographics. However, Android’s massive user base makes it essential for scale and advertising-based monetization.
Even when you choose the right platform, finding pricing that works for your target users requires experimentation. Testing different products, price points, paywalls, and offers is the only way to determine what maximizes revenue. Adapty’s paywall A/B testing and analytics tools help you optimize monetization across both iOS and Android platforms.