How to predict revenue and LTV of your subscription-based app

Building a strong monetization strategy for your subscription-based app is vital to able to get stable recurring revenue. But it’s always a double-edged sword: to make sure that your strategy is working you need to have enough data on your revenue and lifetime value (LTV) scattered across several renewal periods, but there’s no way of gathering this data unless you just simply choose a strategy and wait. But what if there is?
Imagine how great it would be to know how much money your app is going to generate in the future without having to actually wait for it to happen. Well, we’re glad to make this come true with a new prediction feature of Adapty’s cohort analysis. With the help of machine learning, we’ve managed to create an accurate prediction model that you can use to find out what revenue and LTV your user cohorts will demonstrate in 3, 6, 9, and 12 months! Let’s have a closer look at this game-changing feature.
What’s the use of the revenue and LTV predictions?
First of all, we should note that the prediction feature is not a separate dashboard but an important addition to the useful and informative cohort analysis tool. To quickly refresh, Adapty Cohorts enables you to understand how much money you collect from a specific cohort of users throughout several renewal periods.
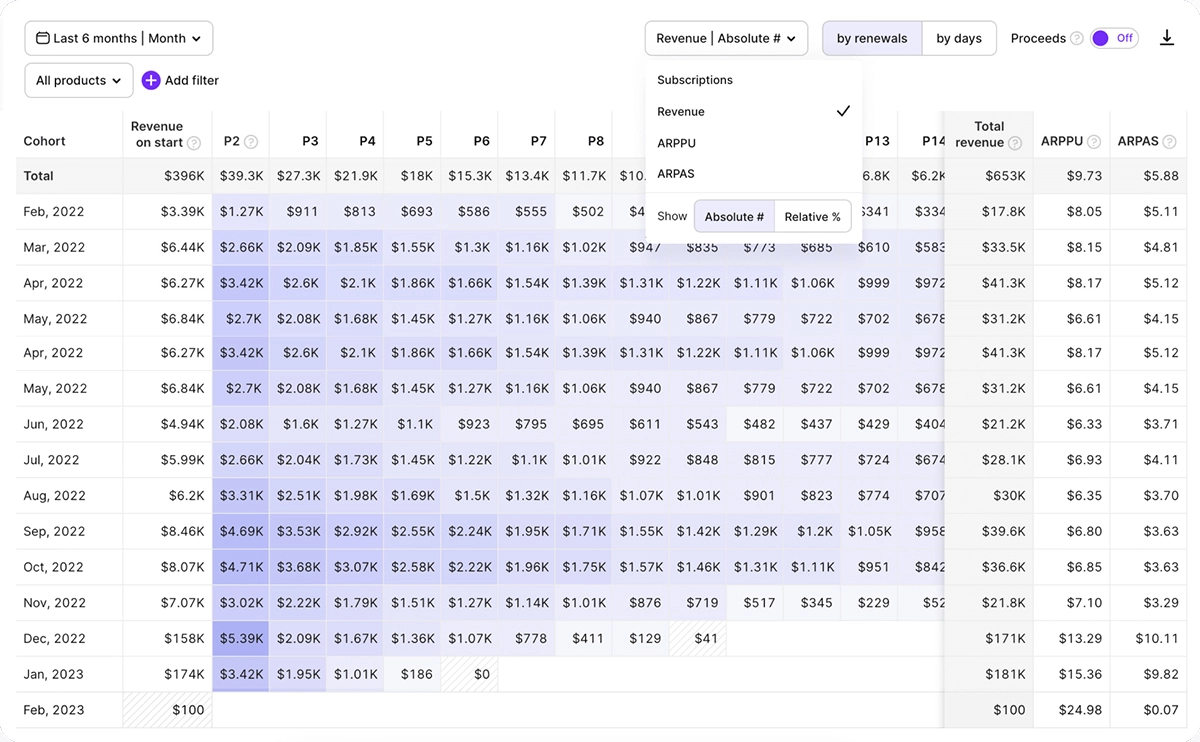
This helps to clearly see what day a cohort should pay off and make assumptions on how much money you can spend on user acquisition or how long it should take to recoup the ad spend. So, in a way, our cohort analysis already deals with predictions, but we’ve made a bigger step.
The Predictions are designed to let you see much further while having not much real data at the moment. Such an approach opens a new range of possibilities:
- Find out the predicted LTV of your user cohorts.
- Learn which cohorts are likely to generate the highest revenue in the future.
- See how much you can invest by being aware of the predicted payoff.
- Generally make strategic decisions much quicker and with less hesitation.
Overall, the prediction feature is added to help you easier make data-driven decisions and develop a much more powerful financial strategy. Let’s see how this actually works.
How to work with predictions in Adapty
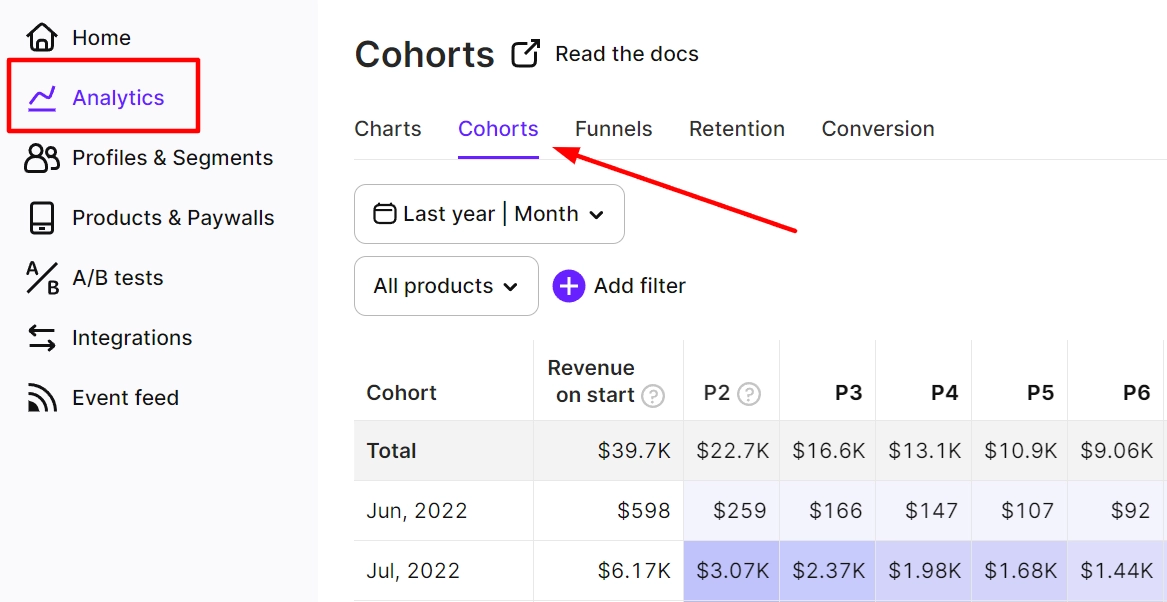
As we mentioned above, predictions are an add-on to the cohort analysis in Adapty. It means they are natively integrated into the dashboard and do not require any additional actions from your side. Simply go to the Analytics tab and select the Cohorts dashboard.
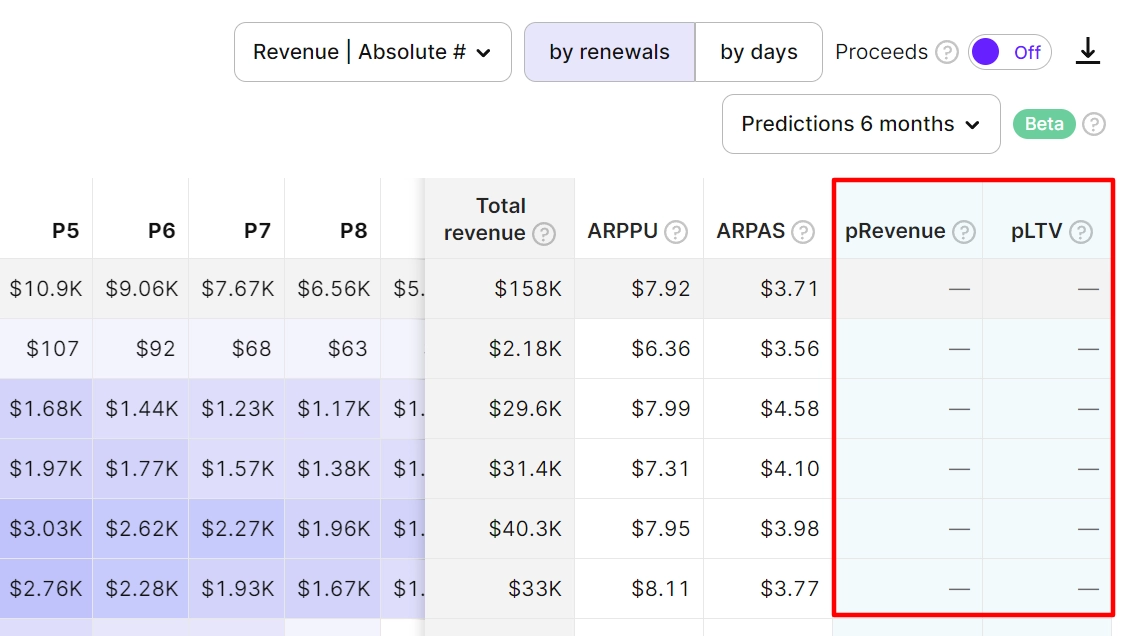
Pay attention to the right side of the dashboard – you’ll notice two new columns titled pRevenue (predicted revenue) and pLTV (predicted lifetime value). By clicking the drop-down menu above, you may select the desired prediction period, which can be 3, 6, 9, or 12 months. It’s that easy.pRevenue shows the estimated total revenue a cohort of subscribers is expected to generate during the selected time frame after cohort creation, while pLTV shows the estimated lifetime value of each user in the selected cohort.
To give you even more flexibility, Adapty allows you to filter predicted revenue and LTV by product. While the default predictions are based on all purchase data, filtering by product helps you assess individual product performance and its impact on overall revenue and LTV. Please note that our current prediction model has limitations: you can filter predicted LTV by product, duration, and dates, but it doesn’t calculate proceeds.

However, there may be a situation where the fields of the prediction columns will turn out empty. This may happen because of a small cohort size or an unpopular subscription type, but more often it’s the result of having not enough data for the prediction model to start working.
Predictions are generated within 1-3 weeks of creating a cohort to allow for adequate data collection and analysis. For instance, if a cohort is created on January 1st, predictions will be available sometime between January 15th and January 29th.
Once the initial predictions are generated, they are updated daily using the most recent transactional data for the cohort. This frequent updating ensures that the predictions stay up to date and reflect the cohort's latest behavior. Since we touched on the technical aspects of the model, let’s talk a little more about what it’s based on and how it actually functions.
Prediction model
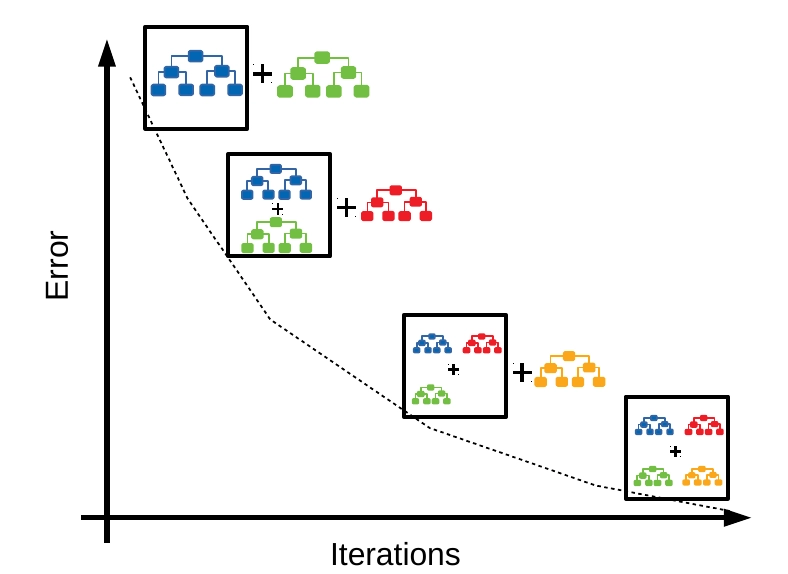
If you wonder what’s under the hood of our new feature and if the predictions it makes can be trusted, let’s take a look at it from the technical perspective. Our prediction model is built using gradient boosting – a powerful machine-learning technique that combines the predictions of several weak models to make accurate predictions. It works in a step-by-step manner, where each new model corrects the mistakes made by the previous models.
The model is trained using data from all of your apps. However, to provide more accurate predictions, the model refines and customizes the predicted values based on the specific behavior patterns observed in cohorts associated with each individual app. This post-correction algorithm considers each app's unique characteristics, resulting in improved accuracy. By analyzing transaction data from your apps, the model can predict the lifetime value of users one year after their profile is created. It's important to note that the data used for the model is completely anonymized.
The Mean Absolute Percentage Error (MAPE) of the model is slightly below 10%, which demonstrates a high level of accuracy. However, it's worth mentioning that the model currently works for subscription-based products and doesn’t support lifetime products and one-time purchases. Additionally, the accuracy of the LTV predictions may be lower for new apps with limited data and for apps that have experienced significant changes in user traffic. To learn more about the technical aspects of the model, check out our documentation.
Conclusion
Adapty continues to make working with subscriptions easier and more profitable. Getting access to the predicted revenue and predicted LTV enables Adapty users to better understand their revenue and user behavior, and use this information to optimize their business operations and strategies for more profitable results. Although the predicted data is meant to be used for planning purposes, it’s still advised to regard it as an additional information source, instead of a direct guide to action. Apart from making cohort analysis simpler, we also facilitated the process of creating paywalls and running A/B tests with them, so make sure to check this out as well.