Your App Store conversion rate is a powerful tool, providing insights into your listing’s effectiveness, your app’s alignment with user expectations, and the quality of your user acquisition.
These insights can guide all your optimization efforts – for example, A/B testing a listing with different copy or visuals for better conversion rates.
But to draw these insights, you need context. Comparing your conversion rate against others in your category can offer valuable perspective. In this guide, we’ll dive deep into conversion rate benchmarks across categories and platforms.
What’s a good App Store conversion rate?
According to AppTweak data for the first half of 2024, the average conversion rate in the US App Store was 25%, while Google Play showed 27.3%. Business apps demonstrated one of the highest rates at 66.7%, whereas games overall show the lowest – around 1.2% for board games.
In short: It depends on your category.
If you have a business app, a good benchmark would be conversion above 65%. But if you have a game, a realistic target is 3-5%. Moreover, even within the gaming category, rates vary significantly: racing games convert at 20.6%, while board games convert at just 1.2%.
The takeaway: Meaningful conversion rate analysis comes from benchmarking at the subcategory level. Only this allows you to get an accurate picture of your current performance and set realistic goals.
Key conversion metrics: What you need to know
Conversion rate vs Install rate
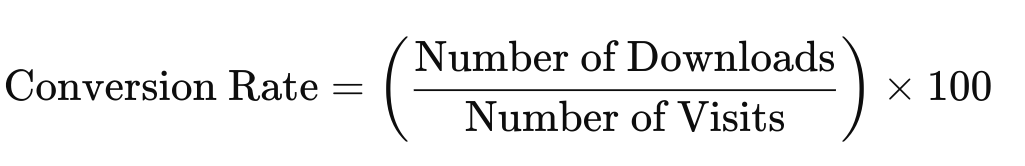
Conversion Rate (CVR) – the percentage of users who download your app after viewing its page in the store.
Formula: (Downloads / Page Views) × 100%
Install Rate — the percentage of users who download your app directly from search results or recommendations without visiting the app page. This metric is unique to the App Store, as iOS allows users to install apps directly from search results.
Important: Install Rate is typically much lower than Conversion Rate. The average Install Rate in the US App Store is approximately 3.8%.
Interesting fact: On the App Store, conversion rates above 100% are possible. This happens when the number of first-time installs exceeds the number of page views—meaning most users download the app directly from search results.
Conversion metrics by funnel stage
| Metric | Description | Average benchmark |
| Impression to Page View | CTR from search results to page | 6-12% |
| Page View to Install (CVR) | Page conversion to download | 25-27% |
| Install Rate | Impression to Install (iOS only) | 3.6-3.8% |
| Download to Trial | Download to trial start | 3.7-8.9% |
| Trial to Paid | Trial to paid subscription | 38-54% |
App Store vs Google Play: Comparative analysis
Conversion rates differ significantly between platforms. On average, Google Play shows slightly higher conversion (27.3% vs 25%), but for individual categories, the difference can be substantial.
App Store vs Google Play conversion comparison
| Category | App Store CVR | Google Play CVR | Difference |
| Navigation | 115% | ~45% | +70% |
| Photo & Video | 60.8% | ~35% | +25.8% |
| Auto & Vehicles | ~40% | 70.5% | -30.5% |
| Business | 66.7% | ~55% | +11.7% |
| Education | 16.8% | 30.4% | -13.6% |
| Finance | 32.8% | 19.7% | +13.1% |
| Games (Board) | 1.2% | 7.3% | -6.1% |
| Food & Drink | 12.1% | 18.5% | -6.4% |
Important: App categorization may differ between platforms. For example, some finance apps fall under the Business category on Google Play but appear in Finance on the App Store.
Top converting categories on the App Store
| Rank | Category | CVR | Trend |
| 1 | Navigation | 115% | ↑ Growing |
| 2 | Weather | 79.8% | → Stable |
| 3 | Reference | 67.2% | ↑ Growing |
| 4 | Business | 66.7% | ↑ Growing |
| 5 | Photo & Video | 60.8% | → Stable |
Conversion rates by category: Detailed analysis
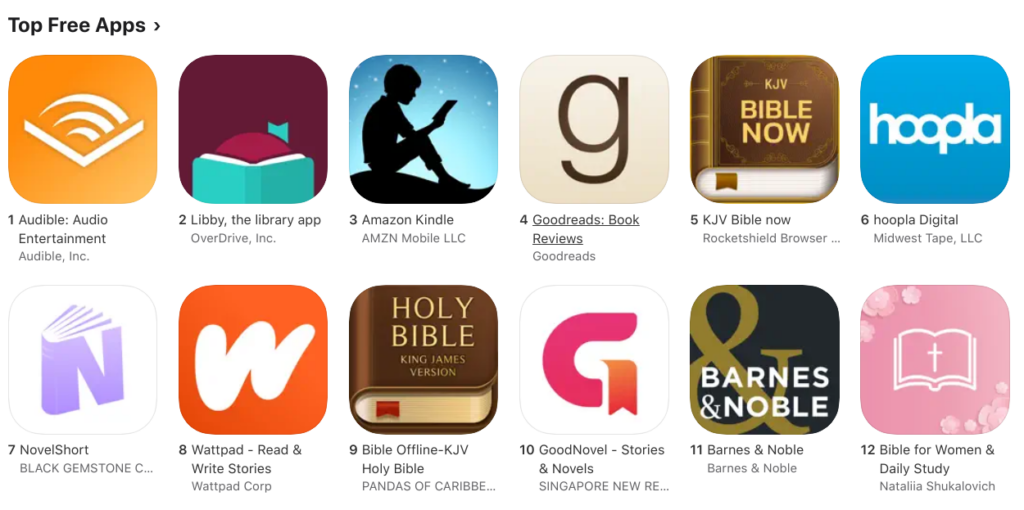
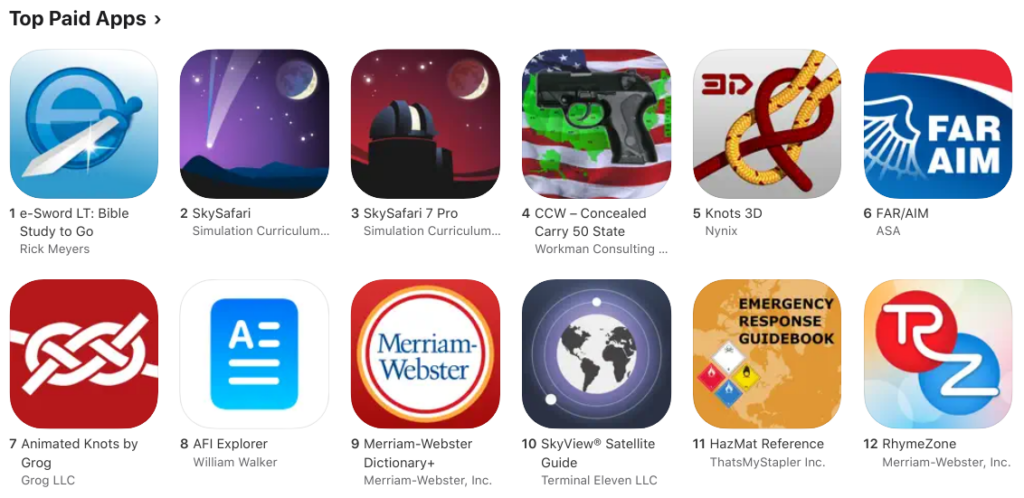
Books
The Books category features eBook readers, audiobook apps, and library-type applications providing access to reading materials.
Data for this category shows significant discrepancy between sources: Statista reports 74.2% conversion in 2022, while AppTweak recorded only 7.3% for H1 2024. This discrepancy may be explained by differences in methodology and app sampling.
Reference
Reference apps provide quick access to information – dictionaries, translators (Google Translate), encyclopedias.
Conversion: 67.2%
High conversion is explained by users having a clear understanding of what they’re looking for and a specific need for information retrieval.
Business
This category includes apps for project management, communications, accounting, and documentation.
Conversion: 66.7%
Business apps consistently rank among top converters. Category leaders include enterprise solutions like Microsoft Teams and ADP. Paid apps often offer niche solutions: productivity, skill development, digital business cards.
Education
Educational apps cover language learning, test preparation, and educational games.
- App Store conversion: 16.8%
- Google Play conversion: 30.4%
Interestingly, Google Play shows nearly twice the conversion rate in this category. Top paid apps don’t just target a specific subject but offer innovative approaches to learning.
Finance
Mobile banking, personal finance, cash flow management.
- App Store conversion: 32.8%
- Google Play conversion: 19.7%
Finance apps show the opposite pattern: iOS users convert significantly better. This may be related to the higher purchasing power of Apple’s audience.
Food and drink
- App Store conversion: 12.1%
- Google Play conversion: 18.5%
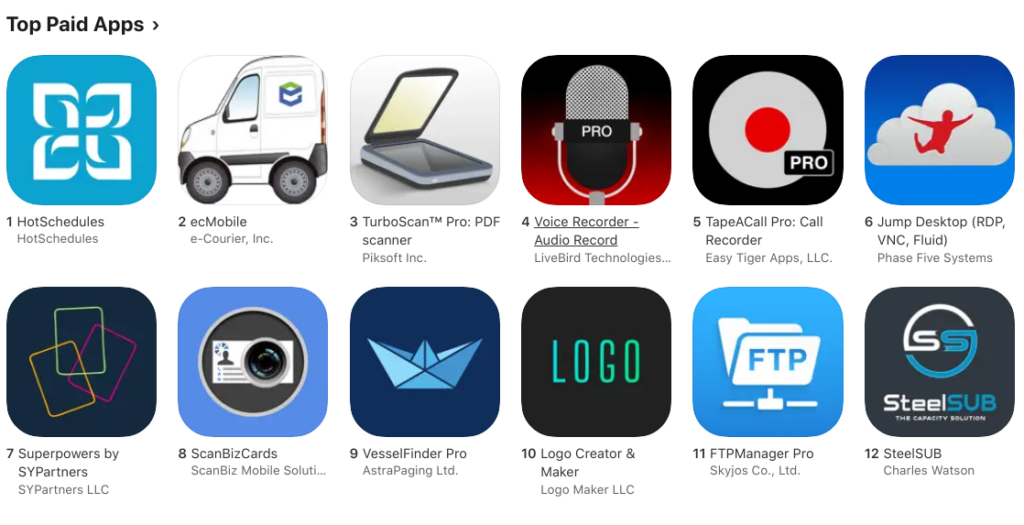
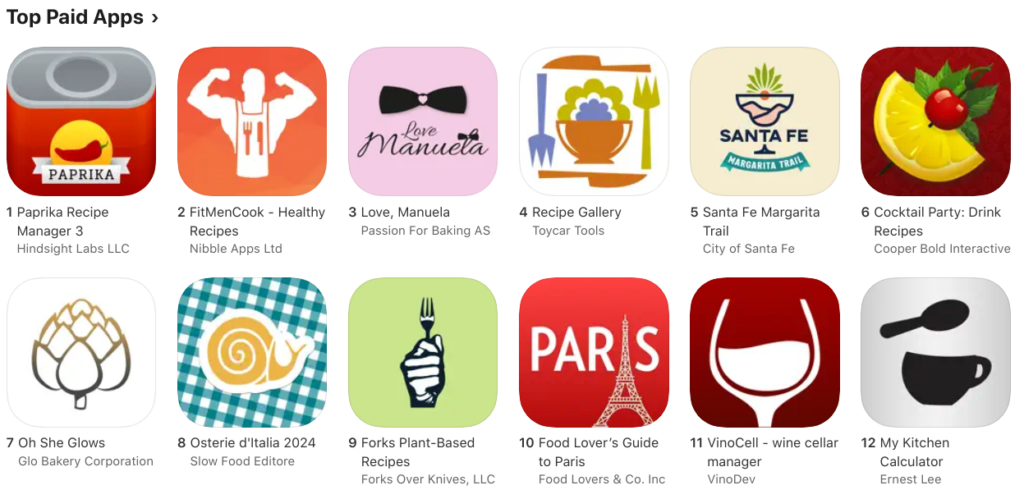
Popular free apps include McDonald’s, Starbucks, and food delivery services. Paid apps mainly offer recipes, with 7 out of 10 top paid apps priced under $5.
Games
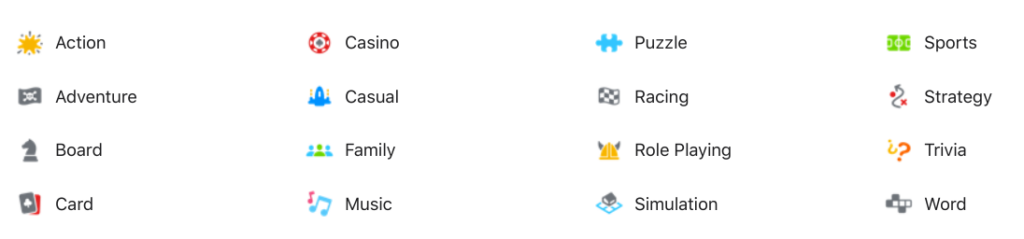
The App Store recognizes 16 gaming subcategories, and conversion varies widely between them:
- Racing: 20.6%
- Trivia: 20.4%
- Music: 20.5%
- Sports: 10.3%
- Board: 1.2%
Low conversion in games is explained by the vast selection and high competition – users browse many options before installing.
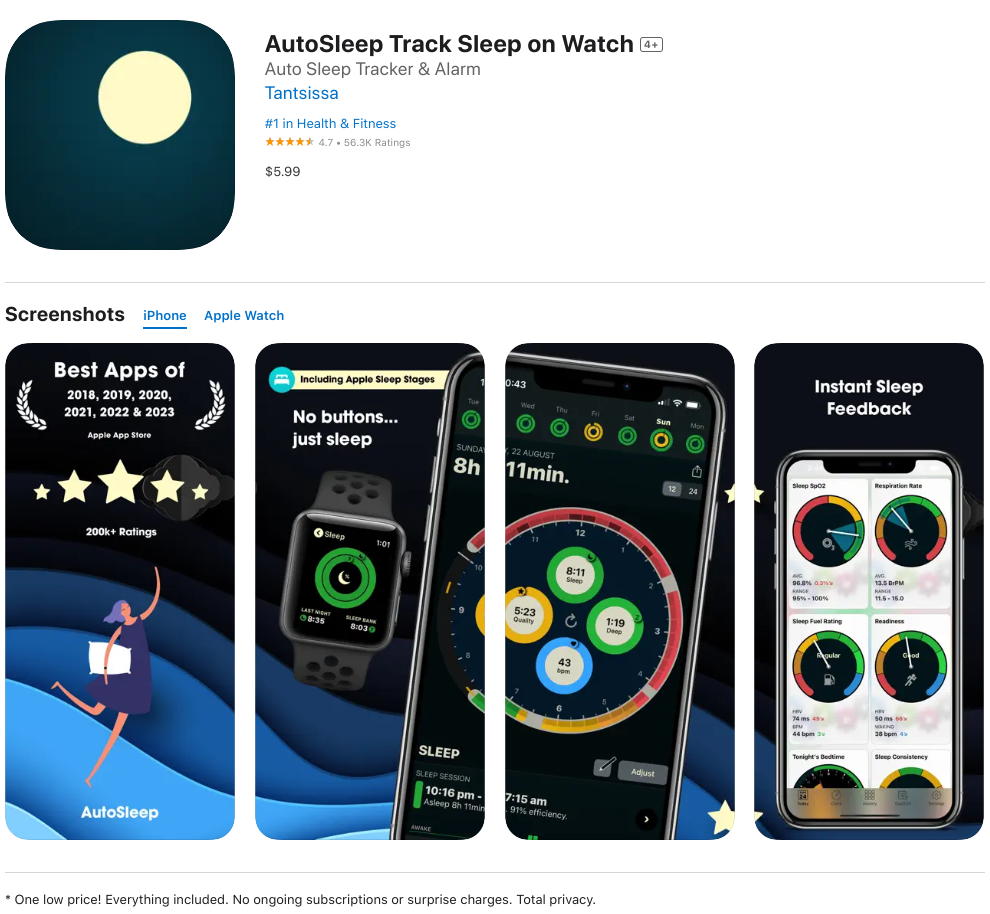
Health and fitness
Sleep trackers, diet apps, personal training, health monitoring.
Conversion: 30.8%
Top paid apps in the category often use a one-time purchase model without subscriptions. This differentiates them from competitors with subscription models.
Lifestyle
Dating, astrology, closet organization.
Conversion: 23.3%
Given that dating apps are the most downloaded, average conversion rates may be skewed.
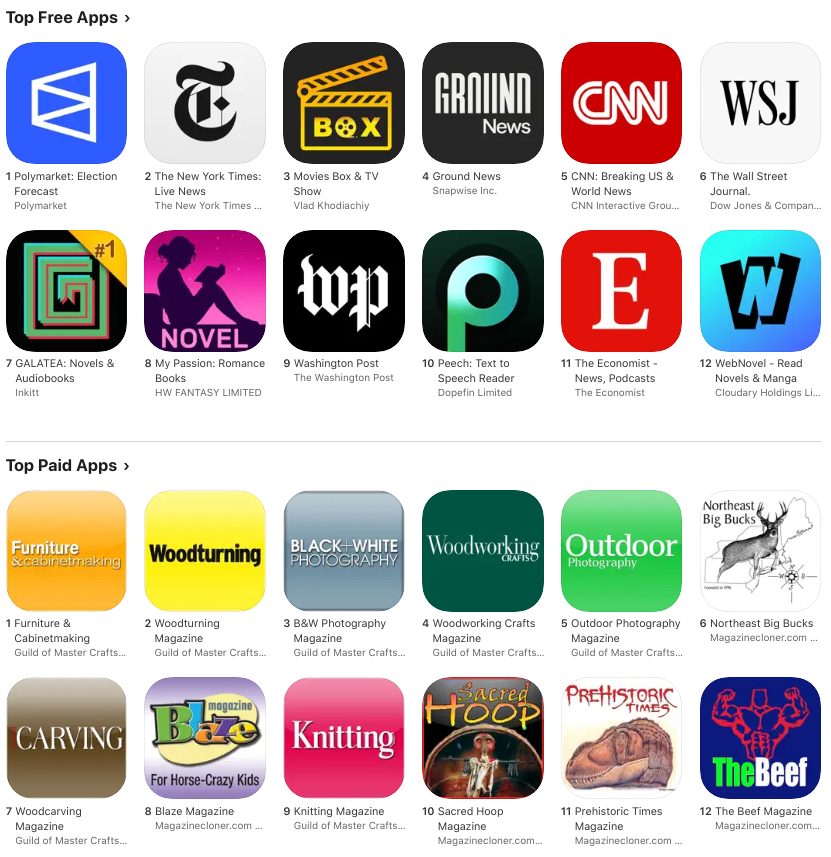
Magazines and newspapers
Conversion: 13.7%
Top free downloads come from publications like The New York Times and The Wall Street Journal. Paid apps serve niche communities: woodturning, photography, knitting.
Music
Conversion: 47.1%
Streaming services (Spotify, YouTube Music, Amazon Music) lead among free apps. Paid apps focus on music learning, creation, and editing.
Navigation
Conversion: 115%
Conversion above 100% means most users install navigation apps directly from search results without visiting the app page.
News
Conversion: 14.5%
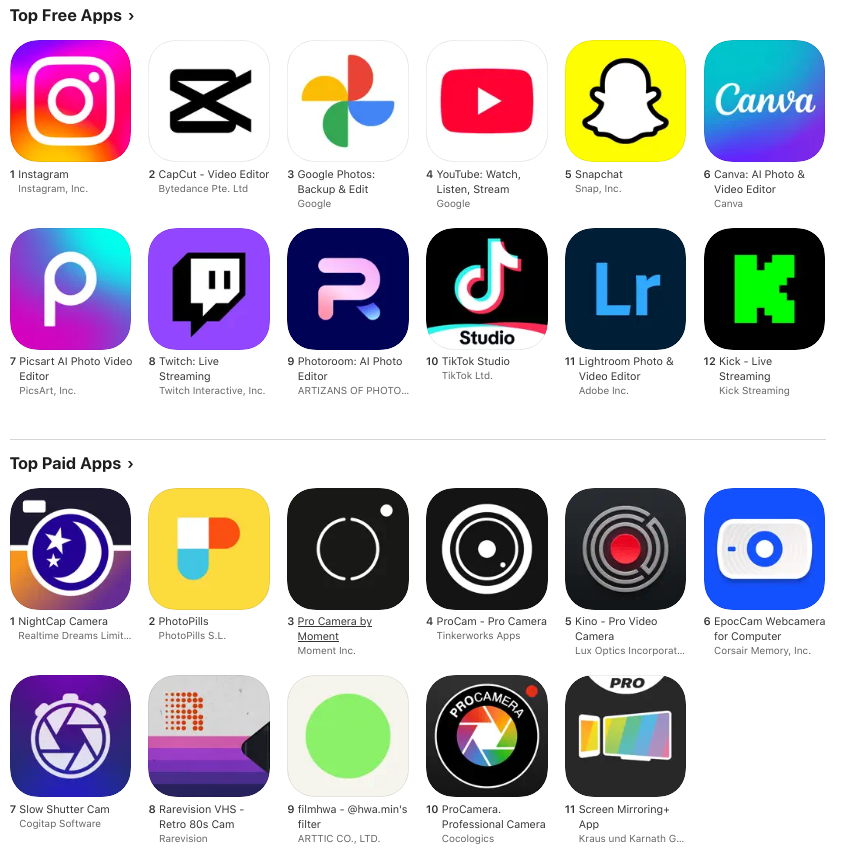
Photo and video
Conversion: 60.8%
One of the highest-converting categories. Free segment leaders include Instagram, Google Photos, Snapchat. Among paid apps – numerous camera apps with professional features.
Productivity
Conversion: 59.7%
Consistently high conversion reflects targeted search for productivity solutions.
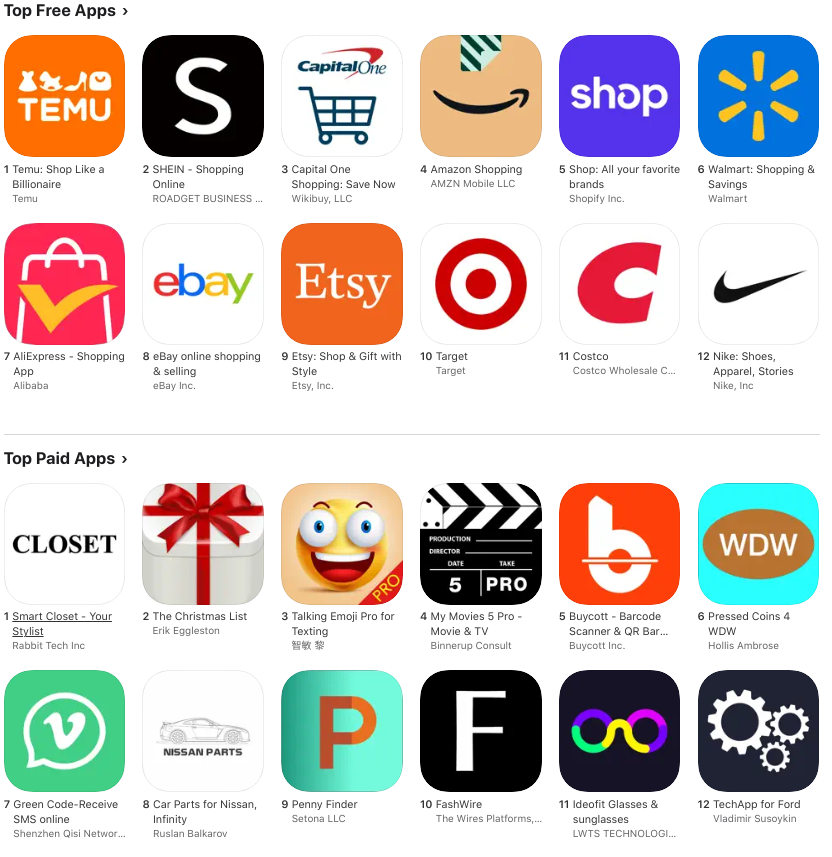
Shopping
Conversion: 26.4%
Popular free apps include Amazon, eBay, Target. Paid apps typically offer specialized features – barcode scanning, gift tracking.
Social networking
Conversion: 13.1%
Facebook, Threads, Telegram – top free apps. Paid apps offer private social networks, niche communities, and add-ons for popular platforms.
Travel
Conversion: 16.5%
The category includes ride-sharing apps (Uber, Lyft), booking services (Booking.com, Expedia). Despite relatively low page conversion, the category shows high Trial to Paid Conversion – 54.3%.
Utilities
Conversion: 40.6%
Browsers, VPNs, memory optimizers, password managers. Top apps: Google Chrome, Microsoft Edge, NordVPN.
Weather
Conversion: 79.8%
Weather apps remain one of the highest-converting categories thanks to their daily utility.
Subscription conversion: From download to payment
For subscription-based apps, not only download conversion matters but also the user’s journey to payment.
Trial conversion by category
| Category | Download → Trial | Trial → Paid |
| Business | 8.9% | ~45% |
| Health & Fitness | 6.7% | 44.5% |
| Travel | ~5% | 54.3% |
| Shopping | ~4% | 45.4% |
| Gaming | 2.9% | 30.8% |
| Photo & Video | ~4% | 26.2% |
Key subscription insights:
- In 2024, over half (52%) of all trials were offered for 5-9 days, up from 48.5% in 2023
- North America leads in Download → Trial conversion: 7.3%
- Apps with higher subscription prices show higher trial conversion—users are more motivated from the start
- Day 35 download-to-paid conversion is consistently higher on the App Store than Google Play
- Gaming apps prefer shorter trials – 96.3% last 4 days or less
Factors affecting conversion
| Factor | Impact | Recommendation |
| Rating < 4.0 | Strongly negative | 90% of featured apps had 4.0+ rating |
| Custom Product Pages | +5.9-8.6% CVR | Create at least 3-5 CPPs |
| Screenshot updates | Positive | 2-4 times per year (games – up to 8x) |
| Video preview | +15-25% CVR | Add 30-sec preview |
| Localization | +20-40% in local markets | Minimum 10 languages |
| A/B testing | Positive | 57% of top games tested screenshots 2+ times |
ASO trends in 2026
Custom Product Pages (CPP)
Custom Product Pages remain an underutilized tool: only 31% of apps and 26% of games use CPPs. Yet those who use this feature see conversion lifts up to +8.6%.
CPPs allow you to create up to 35 versions of your app page with unique URLs for different ad campaigns. This is critical for improving conversion, especially for brands with significant web traffic.
WWDC updates
Apple introduced several significant updates for ASO:
- App Store tags: new tagging system for improved discoverability
- CPP and keywords: ability to link Custom Product Pages with keywords
- Download-to-Paid conversion: new cohort metric in App Analytics
- Average proceeds per download: tracking revenue growth per user over time
Metadata update frequency
Top 200 apps update screenshots 2-4 times per year. Games on Google Play update visuals up to 8 times per year. 57% of top games ran A/B tests on screenshots at least twice in 2024.
App store conversion rate vs. App Store install rate
Your app store conversion rate is about the number of users who get your app on your app listing. So if 1,000 people visit your app listing and 300 of them download it, your conversion rate would be 30%. [Conversion Rate=(300 downloads/ 1000 visits)×100=30%.]
The App Store install rate, in contrast, is also your App Store conversion rate, but, here, users don’t land on your app listing. They simply see your app feature somewhere inside the App Store— like in the App Store’s organic search results when a search happens—and get your app directly without ever landing on your app listing page.
Your App Store conversion rate ties to your app listing’s ability to convert viewers into users. On the other hand, your App Store install rate reflects your app’s overall visibility and its reach among users through channels like recommendations, app store optimization (ASO), and more. Naturally, install rates tend to be much lower than conversion rates.
How to improve your App Store conversion rate
Since App Store conversion largely depends on what users see on your app’s page, improving conversion requires optimizing your listing.
- A/B test your listing. Experiment with different copy, icons, and visuals to determine what resonates best with users.
- Add a free trial. If you have a paid app without a trial period, this could be a barrier to conversion.
- Localize your app. Adapting for different languages and cultures significantly increases appeal and reach.
- Work on visibility. Optimize your listing with the right keywords and metadata to attract relevant audiences.
- Analyze competitor pricing. For paid apps, understanding pricing positioning helps optimize your strategy.
- Use Custom Product Pages. Create personalized pages for different audience segments and ad campaigns.
Maintain a high rating. Aim for 4.0+ rating – this is a critical threshold for featured placement and user trust.
Beyond App Store conversion rates…
When you analyze your App Store conversion rate, keep in mind that your conversion rate is just a top-funnel metric.
Even if a user downloads your app for, say, $4.99, that’s only part of the picture.
What really matters is how much value you generate from that user over time—whether it’s through ad revenue, in-app purchases, or subscriptions.
Lifetime value (LTV) is what you should focus on. A high conversion rate is great, but without strong monetization strategies and retention, it won’t mean much in the long run.
Always consider the full revenue potential of your users, which goes far beyond just analyzing your App Store conversion rate. If you offer in-app purchases, especially subscriptions, consider adding a solution like Adapty to your app mix. Adapty provides insights into your users’ buying behavior, allowing you to optimize your monetization strategy:
Read more about Adapty’s revenue reporting here.
Wrapping it up…
While App Store conversion rates can vary greatly between categories, the average figures still offer helpful insights.
Additionally, while your App Store conversion rate doesn’t tell the whole story, it remains the single most important metric for analyzing your app store listing.
So, focus on optimizing it, but also keep the bigger picture in mind!