April updates: Email reporting and conversion chart updates
In April, our team focused on two key enhancements aimed at refining your Adapty experience. Firstly, the refinement and optimization process for our analytics charts keeps going with significant improvements made to the Conversion section. Additionally, we're excited to introduce a highly anticipated feature: recurring email reports. Now, Adapty will send you regular email updates containing all the essential app data. Let's dive deeper into how these updates will streamline your interaction with Adapty.
Conversion chart enhancements
April was dedicated to enhancing the Conversion section, a beloved feature among our users. Through a series of updates, we made significant improvements to ensure a smoother user experience.
Quicker chart loading
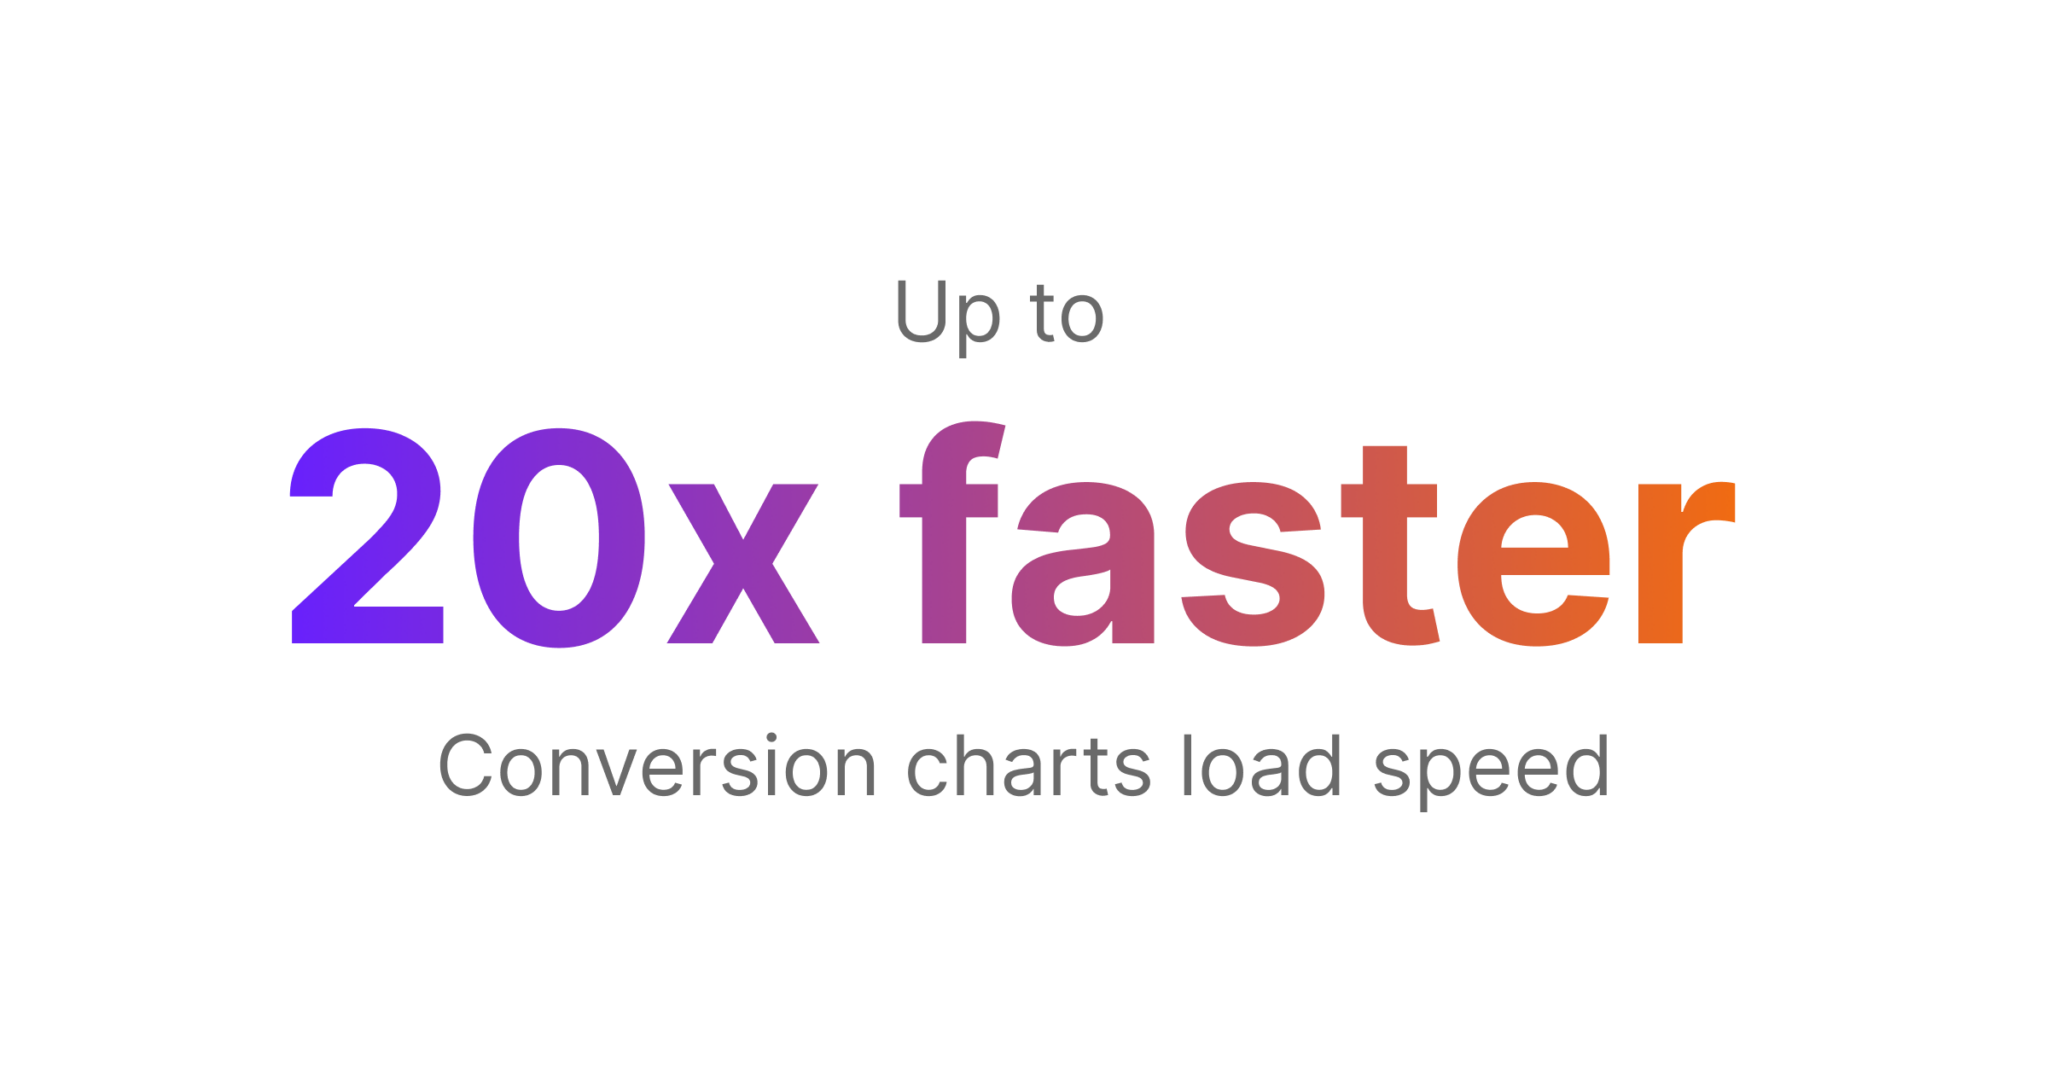
We’re continuing to improve the load speed of our analytics charts with Conversions receiving the long-awaited upgrade. Following thorough refactoring, the chart now loads approximately 20 times faster than before – a noticeable improvement that we're confident you'll appreciate.
Refined incomplete data handling
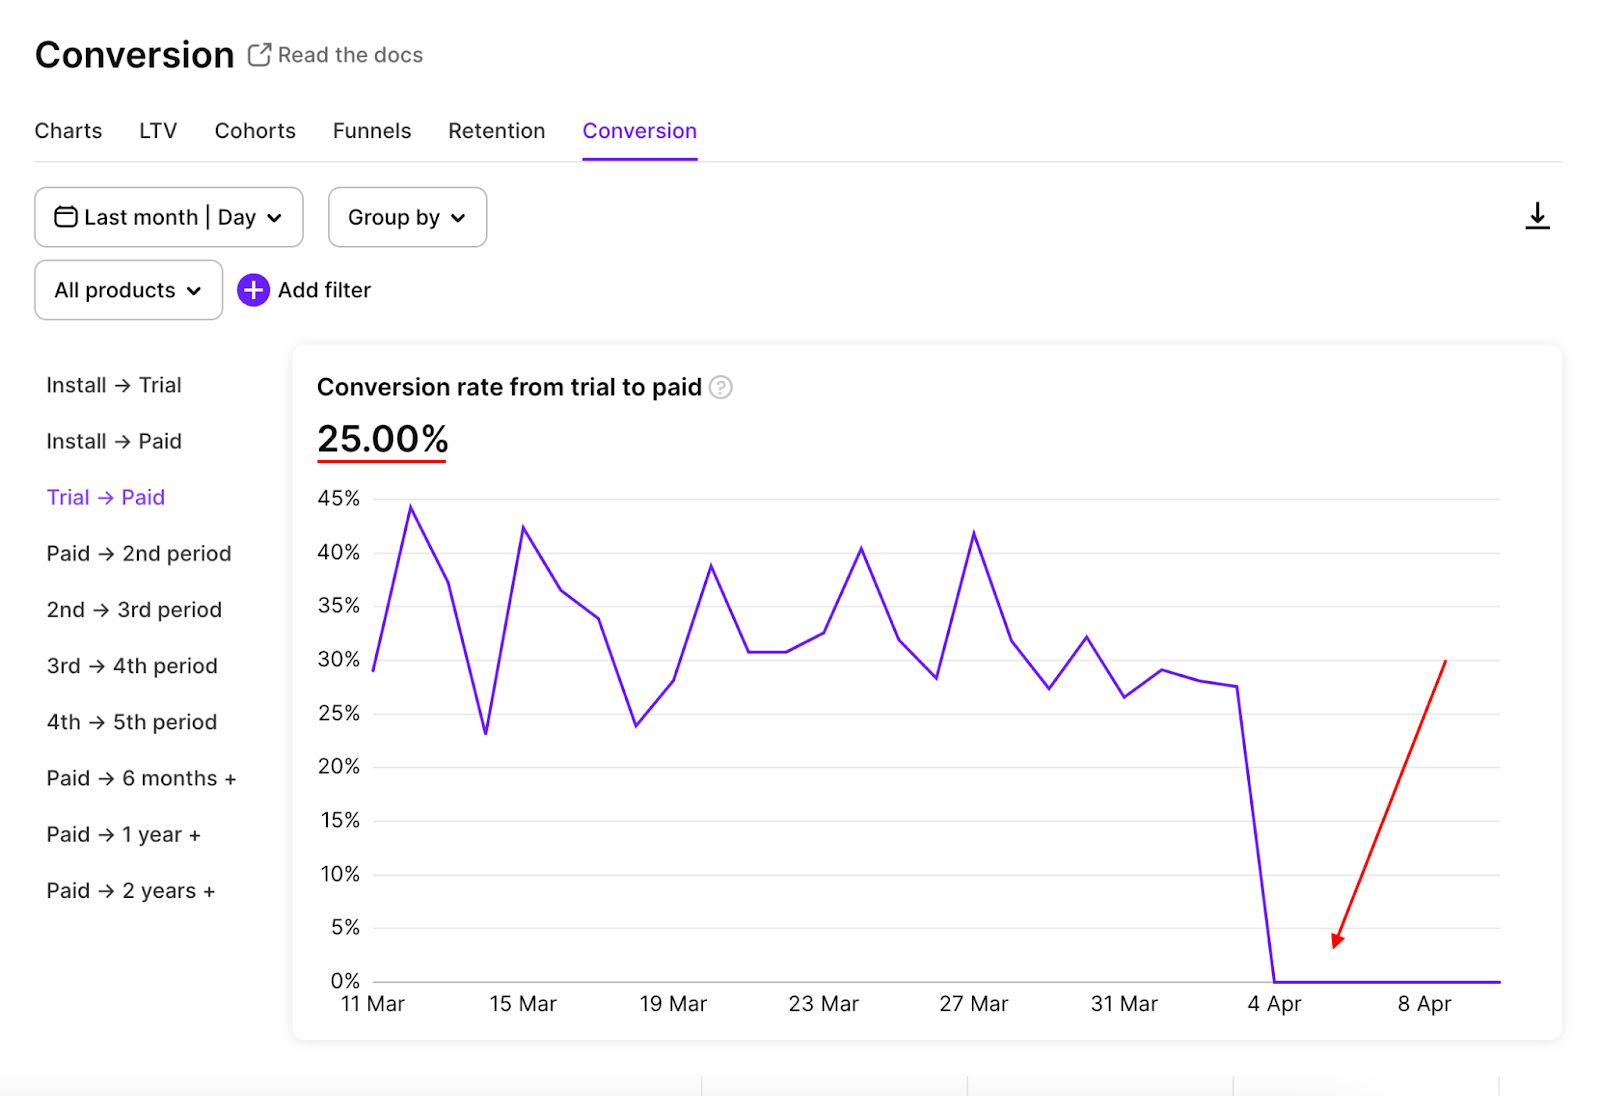
Our Conversion charts now highlight periods where data is incomplete, recalculating averages accordingly. Let's illustrate this with an example using the trial-to-paid conversion chart.
Previously, you may have noticed the chart flatlining at zero during periods where there wasn't enough data to generate conversions. Additionally, these zero values skewed conversion rate calculations. For example, if your app has a trial of 3 days, you’d always see the conversion value as 0 for the most recent 3 days as well.
Now, the chart clearly identifies these "incomplete" periods with dashed lines, excluding them from conversion rate calculations.
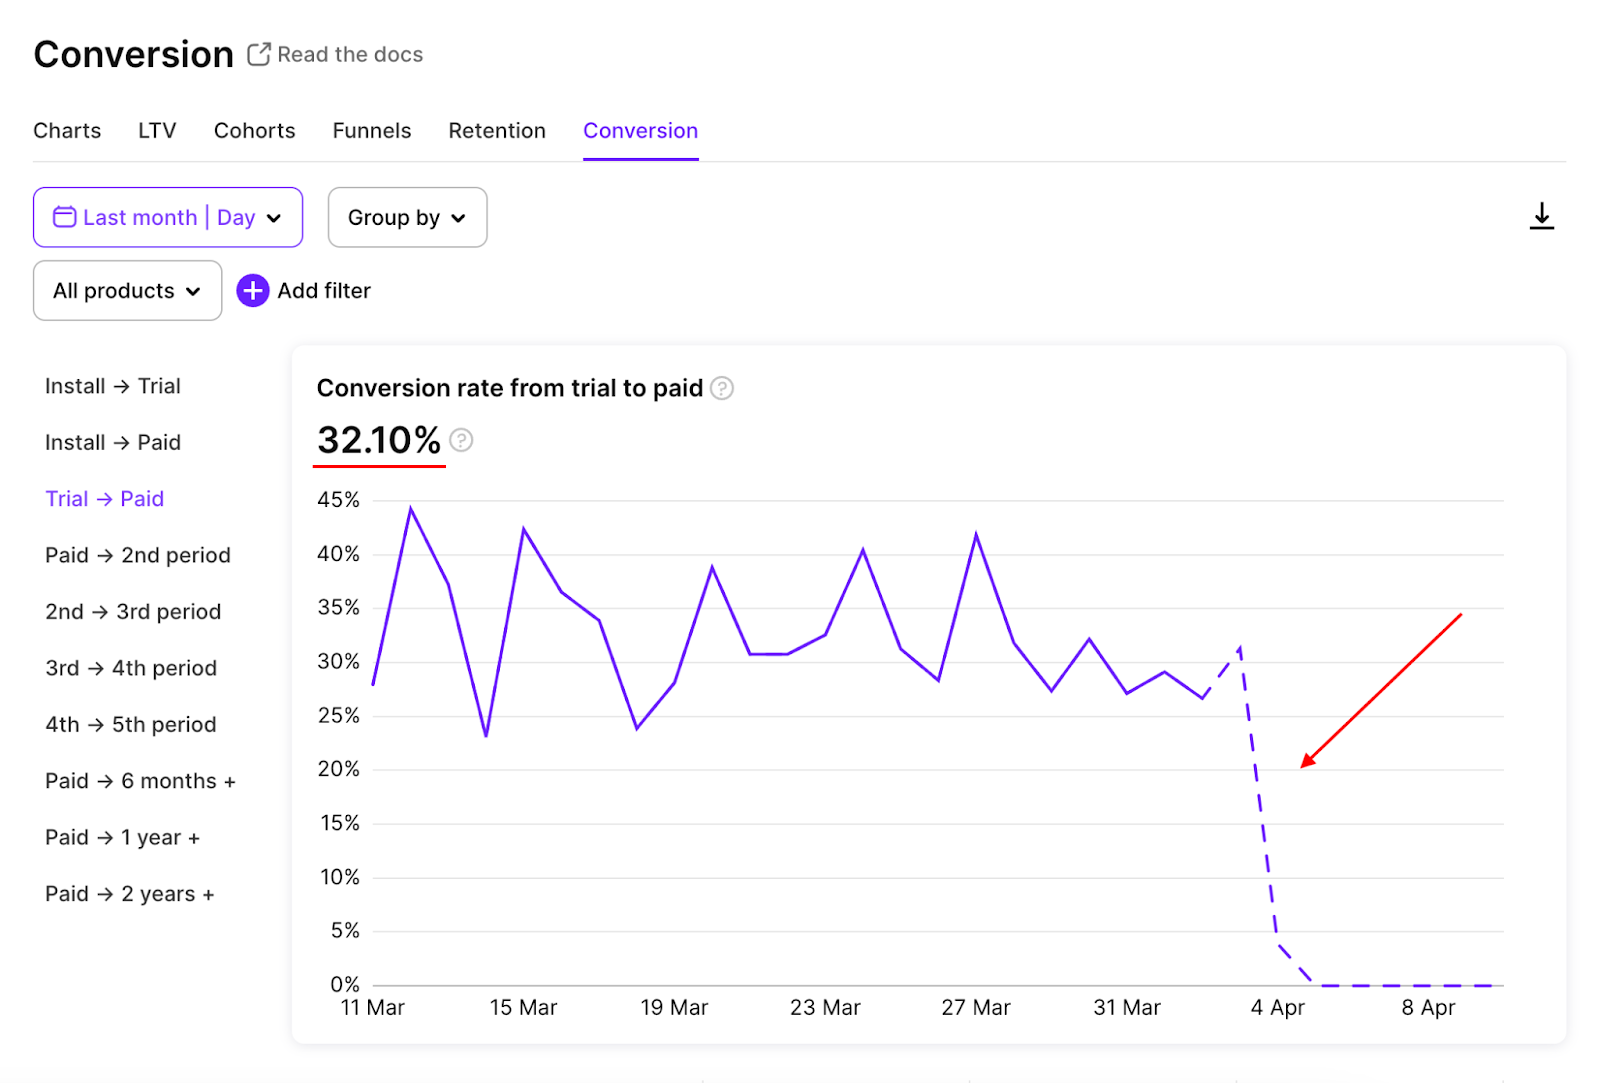
This refinement applies to all conversion metrics except for Install to Trial and Install to Paid.
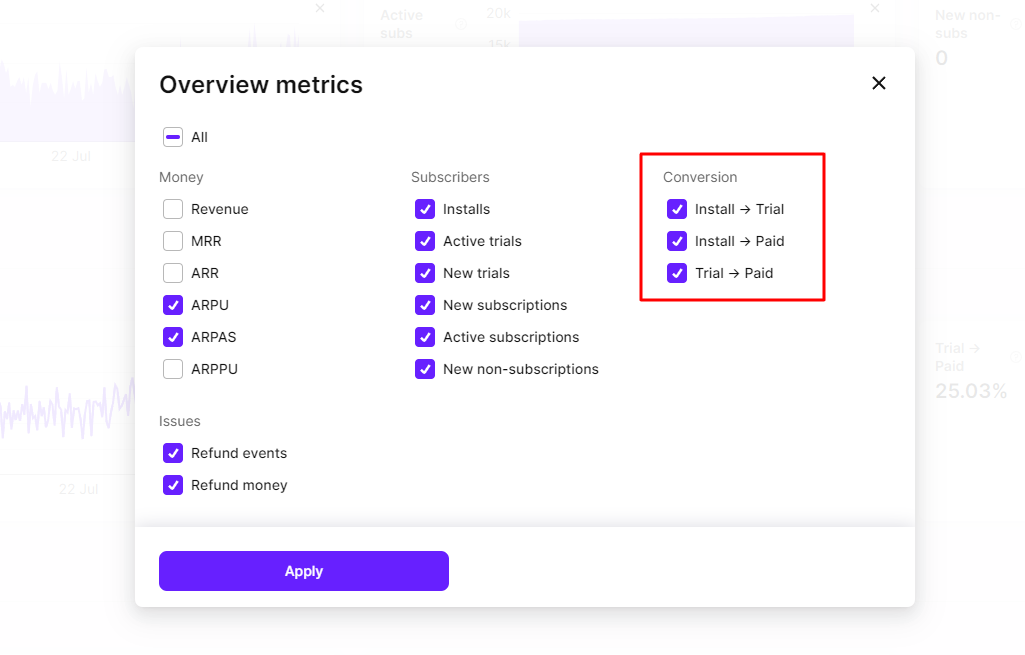
Conversion charts added to the Overview
The Overview dashboard now features the most pertinent and popular conversion charts, providing you with immediate access to valuable insights. Here are the conversions now available for viewing:
- Install to Trial
- Install to Paid
- Trial to Paid
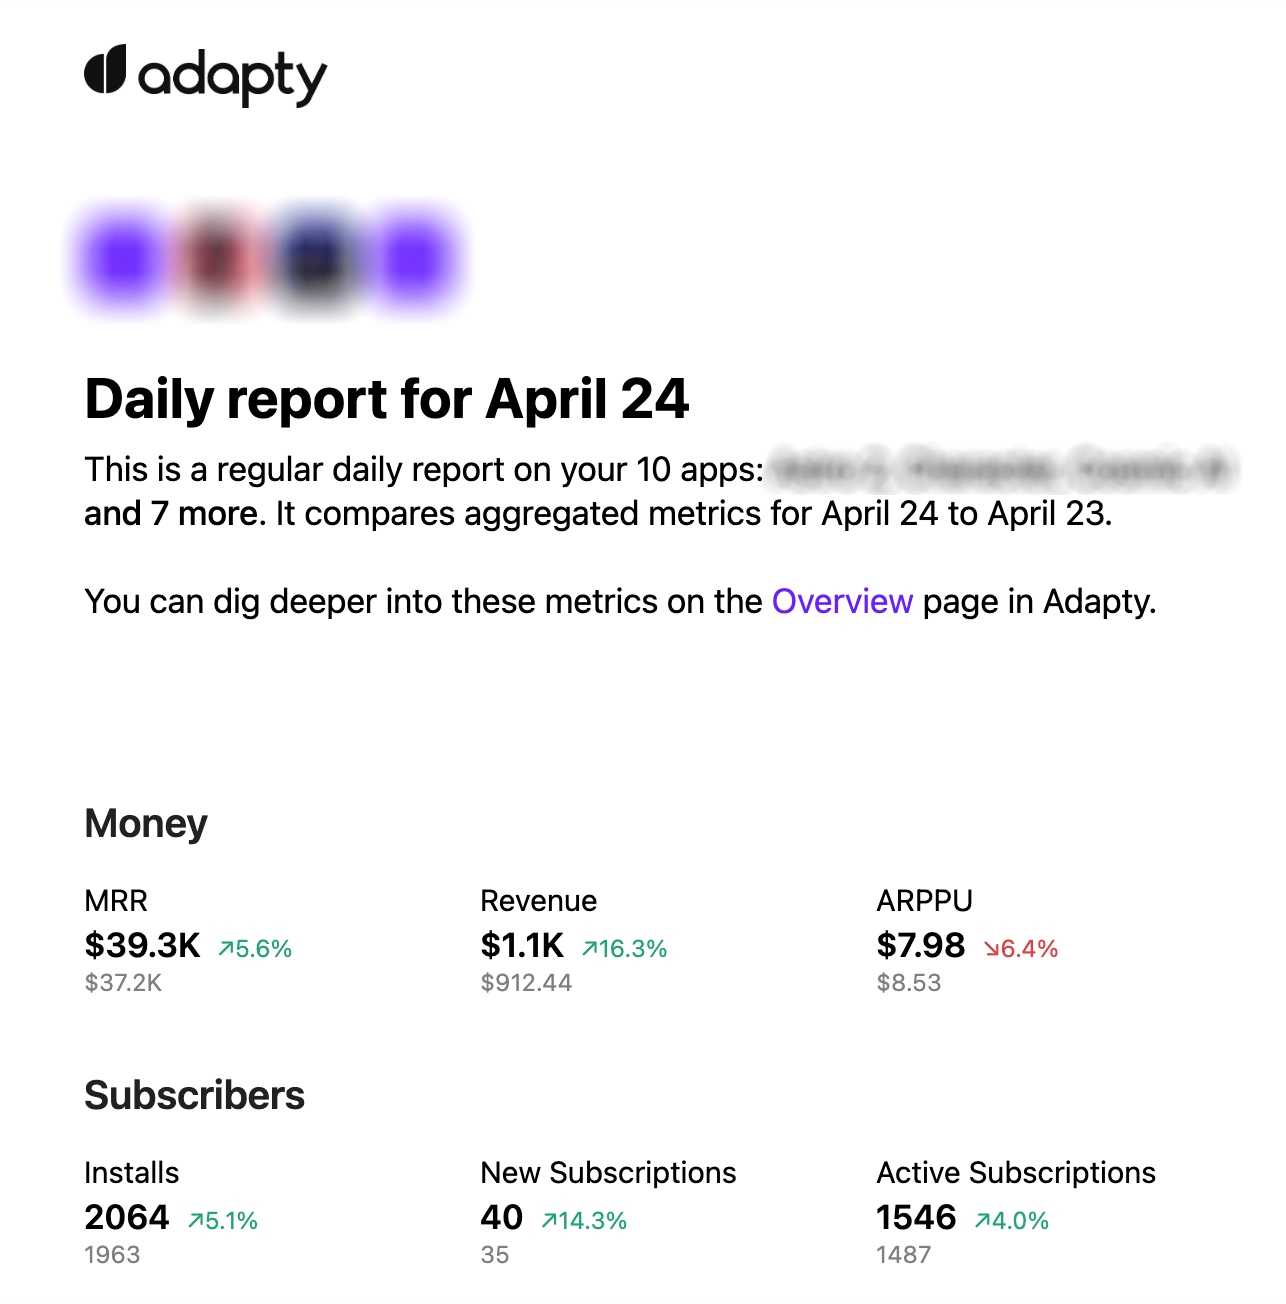
Regular email reports
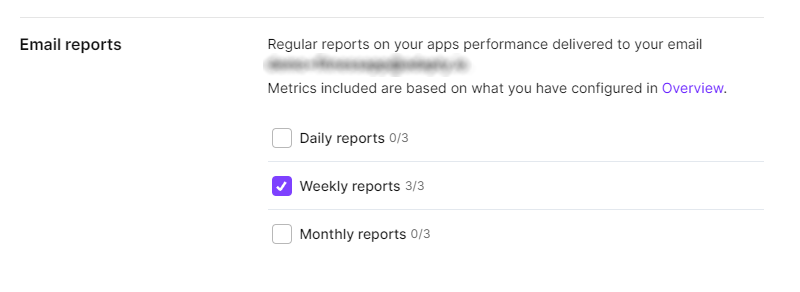
Another significant addition to the Overview dashboard is the introduction of recurrent email reporting. You can now receive daily, weekly, or monthly email reports for all your apps or select individual apps of interest.
Simply head to your account settings to customize your reporting preferences.
You can also choose between receiving a summary report or detailed data for specific apps.
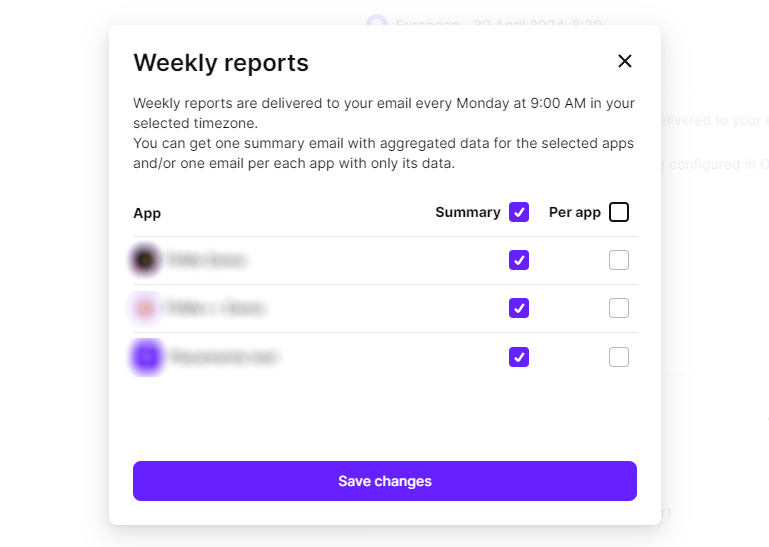
The content, timezone, order, and revenue type in these email reports are tailored according to your Overview configuration. For more information on adjusting your reporting settings, refer to our documentation.
Apple Search Ads attribution data is more reliable with our newest SDK
Finally, a minor but impactful update concerns how Adapty handles Apple Search Ads (ASA) attribution. Previously, ASA attribution was collected on our SDK's side, but we've now transitioned to server-based collection. This change enhances data reliability and enables Adapty to gather more comprehensive attribution data. Be sure to update your SDK to the latest version to leverage these improvements effectively.