What's wrong with my in-app subscription on iOS?


TL;DR:
Sometimes it seems that everything is calculated and works well, but subscribers still leave. We figured out what mistakes marketers could make. Some details are very easy to overlook.
When launching an iOS-app, a marketer needs to foresee all the details: from methods of interaction with different segments of the target audience to the cost of actions within the service. Sometimes it seems that everything is calculated and works well, but subscribers still leave. In this article, we'll cover some details that we think are quite easy to overlook.
Problems With the Sales Funnel
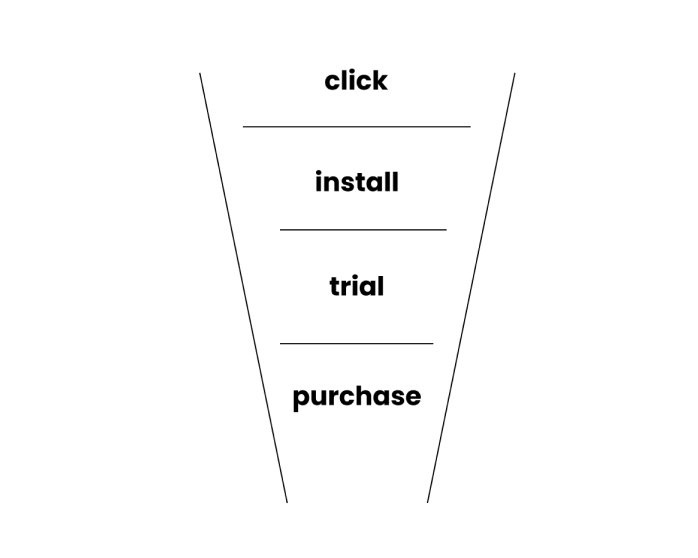
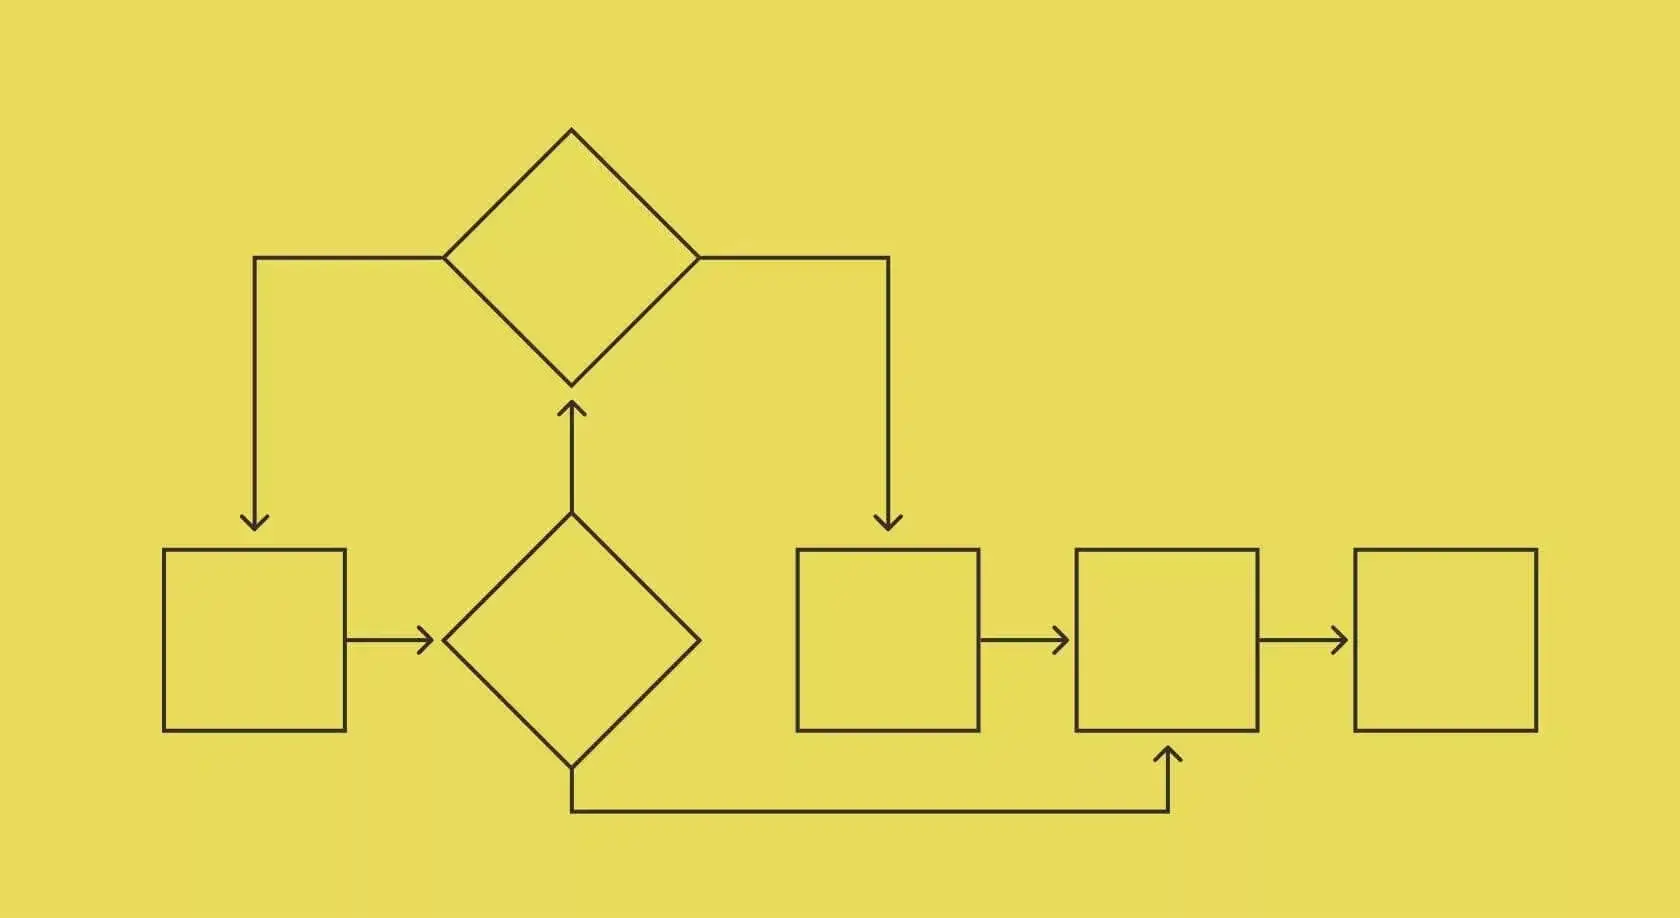
You might encounter the first problem while building a sales funnel for a mobile application or tracking conversions. The funnel for an iOS subscription service consists of the following stages: click on the ads, installation, trial period, first purchase, second purchase, etc. Let's analyze indicators that are worth monitoring, one-by-one.
So, you've created your app, then uploaded it to the App Store and started attracting users. Maybe you even carried out an App Store Optimization (ASO), which is an SEO-optimization analog for mobile services that gives your application a higher position in the list of apps in the store. You've also launched ads on social media and, probably, involved influencers. You can already track the main sources of installations and Activation Rate at this stage, with the latter showing how successful your campaign was and how many users were engaging with your app. For example, if your ads were shown to 1,000 people, and 100 of them installed your service, then your Activation Rate would be 10%.
As the number of installations can't be less than the number of users who actively use the app, we advise you to track involvement at the stage when the user goes through a trial period. One of the main engagement metrics is DAU or the number of daily active users. A similar MAU indicator reflects the number of people who use the app within 30 days. Look at the ratio DAU: MAU in your case. If the indicator is small, e.g. only 20%, then this is a reason to think about funnel optimization.
The non-price metric can help you with that. This metric is a conversion from installation to trial. The calculation formula is as follows:
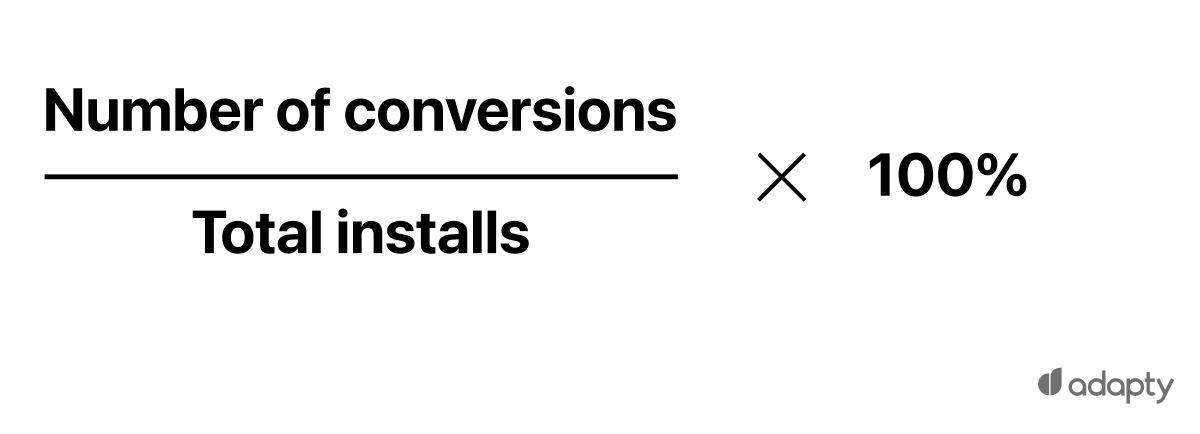
To increase the conversion rate, you should start optimizing the funnel. You can do it by testing different ad formats: change the description of the offerings for a user or partially adjust the design. You can also try various interface variables and analyze user interactions with the application.
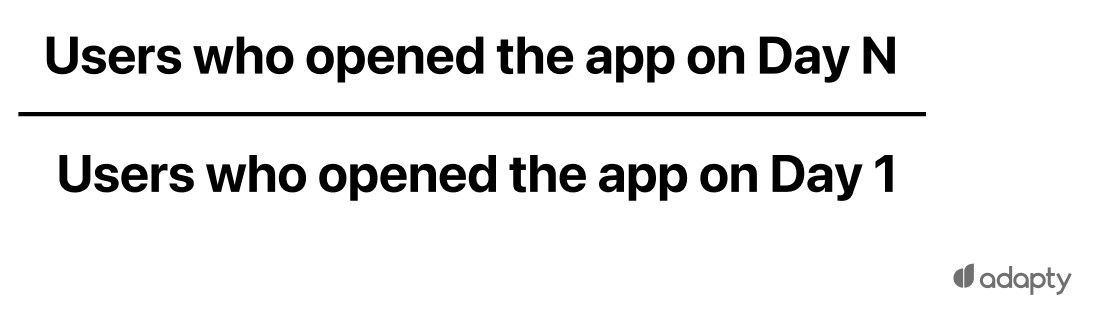
The customer retention rate will help understand how much the user is involved in the app during a specific period. You can calculate retention rate this way:
You may also identify possible reasons for unsubscribing users with cohort analysis. The idea is to divide users into groups (cohorts) according to certain criteria and track these groups' key metrics at different periods. By following the cohort's behaviour, you can determine why users don't get to the funnel's next stage.
After the trial period, the app is monetized. The user pays for the subscription and makes purchases within the service. To measure the effectiveness of in-app promotion campaigns, the marketer can calculate the return on investment (ROI) in the campaign, taking the gross profit from the paid subscriptions as a basis. You can calculate the ROI from app advertising on a particular channel for the control group of users the following way:
There are other metrics available to evaluate your funnel's quality. Let's talk unit economics.
Miscalculations in Unit Economics
Unit economics answers a simple question: how much money does a company get from a single user?
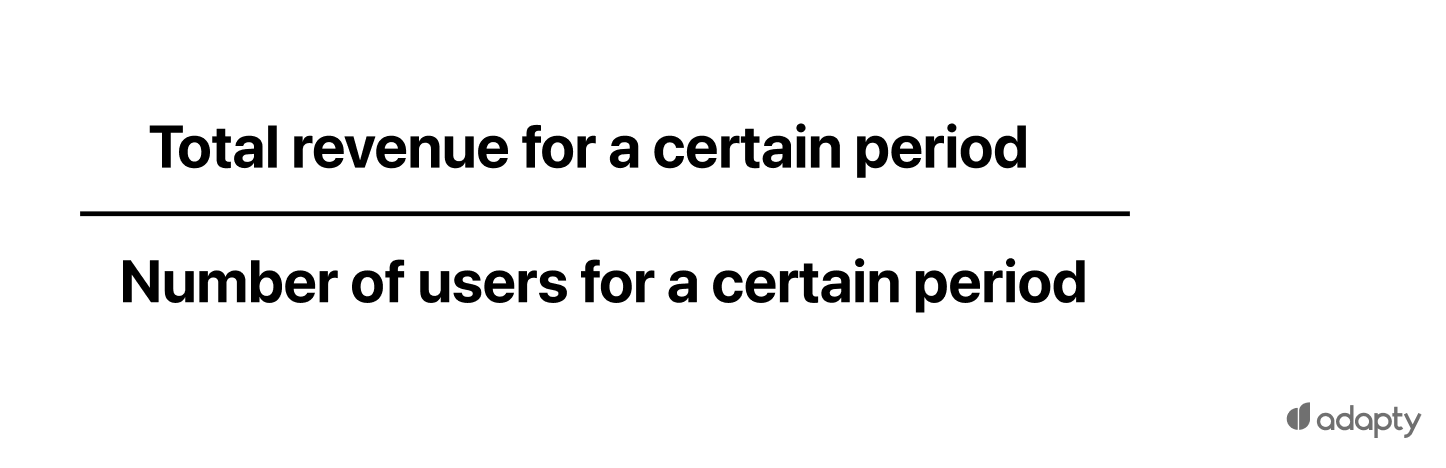
First, it is essential to separate ARPU (Average revenue per user) and ARPPU (Average revenue per paying user). While both are indicators of the app's monetization effectiveness, ARPU applies to all users in general for the period under review. Meanwhile, ARPPU refers only to those who made a purchase. The ARPU calculating formula is:
ARPPU is calculated the same way, but taking into account only a number of paying users.
To evaluate your earnings on the attracted users, look at the customer lifetime value (LTV) and customer acquisition cost (CAC). The first one can be calculated like this for subscription business:

The lifetime here means the average period users are interacting with your service. If users of your app subscribe for half a year on the average, so six months would be the lifetime and the period for ARPU calculating.
You can understand how sustainable your subscription business model is for any period of time, taking into account LTV and the customer acquisition cost (CAC). The last one is calculated like this:
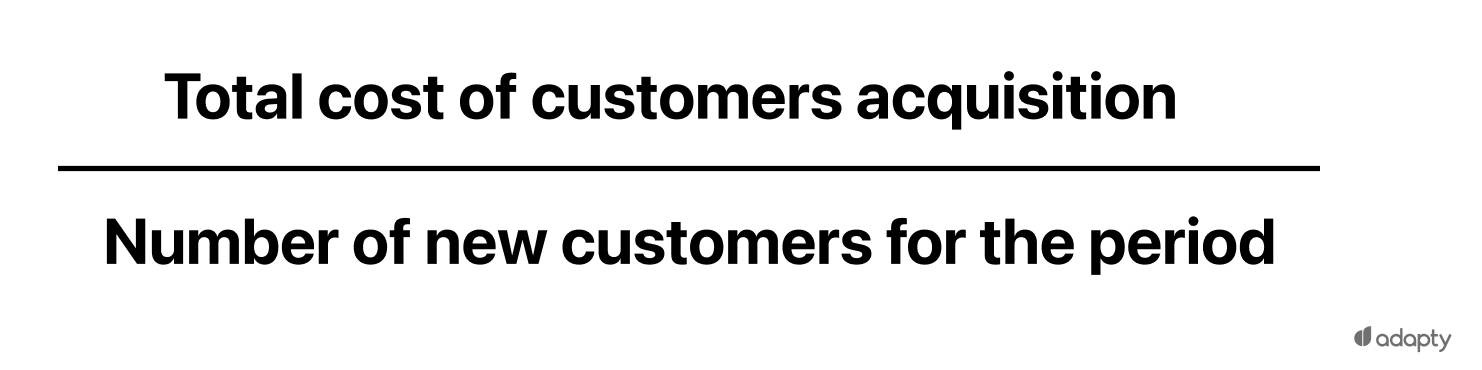
The total cost of customer acquisition usually equals to ad budget.
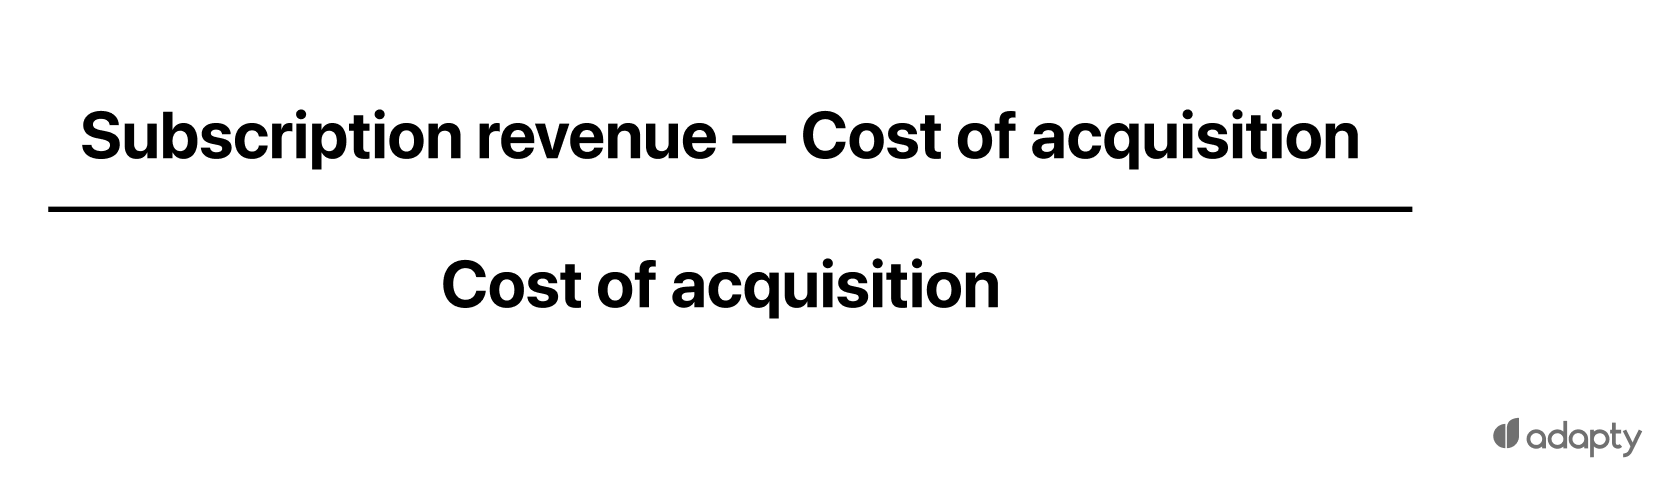
To estimate the effectiveness of your subscription business, look at the ratio:
It's easy to make a mistake at this step, although it seems to be simple. First of all, CAC depends on what the acquisition is: it can be e.g. install or the first purchase. Secondly, the results of LTV and CAC comparison at the first purchase stage may not be entirely correct. Several stages of the funnel, like the second purchase, the third one, etc., show when the user churn ends (and whether it ends). So it would be more relevant to calculate LTV taking into account the regular users.
Try to avoid the equality of LTV to CAC. In case your LTV is the same as CAC, your marketing brings no income and it's time to revise your strategy. Accordingly, if LTV is less than CAC, marketing operates at a loss. If LTV is twice higher than CAC, you have profit, but it's not usually big enough. The optimal ratio LTV:CAC is 3:1 and more.
These metrics would also help to analyze the traffic. When working to increase these indicators, in the marketing strategy there should be paid special attention to where users come from.
Mistakes In Traffic Attraction
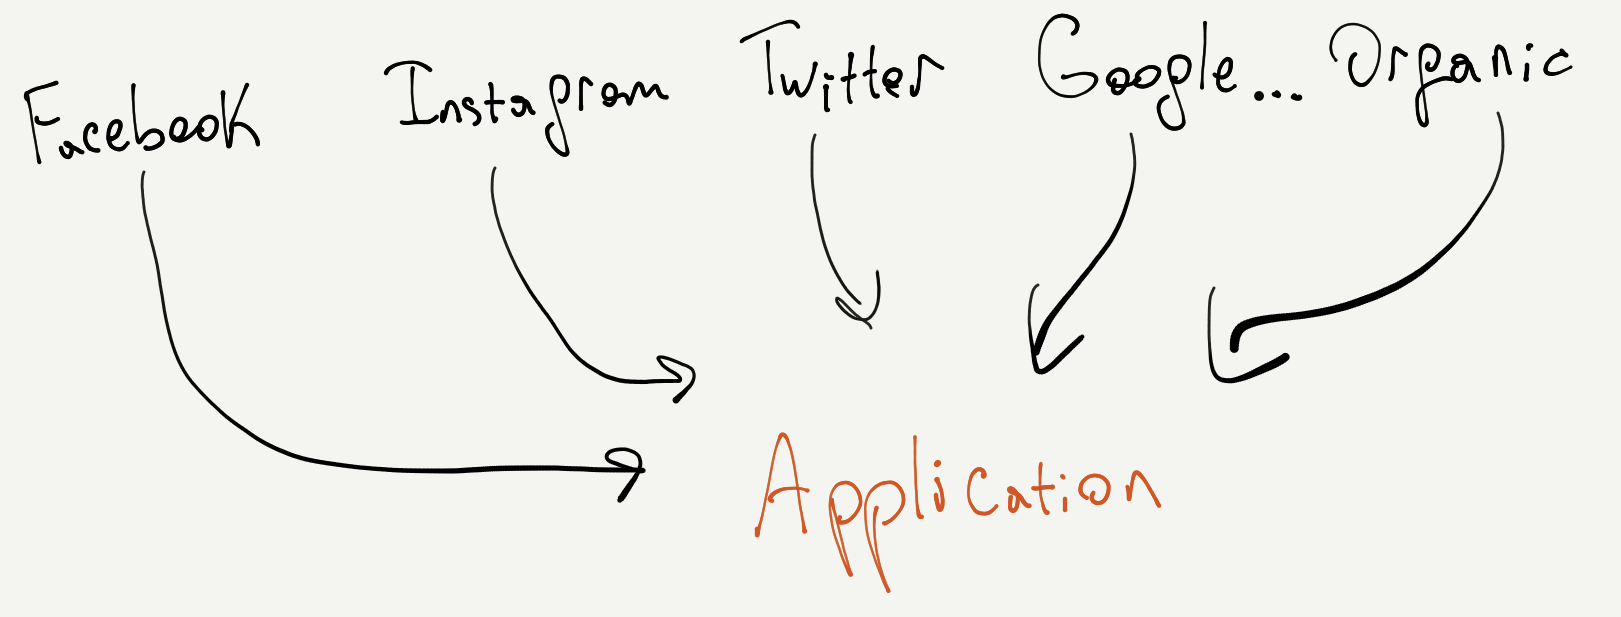
Some mistakes can be done because of an inappropriate traffic source. The kinds of traffic involved in the iOS app can be divided into targeted, organic and motivated. The first one refers to users interested in the content and services that your application offers. Organic traffic is the kind of traffic you don’t pay for, e.g. search engine users. Motivated traffic is a stream of users who are attracted by a bonus for installing your service. Now try to figure out which one is worth emphasizing with your app.
One of the sources of targeted traffic is social networks, e.g. Twitter, Facebook, and Instagram, which offer various targeting tools. An example of targeted traffic could be also clicks on ads placed through the Google Ads platform it displays contextual advertising as well as advertising in a search engine.
The type of quality traffic for iOS service is organic traffic. It refers to all the users who weren’t attracted by marketing campaigns and includes those who were redirected to your app page by a search engine. To increase organic traffic, it’s worth spending marketing efforts on App Store Optimization, which we mentioned earlier. You can optimize the application page by writing key queries in the name, adding a catchy graphic icon, screenshots that most fully reflect the functionality of the service and making a comprehensive description. And it’s just a part of ASO.
Bringing the application to the top positions of the App Store allows the application to get into the catalogs of App Store through special collections of applications that are most often viewed by visitors — it’s called to be “featured”. The hit indicators are affected by the number of downloads and positive feedback. The “featured” effect can be prolonged by regular App Store Optimization.
The application position in the App Store can be increased by motivated traffic. It works so that users begin to download your app for additional motivation like bonuses in a game or affiliated service. Among the new “users” of your app could be people who are not even interested in it at all. Nevertheless, the mistake of the marketing specialist of the subscription service is to lay the main emphasis on such traffic because of its cheapness and speed. So, if you are not ready for a sharp outflow of users and a decrease in the conversion from trial to subscription, it is better to focus on attracting targeted traffic.
The examples of motivated traffic sources are advertising platforms specializing in the promotion of mobile applications, such as Unity Ads and AdColony. Developers can get targeted users by placing banners, video and other types of ads into mobile apps. The services like Unity Ads also help companies to create the ad gallery in their services and to monetize them.
The universal optimal option for high-quality traffic to the application is social networks. There you can attract potential customers who did not plan to install a new application. At the same time, contextual advertising can “catch up” with users, even when they no longer need the product. The same applies to banners in games.
In order not to miscalculate the purchase of traffic, you should analyze the effectiveness of each channel focusing on the specifics of your app. For example, if you have a game application, it’s better to place banners in other mobile games to attract traffic. In case you created a dating service, social networks are the best place to promote it.
Also, to determine the quality of customers or traffic through different channels, it is worth analyzing the ARPU and ARPPU indicators for users who came from each channel (organic search, contextual advertising, social networks). So you can choose the priority one and revise the strategy in future promotions. And the price metrics would help not to miscalculate the cost of marketing.
Skipping Key Price Metrics
When you purchase traffic for your application, evaluate the effectiveness of your ad via different metrics, such as CPI (Cost per install), CPA (Cost per action) and CPC (Cost per click) promotion. They will help you to understand if you've paid too much for minimal effect.
The first thing you should start with is the CPI, which is calculated like this:
Cost of ad spend / Number of new installs from ad
If an advertiser chooses to pay for installs, he pays only for real conversions — and this is an advantage. The disadvantages are the high cost and the probability to receive fraud installations with subsequent unsubscriptions. Also, the App Store doesn't technically report on install until the app is opened by the user. So the number of installations can be not always correct.
In the case of a subscription app, the more relevant metric is CPA, in which the action is commonly the activation of the trial subscription. Its value is calculated as:
The total cost of advertising / Number of actions
Here an advertiser pays not for impressions and clicks, but in fact for each user who has expressed interest in the app.
And the last metric is CPC. This is the amount that an advertiser pays to the platforms and search engines for redirecting the user to the App Store. It is calculated as:
The total cost of advertising / Number of clicks
The CPC allows to track how much the product is interesting for users. However, in the case of subscription apps, the action, such as trial activation, is more critical.
It's not enough to calculate each of these costs. When choosing a traffic source, a marketer needs to rely on average market indicators. For example, the average CPI for an iOS app in the United States at the end of 2018 is $2,07 (according to Business of Apps). With plans to launch a campaign on Google Ads, you can block from about $1 to $2 per click if your ad doesn't contain "expensive" keywords (e.g. "law" or "insurance"). Taking into account these points, it would be clear how viable and effective your marketing is and whether it works at a loss.
Adapty lets you know where it goes wrong
"Where could I be wrong?" In fact, on any step, from creating your sales funnel and calculating in unit economics to launching a campaign and summarizing it.
You can carefully monitor the behavior of the audience at each stage of the funnel, and optimize conversions. But users churn without having made their first purchase or even not activating the trial. Just because you've chosen the wrong traffic source for the service. Or, on the contrary, you calculated the cost of campaigns, purchased the most suitable traffic, but the CLTV is less than CAC.
It's easy to make a mistake, even if you are a pro. However, to avoid miscalculations and analyze why a subscriber becomes a churned subscriber, high-quality mobile analytics tools are needed. For example, systems such as Adapty quickly show how and at what point in time the audience has changed. With the help of visual data, you can quickly adjust marketing strategy and run new effective ad campaigns to win back churned users.