Average revenue per unit (ARPU) explained

The Average Revenue Per Unit (ARPU) metric, which is often mistakenly used interchangeably with the Average Revenue Per User (also ARPU!) metric, tells you the average revenue you make when you sell a unit or an in-app product.
When properly analyzed, the Average Revenue Per Unit metric can reveal your most revenue-generating product. At Adapty, we’ve seen numerous customers leverage this data to realign their marketing strategies, optimize their spending, and ultimately increase their profitability in the long run, while also meeting their short-term goals and future-proofing their monetization models.
So, let’s see what the Average Revenue Per Unit metric is, how it can be calculated for your in-app products, how it differs from your Average Revenue Per User metric and the many ways you can use it to grow your mobile app.
Here goes.
What is Average Revenue Per Unit (ARPU)?
The average revenue per unit metric gives you the average revenue you make from selling a “unit.”
Here’s what this metric means for a mobile app business:
Suppose you’ve got a subscription app with weekly, monthly, and annual plans. So, each of your plans is a product or a “unit.” If you do an Average Revenue Per Unit analysis for all your products, you’ll easily see how much revenue you make when you sell a weekly, monthly, or annual plan. Comparing the revenue you make from your different plans shows you the profitability for each so you can make more informed decisions. For example, if your annual subscription brings you the most revenue but sees fewer sales than your weekly or monthly plan, you’d want to promote the sale of your yearly plan over the other options.
Let’s now see how you can calculate your Average Revenue Per Unit metric for your in-app products.
How do you calculate Average Per Unit Revenue?
To calculate your Average Revenue Per Unit metric, simply divide your revenue from the total sales of a unit for a period by the number of units sold:
Average Revenue Per Unit = Total Revenue / Number of Units Sold
If you generate $5,000 in revenue from selling 100 annual subscriptions, your ARPU for your yearly plan can be calculated as follows:
ARPU = $5,000 / 100 = $50
That means, on average, you earn $50 from each annual subscription you sell.
As you can see, ARPU is a valuable metric as it provides insights into the profitability of your different products (units).
A few caveats to keep in mind when working with the Average Revenue Per Unit metric
Zoom out for a better perspective. In the example we just saw, we calculated the average revenue for the annual plan, which came out to be $50, meaning that you make $50 with the sale of each plan. Assuming this is a new user, this would be their first payment. If you truly want to understand the revenue potential of your annual plan, the ARPU metric alone may not suffice. You’d need to factor in the lifetime value for the annual user segment, too. Likewise, the ARPU for the monthly plan might be significantly lower than that of the annual plan on the surface level, but then the monthly plan is also priced lower, and you’d, again, need to factor retention into your calculations to get better insights.
It’s essential to consider promotional offers. Subscription apps often push their higher-end plans with significant discounts on the first term. Such introductory offers can skew ARPU analysis, so factor those in.
Watch out for trends. As you reorganize your marketing and sales ops to promote your more profitable product(s), keep re-evaluating your ARPU. It can fluctuate as your spending changes and also due to external conditions impacting the volume of sales.
Three key use cases for ARPU analysis for mobile app businesses
Redistributing user base for long-term growth
One of the most important use cases for performing Average Revenue Per Unit analysis is to see if you’re getting more of your users to buy your most profitable products. For example, if your ARPU analysis shows that you make the most revenue from selling annual subscriptions, you should see what percentage of your paying users subscribe to them.
If your users seem to prefer your monthly or weekly plans, you may want to prompt them to purchase your annual plan.
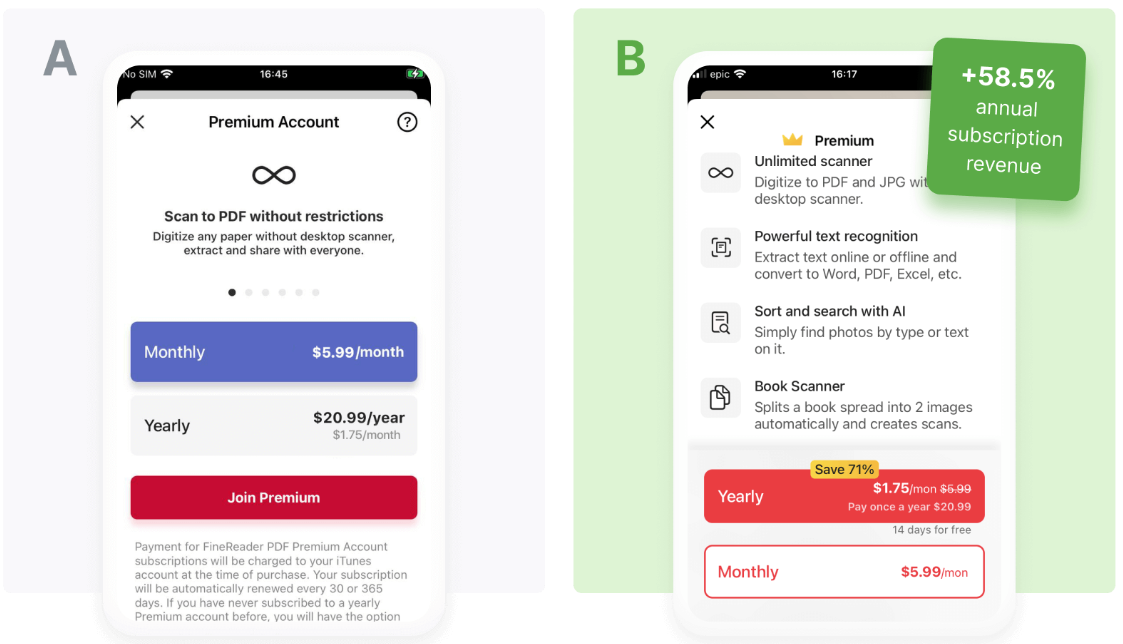
When ABBYY, a business apps maker, saw that its annual plan was a winner when it came to revenue, it decided to pitch it aggressively over its monthly plans. Below, you can see how ABBY tested two versions of the paywall, with the second one going all out to make the annual plan a natural choice for subscribers. You can see how it uses a mix of a heavy discount offer, a free trial, and strong visual cues to get more users to choose the annual plan over the monthly plan. As a result of this experiment, users ended up selecting the yearly plan twice more often than the monthly option, increasing the revenue from annual subscriptions by 58.5%.
This same analysis can work for short-term growth, too.
Sometimes, you may need to prioritize your immediate financial goals. For example, you may need to generate some quick capital to fuel your growth. If you’ve got a subscription app, one way to do this could be to pitch your annual offer with a heavy discount or maybe even launch a lifetime plan. If you do your ARPU analysis for all potential options, you'll already know how much revenue you’ll make from your sales. You might even just hike your price, offer a better discount, and still generate decent revenue per sale.
Getting your product mix right (pricing-wise)
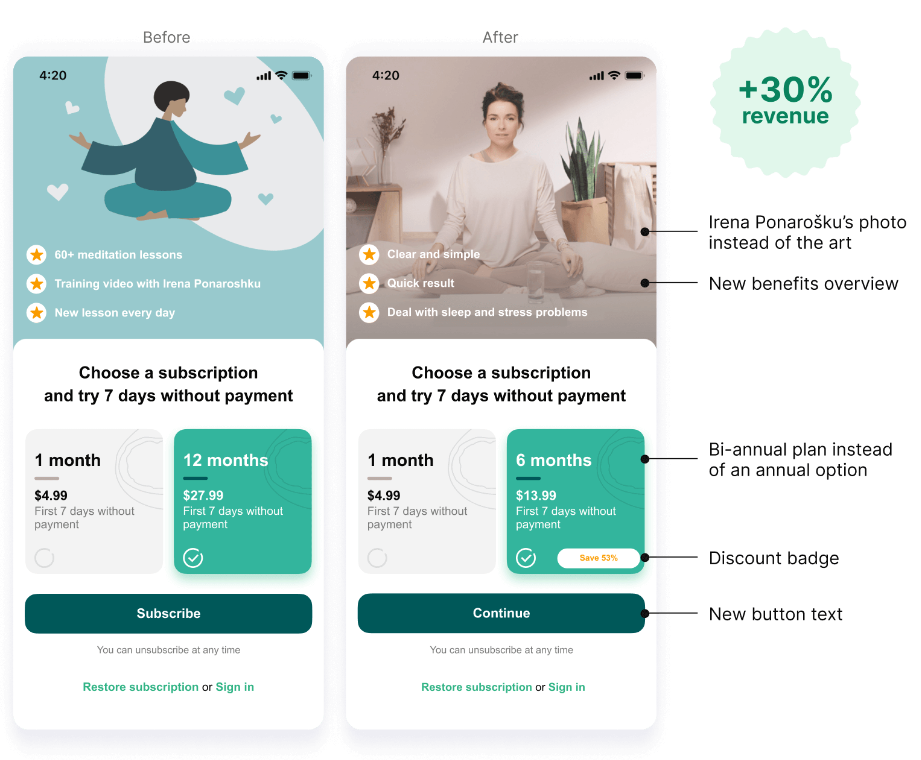
Analyzing your Average Rate Per Unit metric also helps you get your product mix right. How? Performing Average Rate Per Unit analysis for all your products tells you your revenue potential for all, which means you can easily tell which one you should be selling more of. But sometimes, the price point for your best products feels a little steep to your users, which might get in the way of selling more of it. In such cases, you can design a product that effectively works the same way. For instance, converting an annual plan into a 6-monthly one can do the trick. The meditation app Prosto did precisely this. It realized that its annual plan felt a little steep to its users, and so it introduced a 6-monthly plan and successfully got a good share of its monthly users to go with the bi-annual plan. Sure, this makes less revenue upfront than the annual plan, but still!
This example also shows how you must add user research to with your ARPU analysis.
Developing a good product mix and monetizing better
If you’re like most subscription app makers, you probably don’t make $1000/mo from your app. If you conduct an ARPU analysis for all your subscription plans right now, you’ll realize why you aren’t breaking the $1000/mo barrier. The revenue per sale isn’t high, and there aren’t many sales.
Bringing in more sales means investing more money into marketing. Things like introductory offers further cut into revenue. And then there’s churn. So you don’t make a lot of recurring revenue from your subscription plans from most of your users.
In most cases, you may see yourself testing higher pricing to make more revenue, impacting both your new user conversions and renewals.
Yet another way to go about this is to diversify your monetization methods, primarily through non-subscription in-app purchases that look like easy buys compared to subscriptions. Again, this is one area where ARPU analysis can prove handy. You really need to think at the unit level to make these in-app products work and ARPU analysis is meant for this.
The role of experimentation in optimizing the Average Revenue Per Unit metric
As you may have realized from the above examples, using the insights you learn from your ARPU analysis to grow your revenue needs extensive experimentation:
- You might want to experiment with new pricing to see if revised prices can still drive enough sales to boost revenue and profits.
- You could also try experimenting with newer incentives like free trials or discounts to push your most profitable products.
- You may also want to add newer products with better revenue potential.
Now, such experimentation has several moving parts.
Paywalls: First, you need to work on your paywalls. So, if you want to offer a free trial on one plan, a discount on another, or simply visually pitch a preferred plan over the others, you need to work on your paywall.
Payment testing: You need to test the newer offers, products, and promotions to determine whether they are working. Ideally, you’d show half of your users your default paywall (or products or promotions) and the remaining half the newer ones. Such paywall A/B testing can show how users respond to your newer pricing, products, and promotions.
Long-term revenue analytics: You also need to know what the sales and users you acquire as part of your experimentation actually translate to in the long term. So you need reporting on metrics like customer lifetime value, among others.
Enter Adapty
Once you add Adapty to your app, you can set up paywalls inside your app using Adapty’s no-code paywall builder. When you’re ready to experiment with your paywalls, simply take an existing paywall and start an A/B test on it by keeping the original and adding a duplicate with just one click. You can test almost anything that lives on your paywall (like your products, pricing, and promotions). Finally, with Adapty’s best-in-class analytics, you’ll get all the reporting you need, not just on how your products are doing during the experiment and long-view metrics but also forecasting on what your revenue might look like.
Before we wrap up, let’s quickly see how the Average Revenue Per Unit metric differs from the Average Revenue Per User metric.
Average Revenue Per Unit vs. Average Revenue Per User
When you talk about your Average Revenue Per User metric, you’re looking at the average revenue you make per user. In contrast, your Average Revenue Per Unit concerns the average revenue you make when you sell an in-app product.
Your Average Revenue Per User metric tells you about your user base and their spending patterns. Your Average Revenue Per Unit metric, on the other hand, shines light on your product mix and the revenue potential of your different in-app products.
You typically analyze your Average Revenue Per User to answer questions like if you’re recovering your customer acquisition costs and how much revenue adding X more users could bring (given the average revenue per user). But with the Average Revenue Per Unit metric, you’re trying to get a user segment that’s getting your most profitable product, building the right products with the right price points, and improving your revenue streams through upsells/cross-sells.
Mostly, you’ll see businesses use these terms interchangeably, but as you can see, they’re fundamentally different.
Wrapping it up…
As you just saw, the Average Revenue Per User (ARPU) metric is one of the most important metrics when it comes to designing, pricing, and optimizing in-app products.
With ARPU analysis, you can price your products for higher revenue, determine what products you need to sell more of, and identify opportunities to launch new products as upsells and cross-sells that can further boost revenue.
But you need experimentation to really execute your insights from ARPU analysis. So when you perform ARPU analysis, also consider adding a solution like Adapty to your app marketing mix. It’s only when you experiment with newer price points, products and promotions that you can know what works for sure. Get in touch to see how Adapty can do all this for you and more.