On the 6th of April, Adapty experienced a pretty rough outage: we couldn’t process about 23% of requests from 8:15 am to 5:40 pm UTC. At the same time, nearly a half of the other requests were taking much longer to be processed than usual.
We understand that the availability of our services is crucial for the businesses of our clients. We would like to apologize for what happened. We invest a lot in our infrastructure to ensure the data is safe and our services are up and running.
We failed yesterday and want to give a detailed explanation of what happened. We will also discuss what we’ve done and will do to prevent such incidents in the future.
TL;DR
API was down because:
- We used up full CPU capacity on hashing and this slowed down requests. We shouldn’t have faced this issue, though, as we have unlimited CPU capacity and we await a response from Amazon Web Services (AWS) support regarding this case.
- We identified the issue correctly and early on, but the fixes didn’t work because they were not rolled out the way we expected.
- We were confused by the AWS saying there’s a problem with the critical services we use and spent a couple of hours going in the wrong direction.
- After a thorough examination of the multiple services by several members of our team, we were able to roll out the fixes from step 2 and restore the full functionality of the API.
To prevent this from happening in the future:
- We will stop using a specific type of server until we get comments from AWS support.
- We have introduced new metrics to our monitoring system.
- We will hire an external technical support team to help us find and solve these issues faster.
What happened
Everything started the day before the incident took place. We rolled out a new version of our backend API around 2 pm UTC. There were a couple of minor changes (or so it seemed): a new LTV metric for A/B tests and a response hash for all responses. The new functionality was well tested both manually and automatically while this hash was needed for internal purposes. We checked the metrics after deployment and everything was fine.
Our SDK API runs mostly on AWS EC2 T3 instances. These instances are a perfect fit for workloads with low to medium CPU usage because they provide lower baseline CPU at a much lower cost. You can read more about them here. We successfully used them for more than a year and never had any issues. The tricky thing is if you unexpectedly consume too much CPU, at one point the CPU will be throttled, and everything will slow down considerably.

AWS has an unlimited mode for CPU credits to prevent throttling. It was enabled for our instances but for some reason didn’t work. We are waiting for a response from the AWS support team regarding this.
Hashing is a CPU-intensive task. When we rolled out the new version of the code, we haven’t noticed CPU degradation because we have lots of unused credits. The number of credits was decreasing quite fast because we were calculating the hash on every request and we processed close to 100M requests per day. All the credits were completely used up by the morning of the 6th of April. But we’re not aware of this because we haven’t set up alerts for CPU credits as we thought we had unlimited CPU credits.
Identifying the issue and quick fixes
We started seeing 502 and 504 errors in our metrics, and they were increasing at alarming rates. These errors were returned by ALB (load balancer) and not our API; so at first, we decided that the problem is not related to the codebase. We checked the database, PgBouncer, caching and messaging layers, and external services that are used in our API. Everything was fine. We then checked CPU usage, and it was at 100% for more than 12 hours. This was when we realized the problem should be in hashing. It was around 9 am.
We deployed the previous version of the code without hashing. Nothing happened, the CPU usage was still at 100%. We decided to replace all T3 instances in our fleet with C5 (optimized for CPU workloads). It took another half an hour for all instances to be replaced, we used Instance Refresh to do it. We were pretty sure that this would resolve the issue, but nothing changed.
This was when we decided to call out for help. We contacted AWS support and other engineers. We wanted to have an external look at our system and metrics because oftentimes outside people can find something “easy,” but you wouldn’t even think of it under pressure.
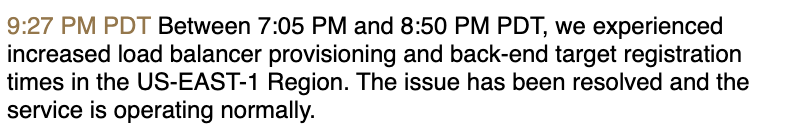
Communication with AWS support about load balancer failure
While we were waiting for a response from them, we checked the AWS status page and saw that they have problems with ALB in our region. At the same time, we started seeing 502 and 504 errors.
We checked the response time on our Django app and it was fine. We run multiple tests by making requests to the API and collecting end2end response times as well as internal (app) response times. Internal response time was always under 0.1 seconds when end2end sometimes was more than 10 seconds. We decided the problem was definitely in ALB. When AWS support and other engineers came to help, we fed them this idea. We also described the steps we’ve taken and checked to the moment. This was around 11:00 am.
AWS support team confirmed that they had this issue but after some time told us that it’s not the reason for our problem. They told us our backend was unresponsive and that caused the issue. We were skeptical about this because we have rolled back the previous codebase, we’ve changed the instances and it didn’t help. We also showed them the logs from our tests. They decided they needed more time to get a deeper understanding of the issue. This was around 1:30 pm.
Fixing the fixes
In the meantime, we were exploring Docker containers and discovered that they were killed every couple of minutes and then recreated. It usually happens when the container requires more memory than allocated and it’s killed by the ECS agent. But this was not our case. We realized the EC2 target group was killing them because the health check failed and the task was marked as unhealthy. We increased the number of consecutive failures needed for the task to be marked as unhealthy. For a moment it looked like this fixed the issue, but after a couple of minutes, it returned. That was around 4 pm.
This was when another engineer looked at the status of ECS deployment and noticed that it wasn’t completed even though it started several hours ago (normally it takes under 10 minutes). He then suggested that we should increase the timeout of the health check so that the deployment will be finished. We increased the timeout by five times and within 10 minutes everything was back to normal. This was around 5:30 pm.
The reason the new containers couldn’t be deployed was that ECS deploys them in groups. Let’s say, we have 100 containers in total. So instead of deploying 100 containers right away, it deploys 10 first, then another 10, and so on. It’s a little more sophisticated than that in reality but doesn’t change anything. Usually, you would have 100 running healthy containers, then ECS deploys 10 new, kills 10 old, and so on.
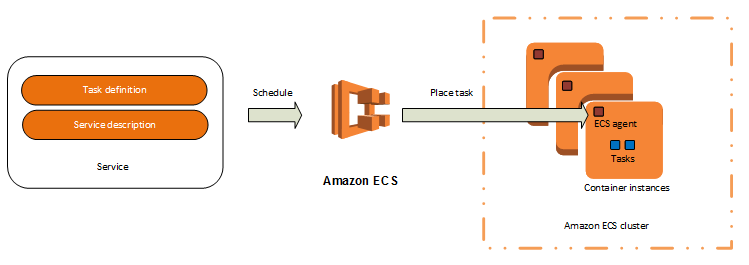
In our case, most of the running containers were unhealthy (they haven’t enough CPU). The 10 new containers that were just deployed got all the requests that are normally distributed among 100 containers. They were overwhelmed quickly, failed a health check, and were killed. The same thing happened to the next 10 and so on. When we increased the health check timeout, we gave containers more time to stay healthy, even though they were slow. During this time another 10 containers were up. Now, we have 20 healthy containers instead of 10. Soon enough we will have all 100 containers working with normal response time.
What we’ve done and will do to prevent such incidents in the future
- For now, we have replaced all T3 instances with C5 to have the maximum CPU available at all times. Once we receive an answer AWS regarding the problem with unlimited mode, we may include them back in the service.
- We have added CPU and CPU credit metrics to our monitoring system, so we will know in advance whether we’re going towards maximum CPU usage. We will also add the monitoring ECS deployment state to the checklist of things to be done when fixing something.
- We will implement a backpressure technique so we can avoid full-service degradation by dropping some non-critical requests.
- We will hire an external technical support team to help us find and solve these issues faster.
Thanks a lot to Igor Vasilcovsky for the help!
Kirill, CTO at Adapty